3910
Transcriptional level and neurotransmitter systems associate with brain abnormalities across Alzheimer's disease spectrum: a meta-analysis1Medical Imaging Center, First Affiliated Hospital of Jinan University, Guangzhou, China, Guangzhou, China, 2The First Affiliated Hospital of Jinan University, Guangzhou, China, 3MR Research,GE Healthcare, Beijing, China
Synopsis
Keywords: Alzheimer's Disease, Alzheimer's Disease, subjective cognitive decline, mild cognitive impairment, amplitude of low-frequency fluctuation/fractional amplitude of low-frequency fluctuation, cortical thickness
Motivation: Numerous neuroimaging studies have reported that Alzheimer's disease and preclinical AD have been linked to alterations in the amplitude of low-frequency fluctuation /fractional ALFF and cortical thickness of some brain areas.
Goal(s): However, the findings have been inconsistent and the correlation with the transcriptional profile and neurotransmitter systems remain largely unknown.
Approach: We conducted a meta-analysis to identify multimodal differences in ALFF/fALFF and CT in patients with AD and preclinical AD, using the Seed-based d Mapping with Permutation of Subject Images software.
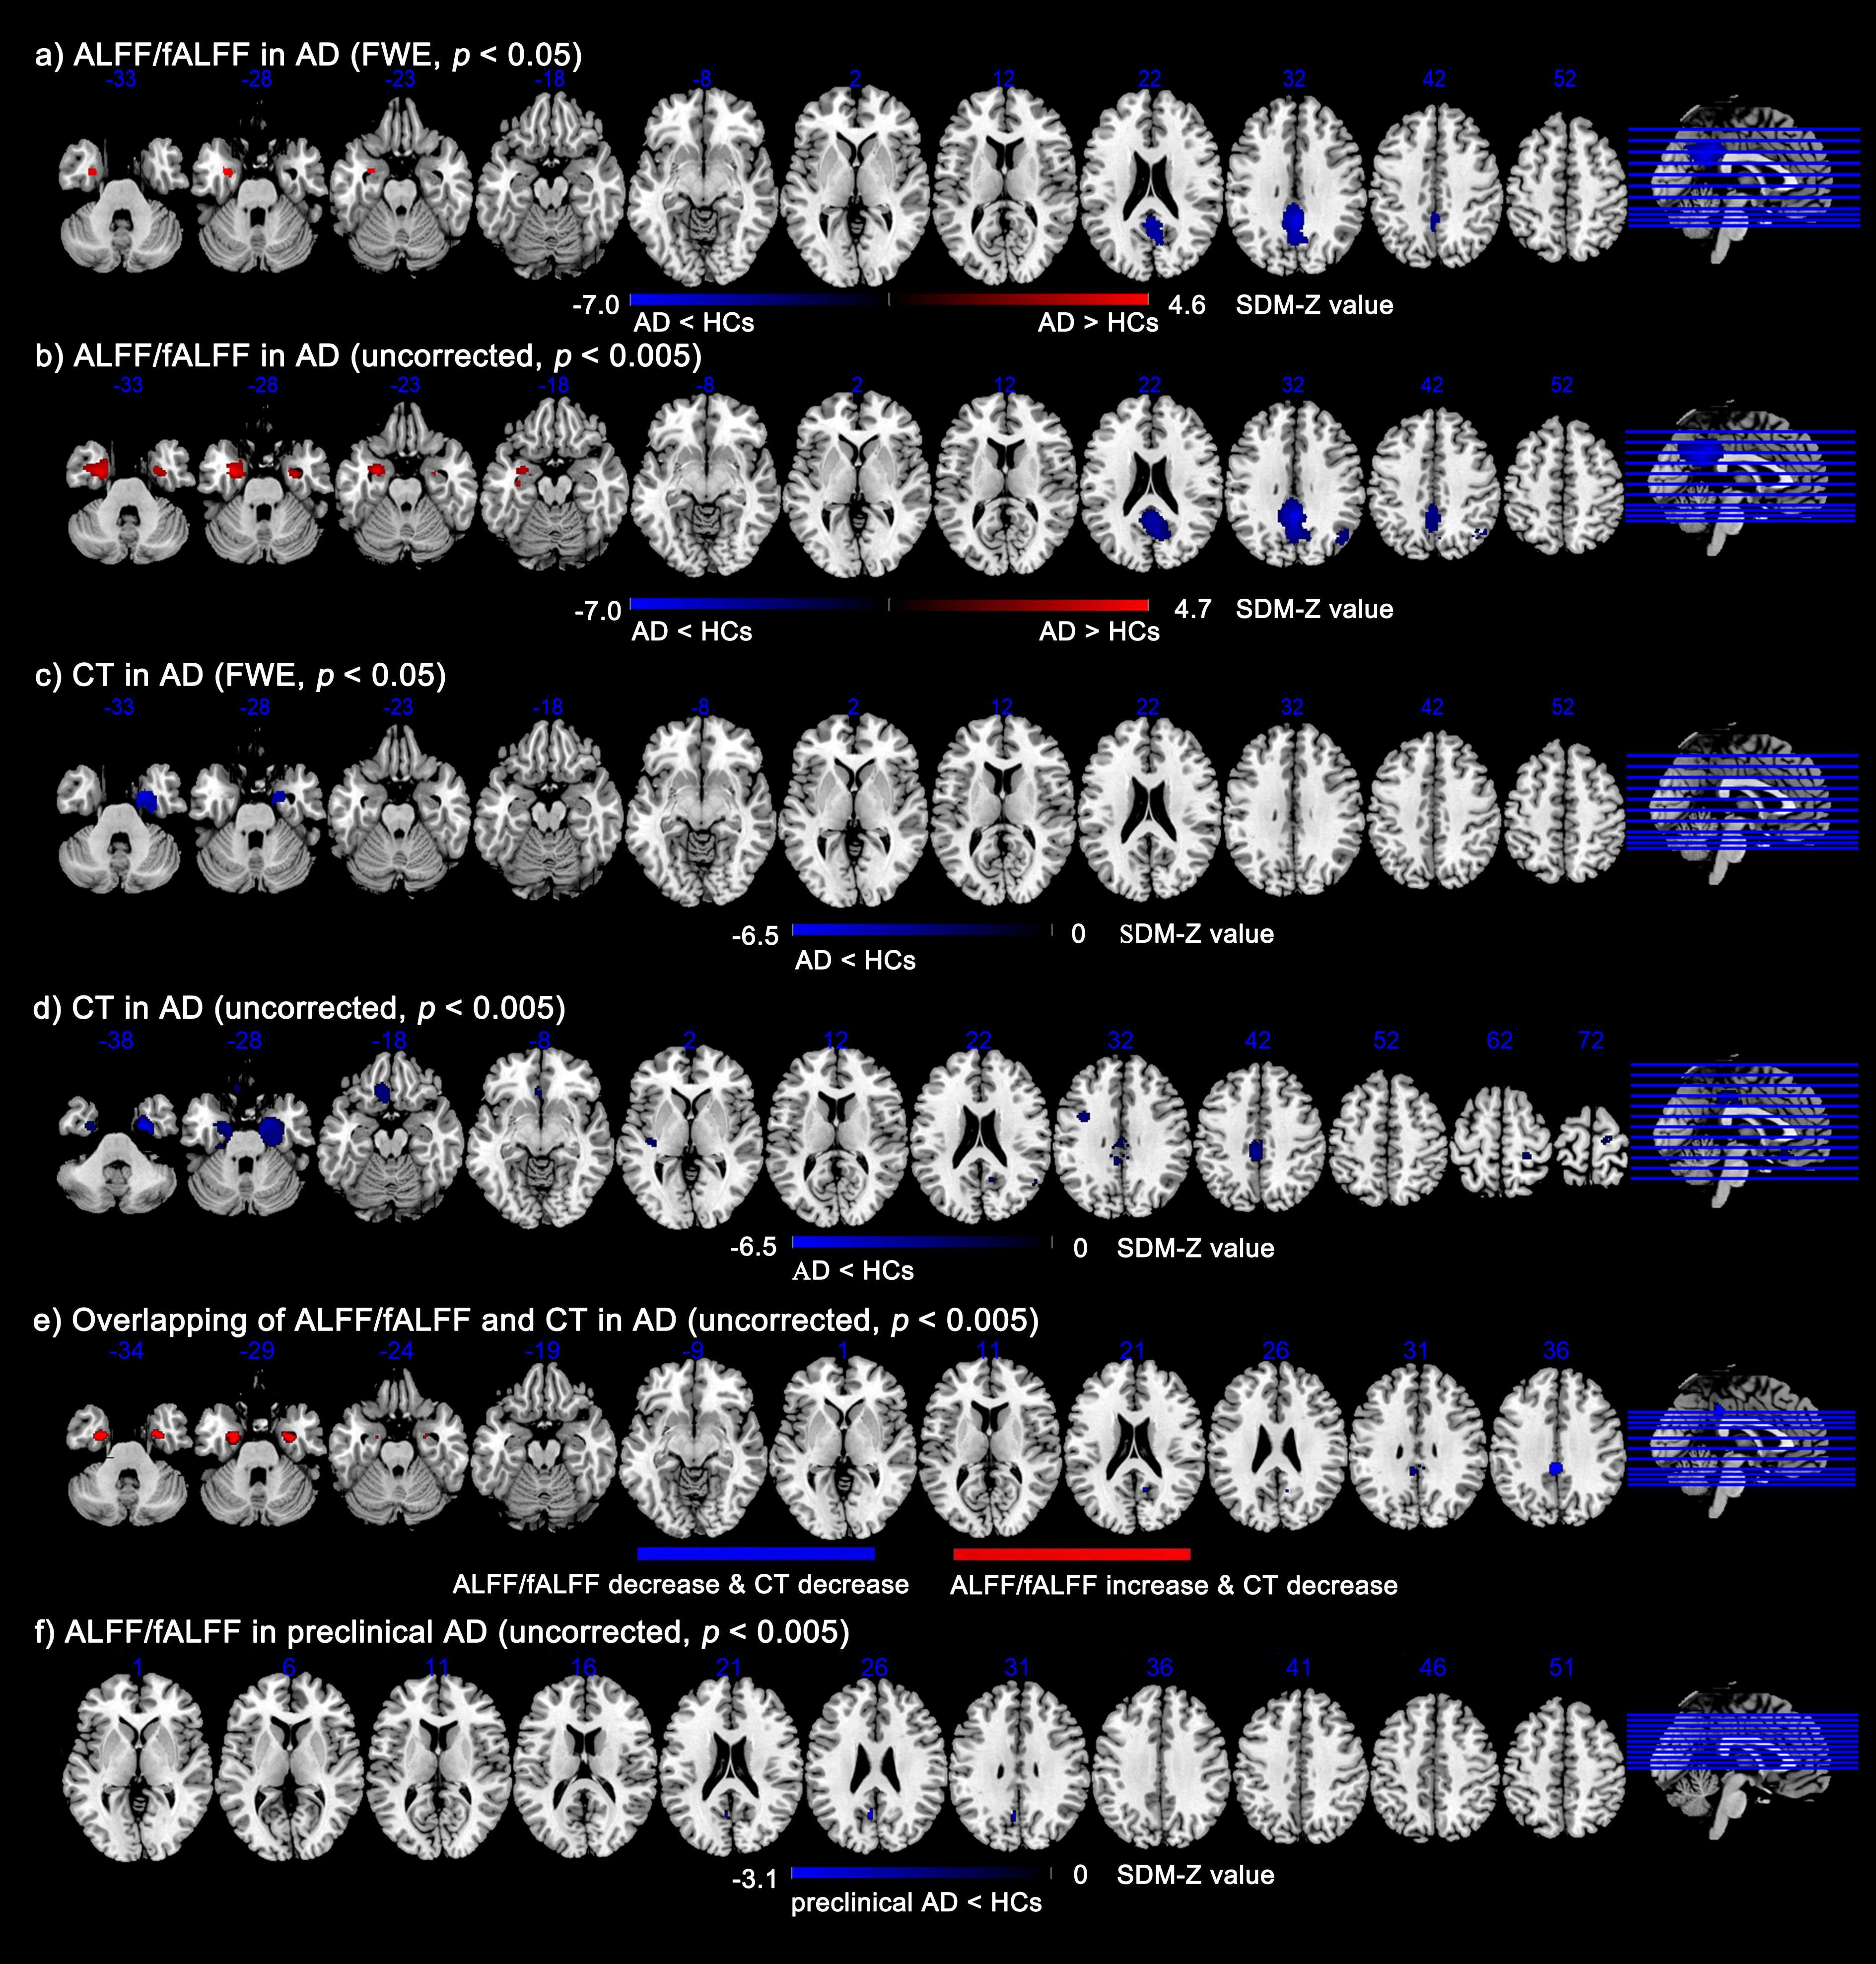
Results: Overlapping meta analysis showed that patients with AD displayed decreased ALFF/fALFF and CT in the left PCC.
Impact: These findings may provide different insights into the pathophysiology of AD spectrum.
Abstract
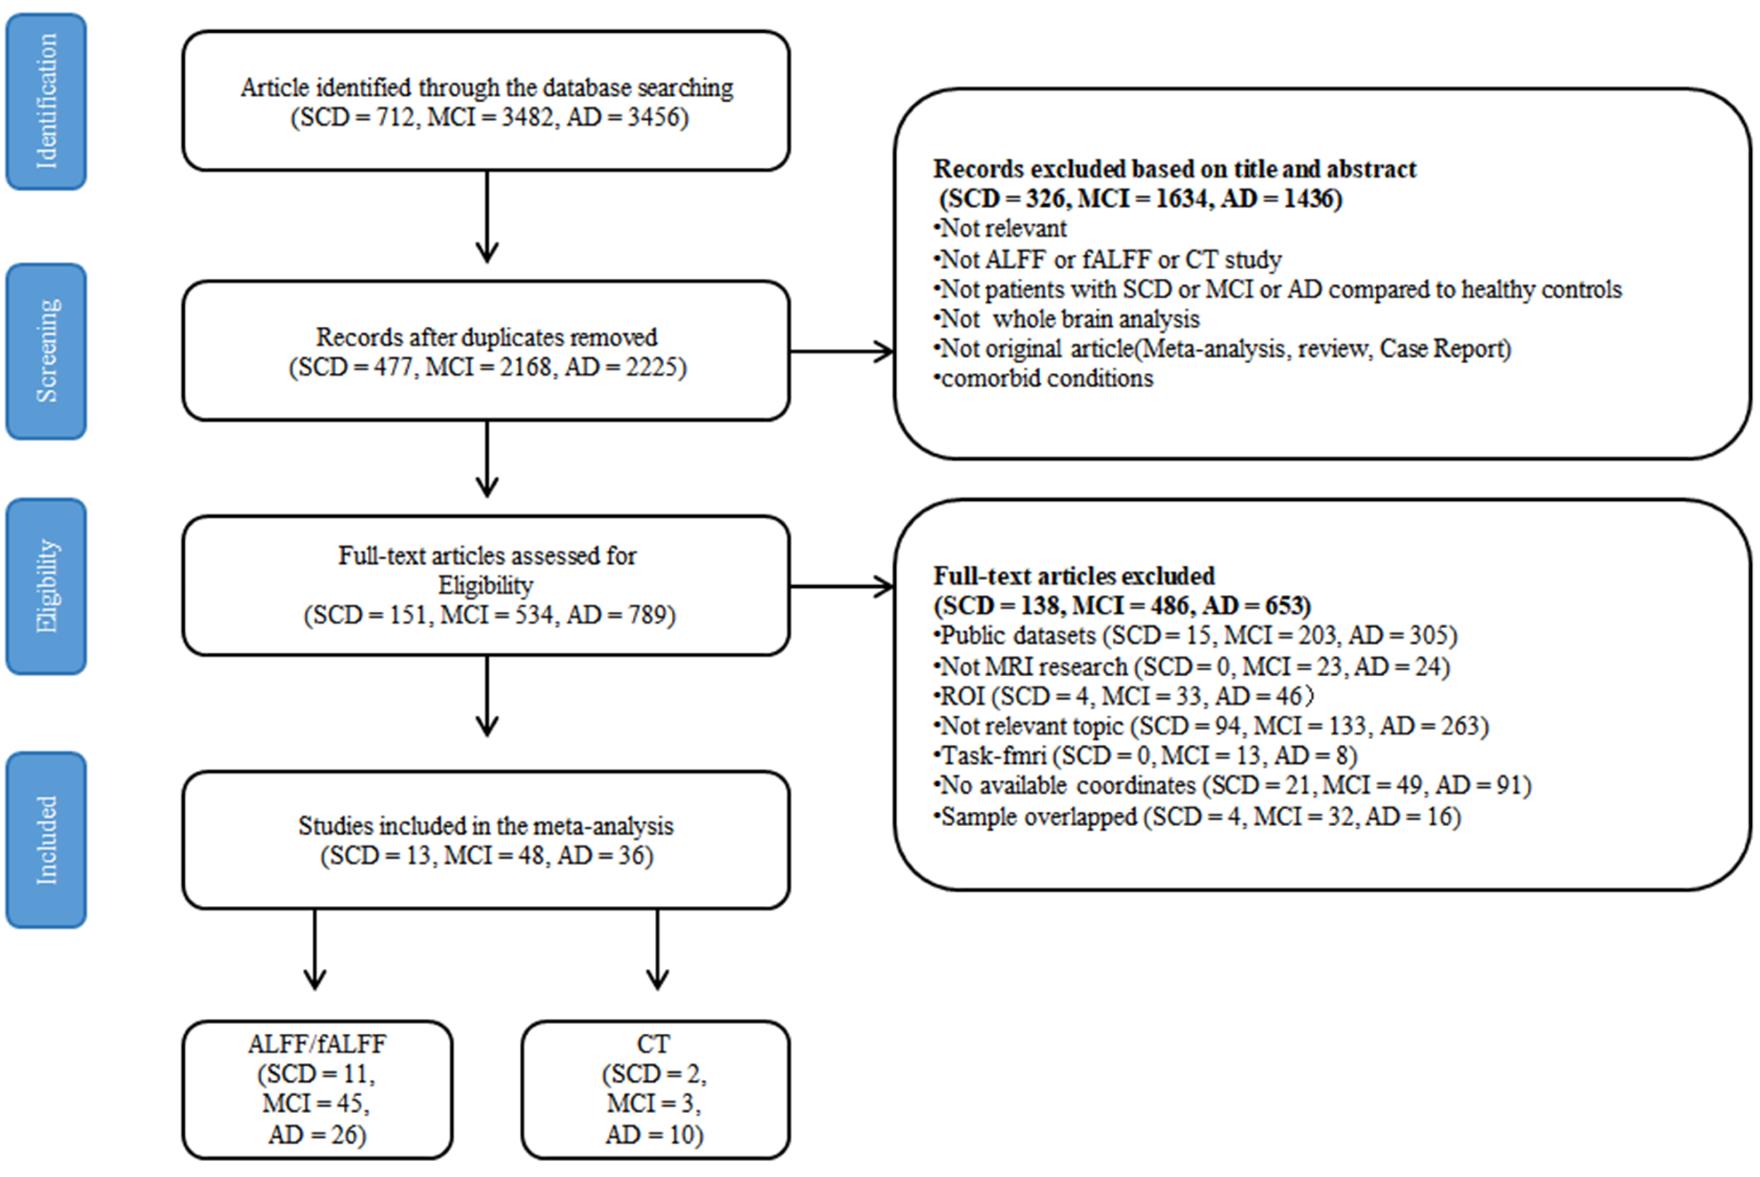
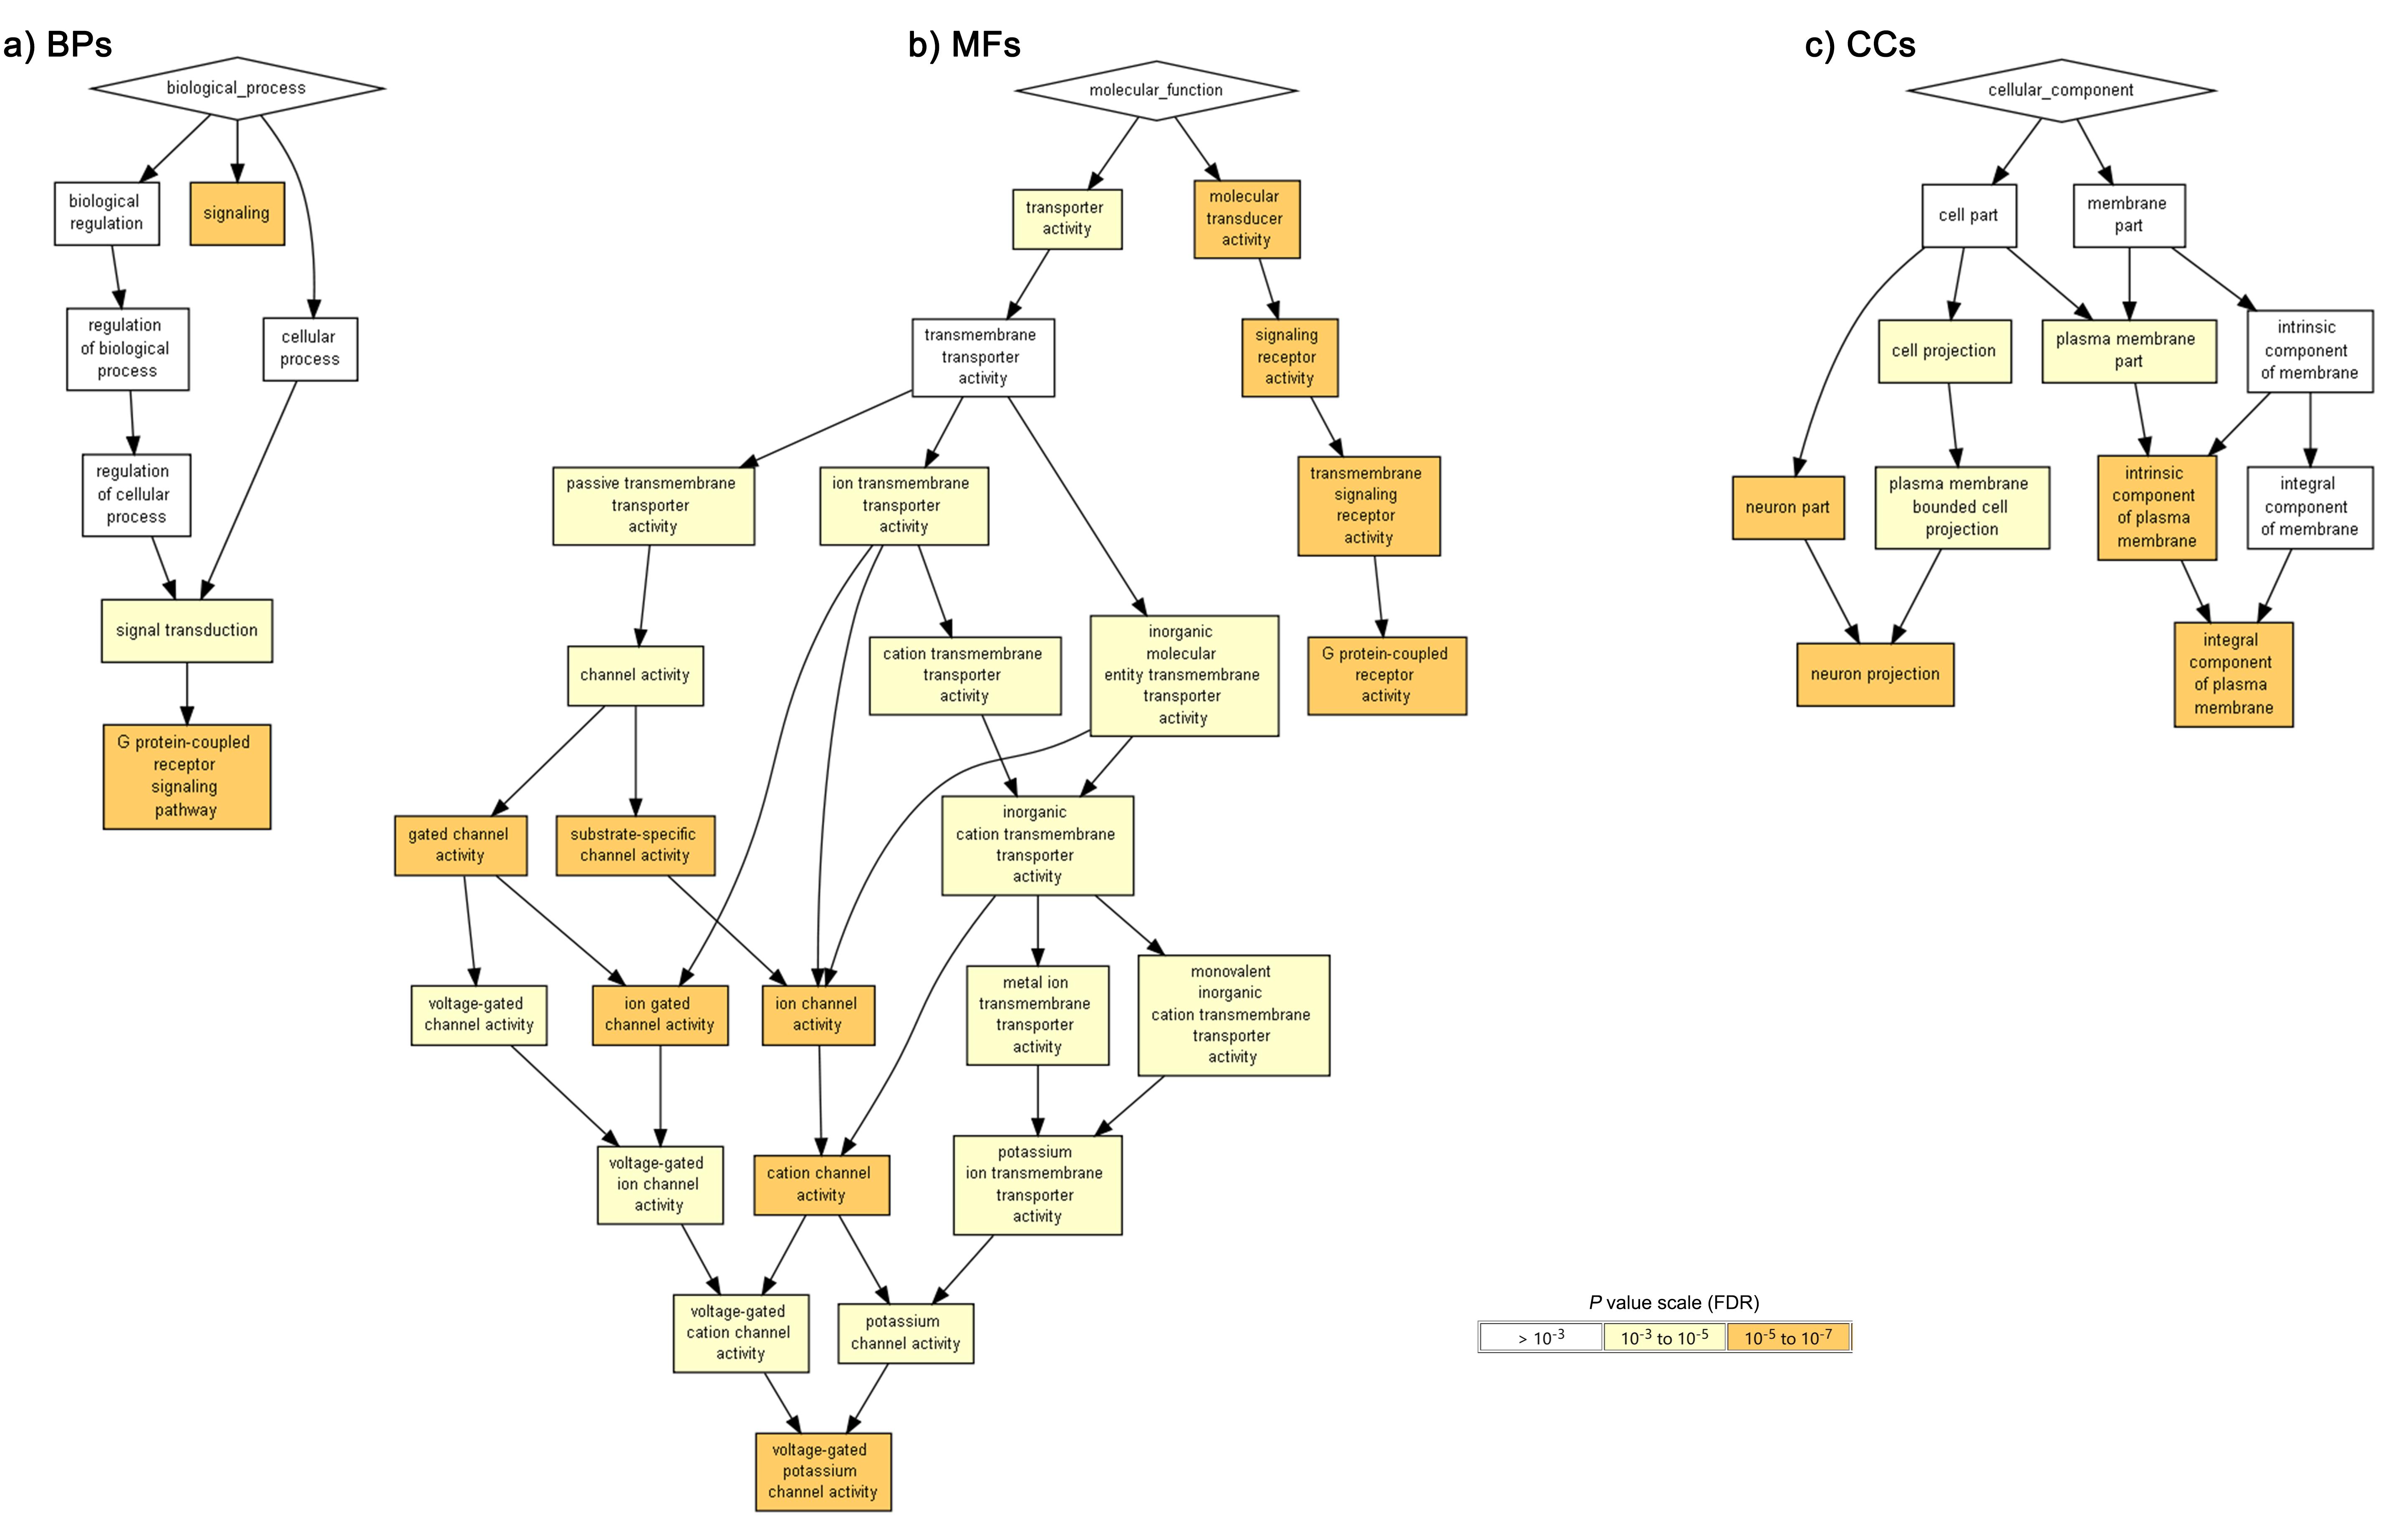
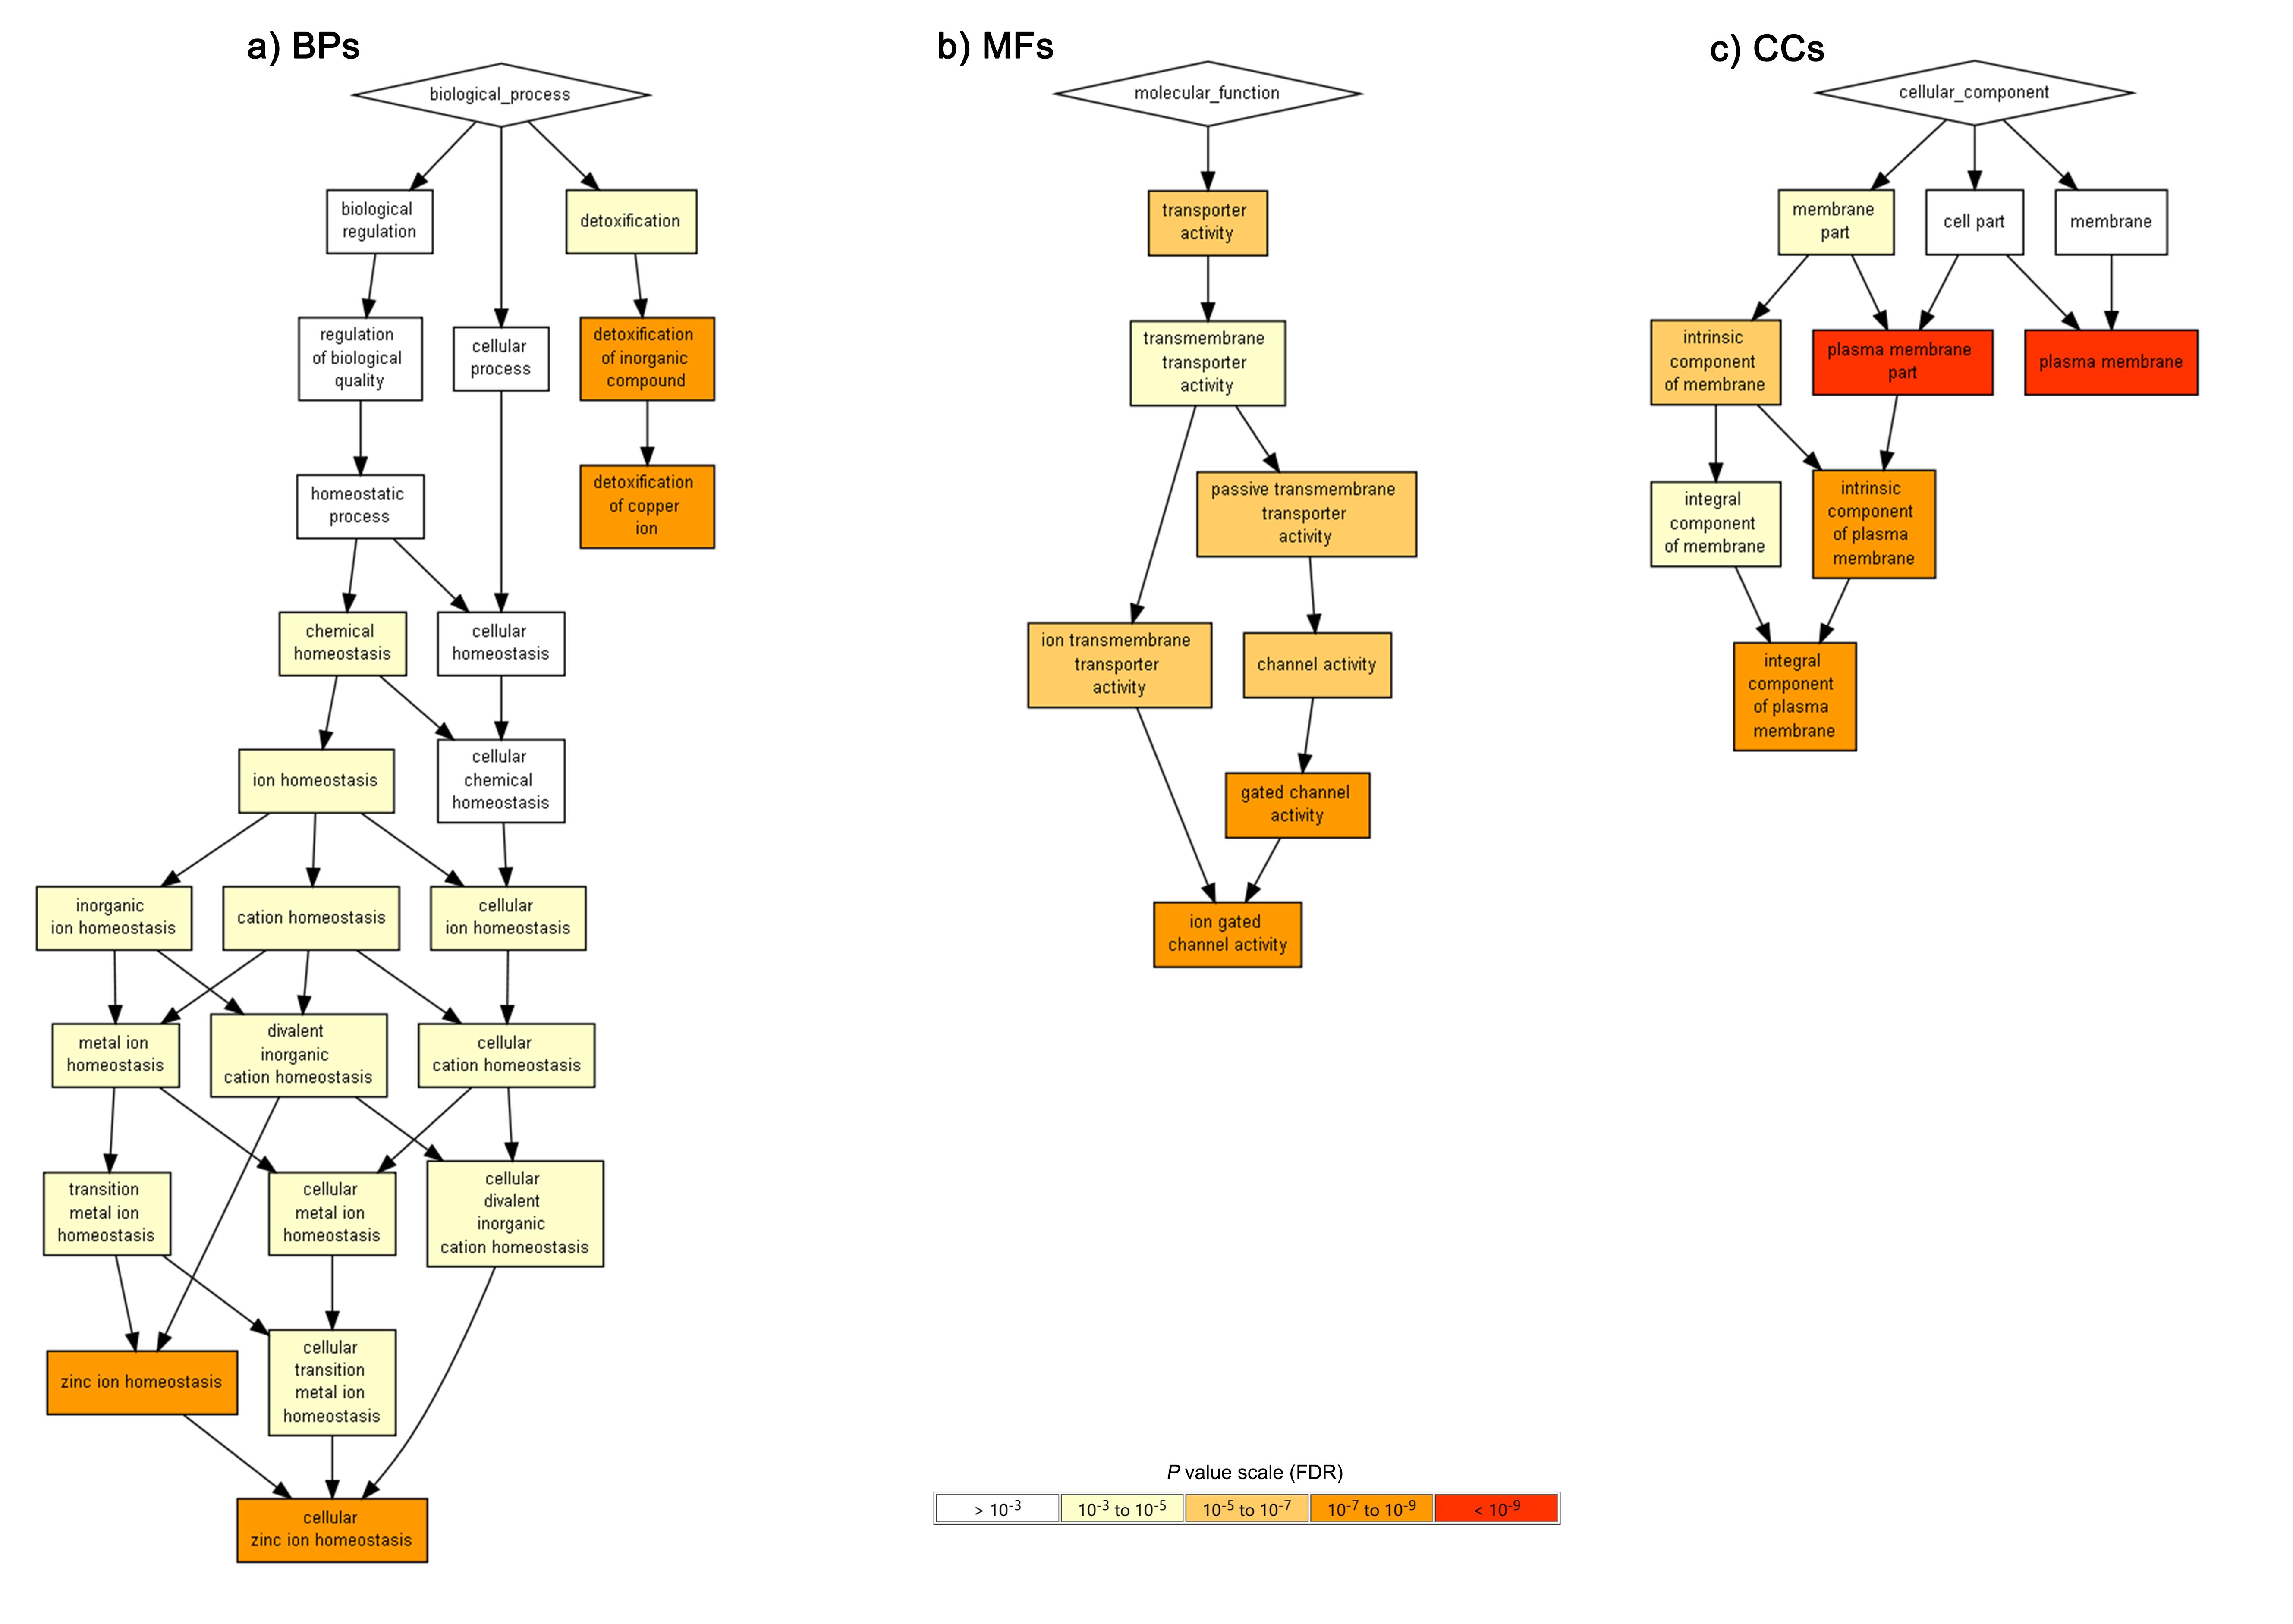
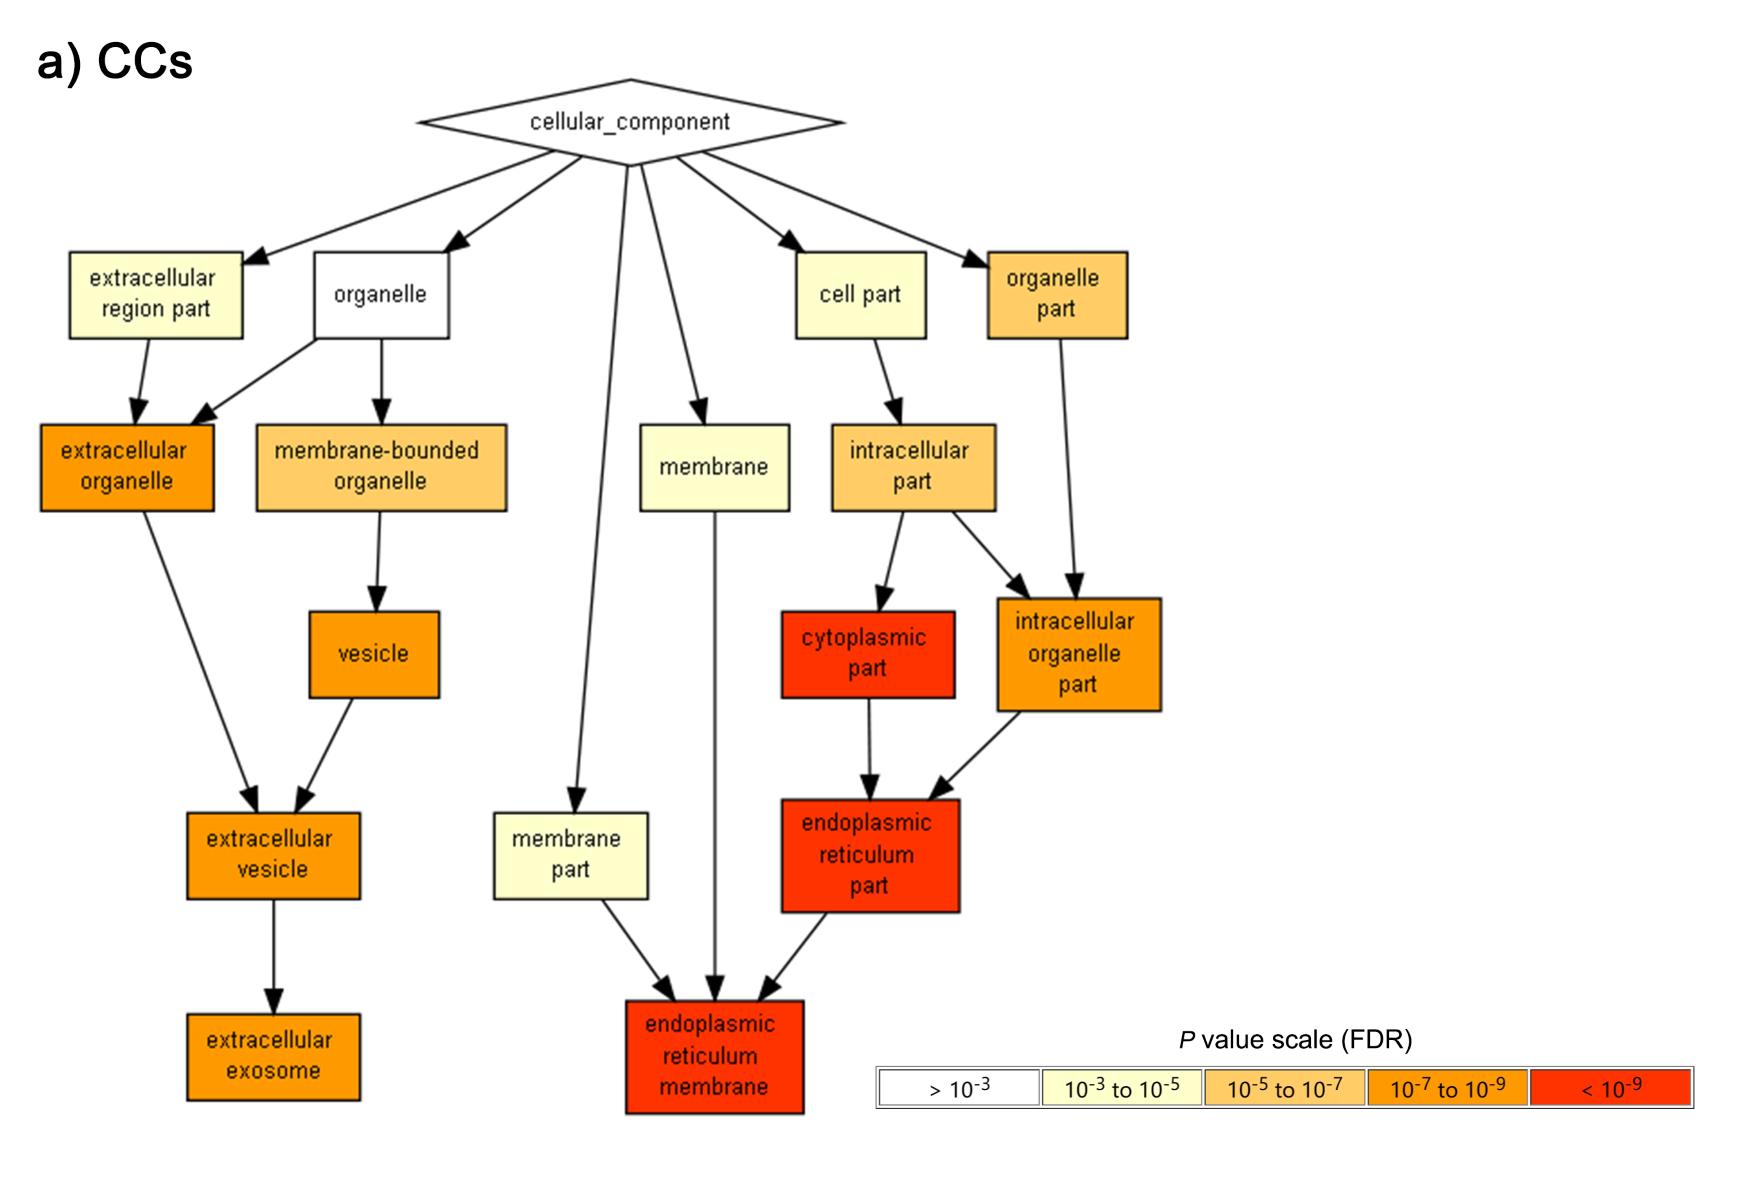
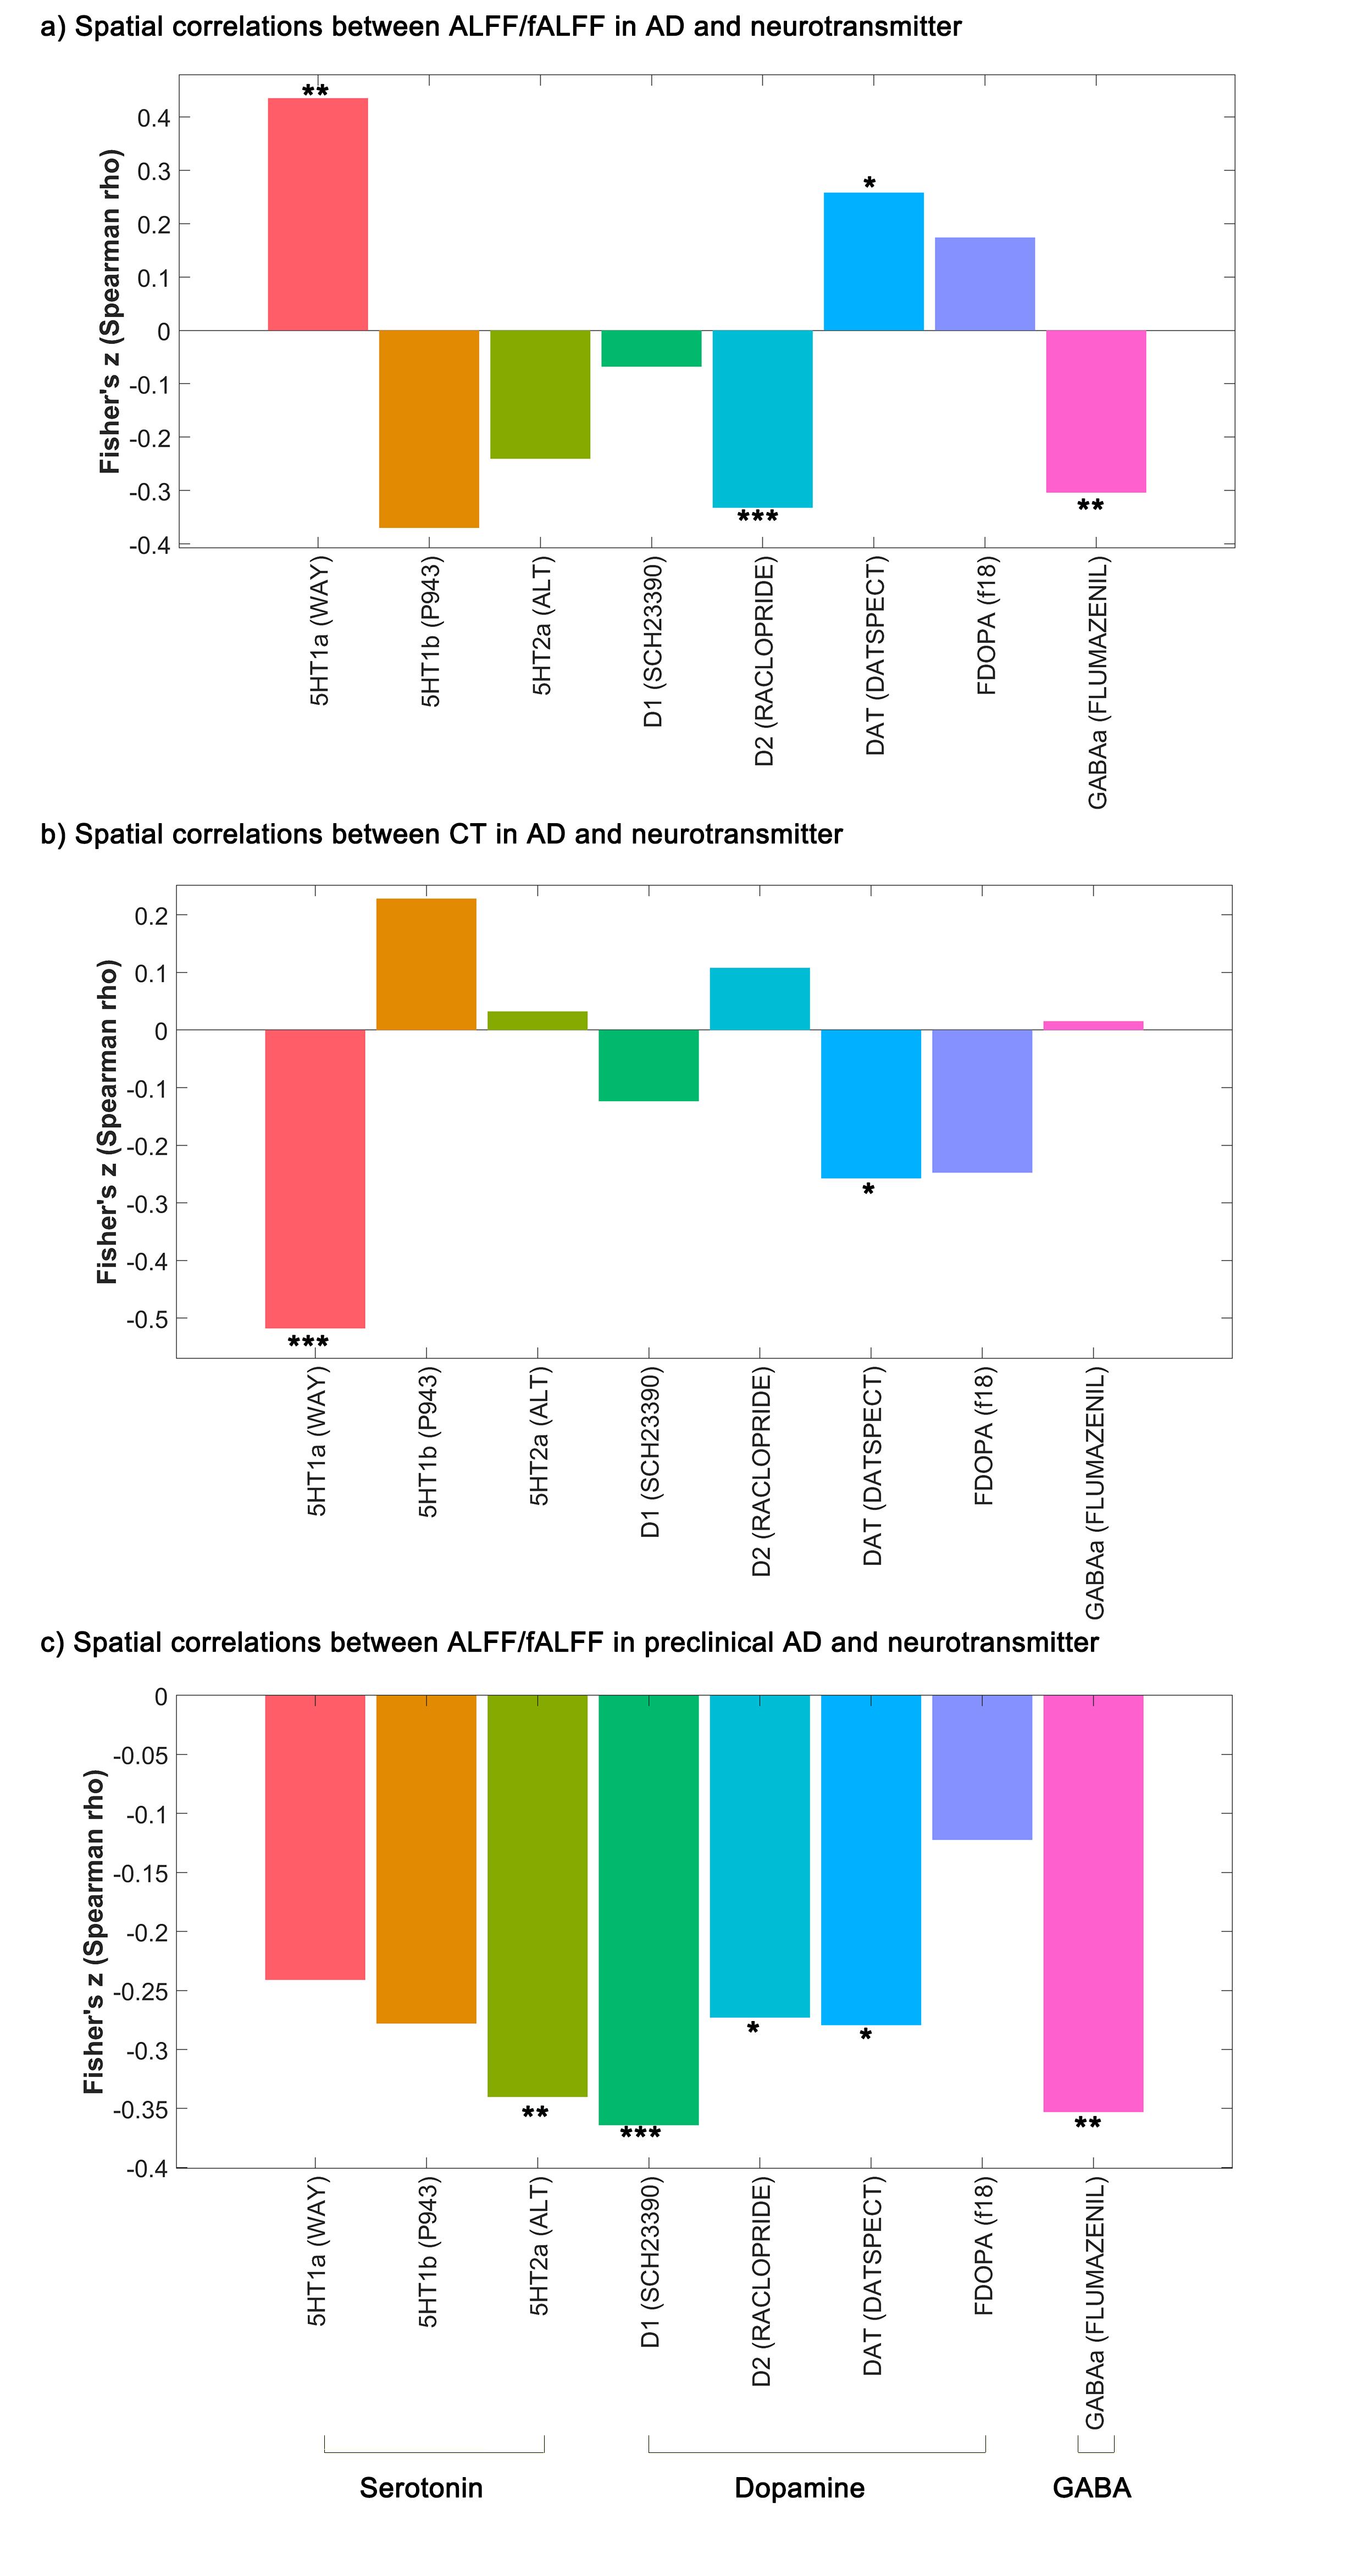
Background: Numerous neuroimaging studies have reported that Alzheimer's disease (AD) and preclinical AD have been linked to alterations in the amplitude of low-frequency fluctuation (ALFF)/fractional ALFF (fALFF) and cortical thickness (CT) of some brain areas. However, the findings have been inconsistent and the correlation with the transcriptional profile and neurotransmitter systems remain largely unknown.Methods: We conducted a meta-analysis to identify multimodal differences in ALFF/fALFF and CT in patients with AD and preclinical AD compared to healthy controls (HCs), using the Seed-based d Mapping with Permutation of Subject Images software. Transcriptional data were retrieved from the Allen Human Brain Atlas. The atlas-based nuclear imaging-derived neurotransmitter maps were investigated by JuSpace toolbox.Results: We included 26 ALFF/fALFF studies comprising 884 patients with AD and 1,020 controls, along with 52 studies comprising 2,049 patients with preclinical AD and 2,331 controls. For CT, we included 10 studies comprising 338 patients with AD and 315 controls. Overall, compared to HCs, patients with AD showed decreased ALFF/fALFF in the bilateral posterior cingulate gyrus (PCC)/precuneus (extending to the bilateral median cingulate gyrus [MCC]) and right angular gyrus, as well as increased ALFF/fALFF in the bilateral parahippocampal gyrus (extending to the bilateral hippocampus and amygdala gyrus). Patients with peclinical AD showed decreased ALFF/fALFF in the left precuneus. Additionally, patients with AD displayed decreased CT in the bilateral parahippocampal gyrus, left PCC (extending to the bilateral MCC) and sensorimotor area. Overlapping analysis showed that patients with AD displayed decreased ALFF/fALFF and CT in the left PCC (extending to the bilateral MCC), as well as increased ALFF/fALFF and decreased CT in the bilateral parahippocampal gyrus. Furthermore, gene sets related to brain structural and functional changes in AD and functional alterations in preclincal AD were enriched for G protein-coupled receptor signaling pathway, ion gated channel activity, and components of biological membrane. And functional and/or structural alterations in AD and preclinical AD were spatially associated with serotonergic, dopaminergic, and GABAergic neurotransmitter systems.Conclusions: The study findings demonstrated that AD and preclinical AD both exhibited functional alterations in the PCC/precuneus. Furthermore, patients with AD also exhibited convergent functional and structural alterations in the PCC/precuneus and parahippocampal gyrus, as well as aberrant function or structure in the sensorimotor area, orbitofrontal cortex and temporal lobe. In addition, AD and preclinical AD showed common and distinct genetic modulations/neurotransmitter deficits of brain structural and functional impairments. These findings may provide different insights into the pathophysiology of AD spectrum.Acknowledgements
The study was supported by grants from the National Natural Science Foundation of China (81671670, 81971597, and 82172530); National Key Research and Development Project (2020YFC2005700); Key-Area Research and Development Program of Guangdong Province (2020B1111100001). The funding organizations play no further role in study design, data collection, analysis and interpretation and paper writing.References
1. 2022 Alzheimer's disease facts and figures. Alzheimers Dement, 2022. 18(4): p. 700-789.
2. Albajes-Eizagirre, A., et al., Meta-analysis of Voxel-Based Neuroimaging Studies using Seed-based d Mapping with Permutation of Subject Images (SDM-PSI). J Vis Exp, 2019(153).
3. Hawrylycz, M.J., et al., An anatomically comprehensive atlas of the adult human brain transcriptome. Nature, 2012. 489(7416): p. 391-399.
4. Hawrylycz, M., et al., Canonical genetic signatures of the adult human brain. Nat Neurosci, 2015. 18(12): p. 1832-44.
5. Dukart, J., et al., JuSpace: A tool for spatial correlation analyses of magnetic resonance imaging data with nuclear imaging derived neurotransmitter maps. Hum Brain Mapp, 2021. 42(3): p. 555-566.
Figures