3908
A Longitudinal Study of Functional Brain Complexity in Progressive Alzheimer's Diseases1Mark and Mary Stevens Neuroimaging and Informatics Institute, Keck School of Medicine, University of Southern California, Los Angeles, CA, United States, 2Memory and Aging Center, Keck School of Medicine, University of Southern California, Los Angeles, CA, United States
Synopsis
Keywords: Alzheimer's Disease, Alzheimer's Disease, Complexity analysis, longitudinal study, mild cognitive impairment
Motivation: Complexity is generally reduced in mild cognitive impairment (MCI) and Alzheimer's disease (AD) than cognitive normal (CN) in cross-sectional cohorts. However, the trajectory of complexity in AD progression remains unknown.
Goal(s): To investigate longitudinal changes in resting-state fMRI (rsfMRI)-complexity in AD progression.
Approach: A linear mixed-effects model was implemented to investigate the main effects of Group and Group-by-time interactions.
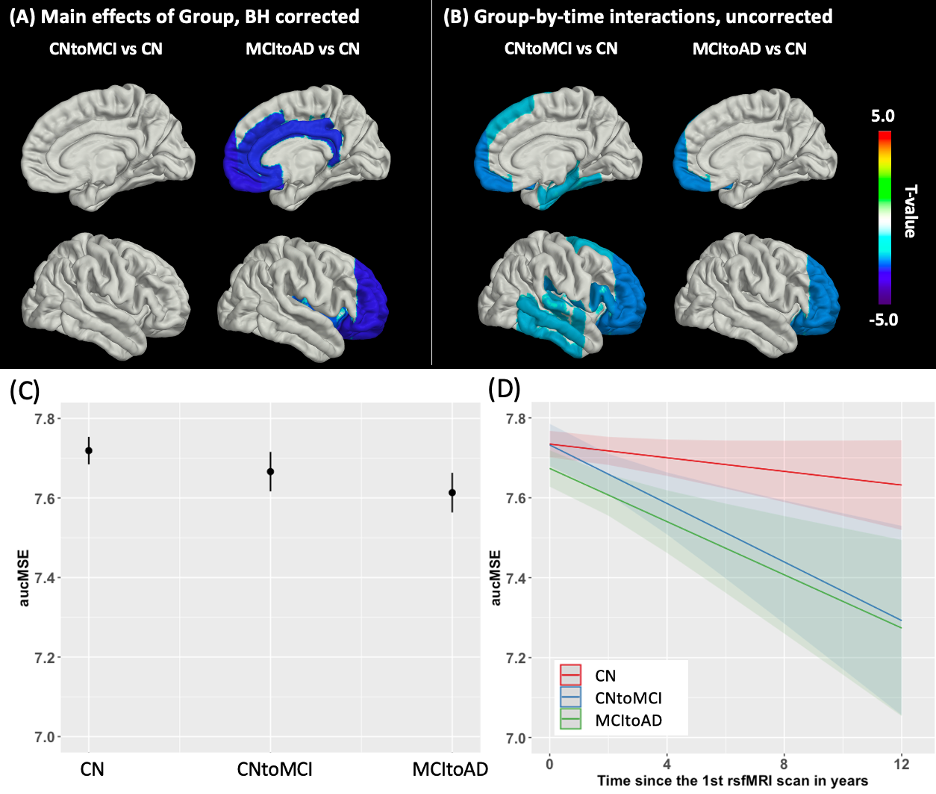
Results: rsfMRI-complexity was reduced in the MCItoAD group (those converted from MCI to AD) relative to the CN group. The CNtoMCI group (those converted from CN to MCI) showed the most pronounced rsfMRI-complexity decline over time.
Impact: fMRI-complexity as a novel marker for Alzheimer's disease (AD) progression remains poorly understood although cross-sectional studies indicated reduced complexity relative to healthy aging. Our study demonstrates longitudinal changes in AD-related fMRI-complexity, indicating its potential as an early AD biomarker.
Introduction
Alzheimer's disease (AD) is a progressive, irreversible neurological disorder. Resting-state functional magnetic resonance imaging (rsfMRI) measuring blood oxygenation level-dependent (BOLD) signals provides information on altered brain networks and function in AD1,2. In the past decade, complexity analysis of rsfMRI data has been implemented to assess functional brain abnormalities in AD and mild cognitive impairment (MCI)3-13. The results from rsfMRI-complexity studies predominantly revealed reduced complexity in MCI and AD as compared to cognitive normal subjects (CN) in cross-sectional cohorts4-8,11,13,14, with few exceptions3,9,14. However, the trajectory of rsfMRI-complexity in AD progression, specifically the transition from CN to MCI, and from MCI to AD, remains unknown. In this present study, we conducted longitudinal rsfMRI-complexity analyses to investigate the evolution of AD-related functional brain changes.Method
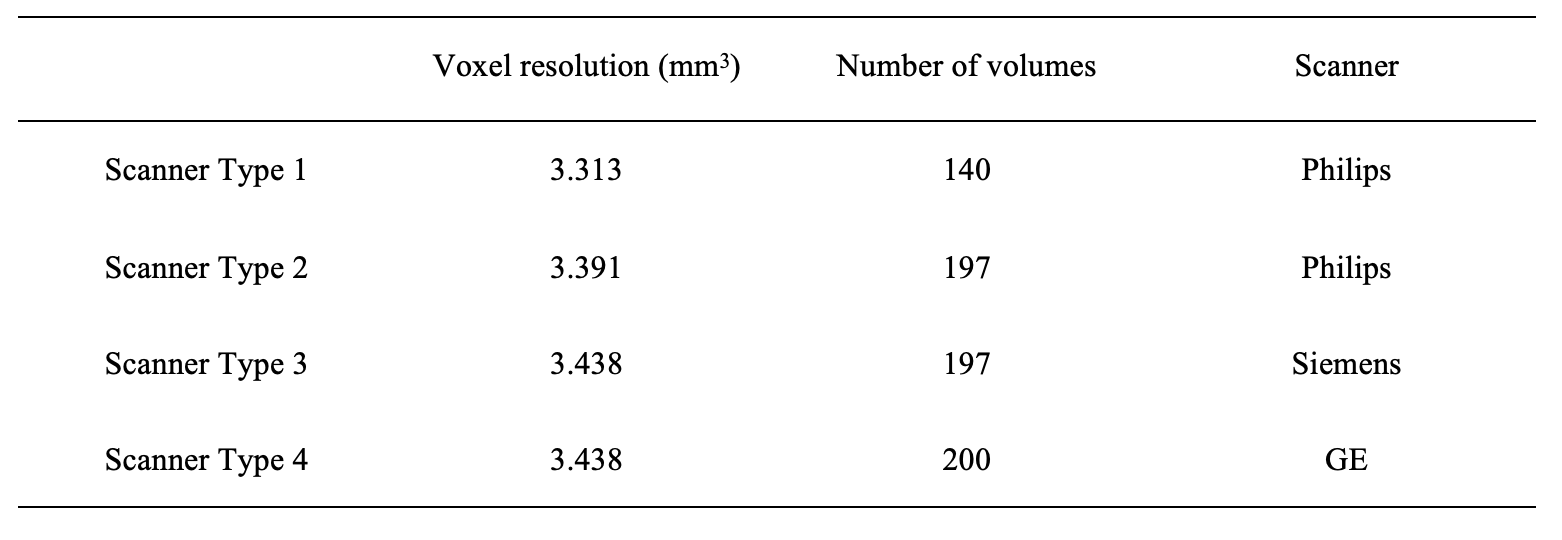
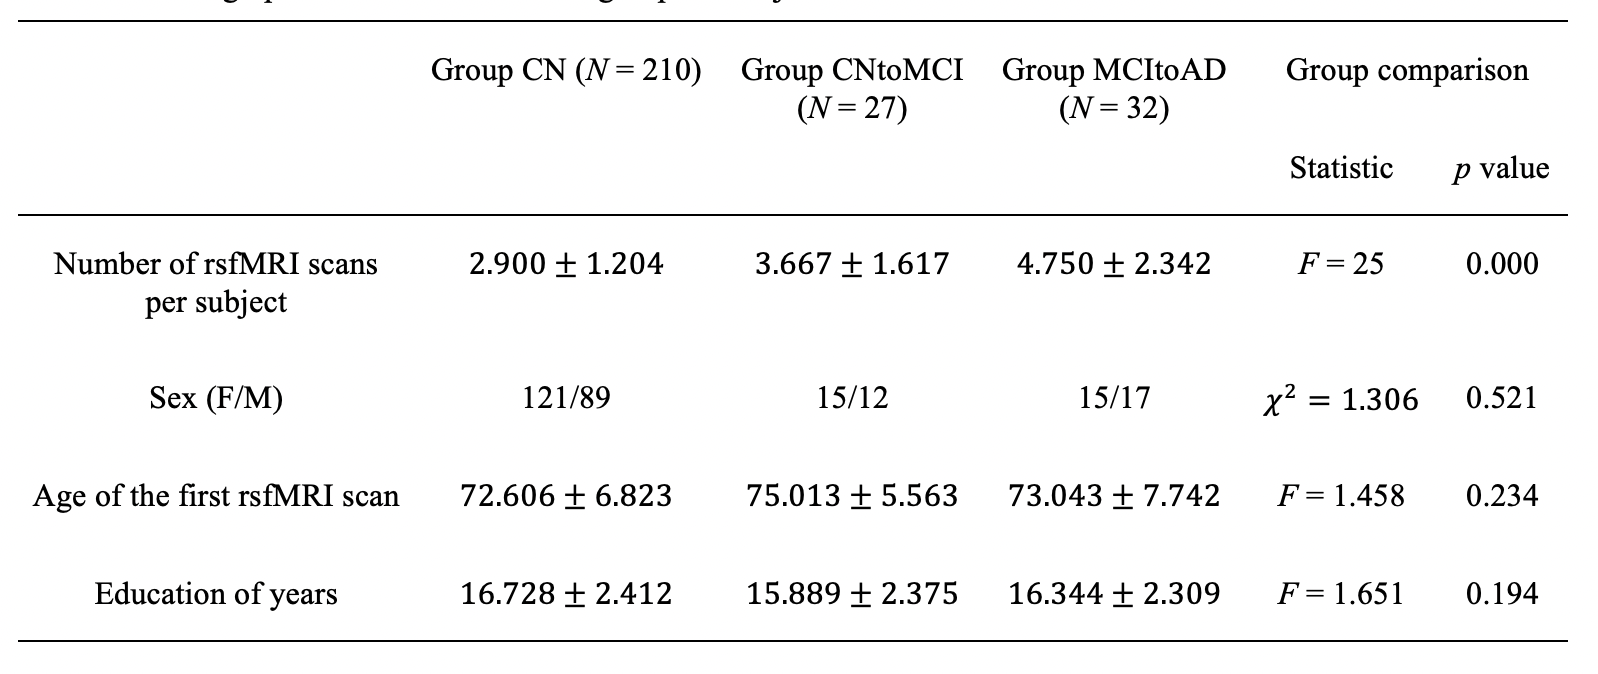
We used demographic, clinical, T1 structural, and rsfMRI data from the Alzheimer’s Disease Neuroimaging Initiative (ADNI) database. The rsfMRI data was acquired with repetition time = 3000 ms and echo time = 30 ms. Other parameters varied by scanner platform (Table 1).Three groups of subjects were identified from the ADNI database: Group CNtoMCI required each subject to have at least one rsfMRI scan while they were healthy and at least one rsfMRI scan while they were diagnosed as MCI; Group MCItoAD required each subject to have at least one rsfMRI scan while they were diagnosed as MCI and at least one rsfMRI scan while they were diagnosed as AD; Group CN required each subject maintained healthy across all ADNI study visits and had at least two rsfMRI scans. The final study sample included 210 subjects in Group CN, 27 subjects in Group CNtoMCI, and 32 subjects in Group MCItoAD. The three groups matched in terms of sex (p = 0.521), education (p = 0.194), and age of their first rsfMRI scan (p = 0.234, Table 2).
Image preprocessing was performed in the CONN toolbox15 including denoising for motion and physiological signal variations. Voxel-wise multiscale entropy (MSE) for pattern length m = 2, sensitivity threshold r = 0.3, and number of temporal scales a = 6 (0.33-0.05Hz) was computed using the LOFT Complexity Toolbox (github.com/kayjann/complexity). Fourteen meta regions of interest (meta-ROIs) were formed from Harvard-Oxford atlas ROIs. Finally, the area under a curve across all scales was calculated (aucMSE) for each meta-ROI.
A linear mixed effects (LME) model (Equation 1) evaluated group differences in complexity (main effect) and altered rates of progression of complexity across groups (interaction effect): $$\text{Mean aucMSE for each meta-ROI}=β_0+β_1\text{Group}+β_2\text{Time since the 1st rsfMRI scan}\\+β_3\text{Group×Time since the 1st rsfMRI scan}+β_4\text{Sex}+β_5\text{Education}+β_6\text{Number of volumes per rsfMRI scan}\\+β_7\text{Scanner}+β_8\text{Mean aucMSE of the whole brain of the 1st rsfMRI scan}+β_9\text{Age of the 1st rsfMRI scan}\\+(1+\text{Time since the 1st rsfMRI scan|subject}).(1)$$
Results
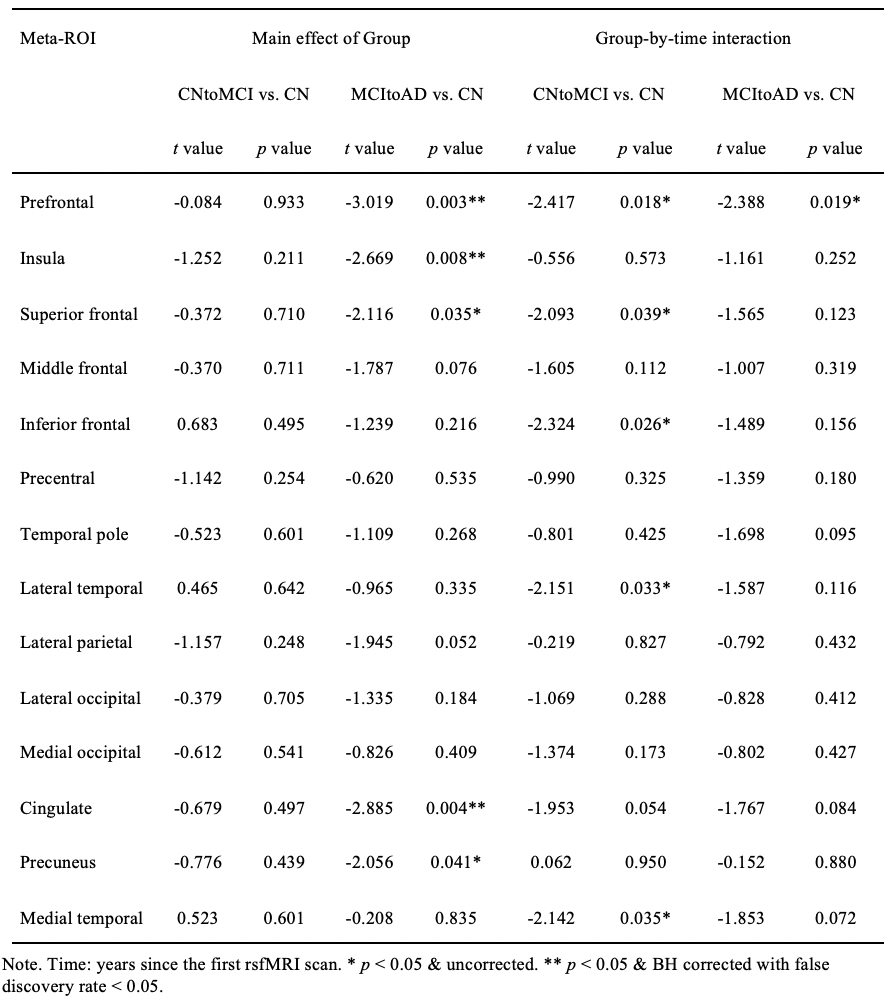
The LME model revealed significantly lower rsfMRI-complexity in Group MCItoAD as compared to Group CN in the prefrontal, cingulate, and insula (t = -3.019 to -2.669, p = 0.003 to 0.008, Benjamini-Hochberg (BH) corrected with false discovery rate < 0.05, Figure 1(A), 1(C), & Table 3). Additionally, rsfMRI-complexity decayed significantly faster in Group CNtoMCI than in Group CN in the prefrontal, superior frontal, inferior frontal, lateral temporal, and medial temporal lobe (t = -2.417 to -2.093, p < 0.05, uncorrected, Figure 1(B), 1(D), & Table 3). Complexity decayed significantly faster in Group MCItoAD relative to Group CN only in the prefrontal (t = -2.338, p < 0.05, uncorrected, Figure 1(B), 1(D), & Table 3).Discussion and Conclusion
The current study showed reduced rsfMRI-complexity in the subjects who converted from MCI to AD relative to the CN. The decay in rsfMRI-complexity over time was most prominent (although only at the uncorrected statistical level) in the elderly who converted from healthy to MCI. The affected regions were mainly the frontal and temporal cortices which was consistent with the hypothesis of decline in executive functions and memory in AD. The present study identified aucMSE as a potential imaging biomarker of AD.Acknowledgements
This study was supported by NIH grant R01-AG066711.References
1. Ibrahim B, Suppiah S, Ibrahim N, et al. Diagnostic power of resting-state fMRI for detection of network connectivity in Alzheimer's disease and mild cognitive impairment: A systematic review. Hum Brain Mapp. Jun 15 2021;42(9):2941-2968. doi:10.1002/hbm.25369
2. Sheline YI, Raichle ME. Resting state functional connectivity in preclinical Alzheimer's disease. Biol Psychiatry. Sep 01 2013;74(5):340-7. doi:10.1016/j.biopsych.2012.11.028
3. Xue SW, Guo Y, Initiative AsDN. Increased resting-state brain entropy in Alzheimer's disease. Neuroreport. Mar 07 2018;29(4):286-290. doi:10.1097/WNR.0000000000000942
4. Wang B, Niu Y, Miao L, et al. Decreased Complexity in Alzheimer's Disease: Resting-State fMRI Evidence of Brain Entropy Mapping. Front Aging Neurosci. 2017;9:378. doi:10.3389/fnagi.2017.00378
5. Niu Y, Wang B, Zhou M, et al. Dynamic Complexity of Spontaneous BOLD Activity in Alzheimer's Disease and Mild Cognitive Impairment Using Multiscale Entropy Analysis. Front Neurosci. 2018;12:677. doi:10.3389/fnins.2018.00677
6. Wang Z, Initiative AsDN. Brain Entropy Mapping in Healthy Aging and Alzheimer's Disease. Front Aging Neurosci. 2020;12:596122. doi:10.3389/fnagi.2020.596122
7. Jann K, Boudreau J, Albrecht D, et al. FMRI Complexity Correlates with Tau-PET and Cognitive Decline in Late-Onset and Autosomal Dominant Alzheimer's Disease. J Alzheimers Dis. 2023;95(2):437-451. doi:10.3233/JAD-220851
8. Zheng H, Onoda K, Nagai A, Yamaguchi S. Reduced Dynamic Complexity of BOLD Signals Differentiates Mild Cognitive Impairment From Normal Aging. Front Aging Neurosci. 2020;12:90. doi:10.3389/fnagi.2020.00090
9. Maxim V, Sendur L, Fadili J, et al. Fractional Gaussian noise, functional MRI and Alzheimer's disease. Neuroimage. Mar 2005;25(1):141-58. doi:10.1016/j.neuroimage.2004.10.044
10. Liu CY, Krishnan AP, Yan L, et al. Complexity and synchronicity of resting state blood oxygenation level-dependent (BOLD) functional MRI in normal aging and cognitive decline. J Magn Reson Imaging. Jul 2013;38(1):36-45. doi:10.1002/jmri.23961
11. Grieder M, Wang DJJ, Dierks T, Wahlund LO, Jann K. Default Mode Network Complexity and Cognitive Decline in Mild Alzheimer's Disease. Front Neurosci. 2018;12:770. doi:10.3389/fnins.2018.00770
12. Long Z, Jing B, Guo R, et al. A Brainnetome Atlas Based Mild Cognitive Impairment Identification Using Hurst Exponent. Front Aging Neurosci. 2018;10:103. doi:10.3389/fnagi.2018.00103
13. Ma X, Zhuo Z, Wei L, et al. Altered Temporal Organization of Brief Spontaneous Brain Activities in Patients with Alzheimer's Disease. Neuroscience. Jan 15 2020;425:1-11. doi:10.1016/j.neuroscience.2019.11.025
14. Ren P, Ma M, Xie G, Wu Z, Wu D, Initiative AsDN. Altered complexity of resting-state BOLD activity in Alzheimer's disease-related neurodegeneration: a multiscale entropy analysis. Aging (Albany NY). Jul 10 2020;12(13):13571-13582. doi:10.18632/aging.103463
15. Whitfield-Gabrieli S, Nieto-Castanon A. Conn: a functional connectivity toolbox for correlated and anticorrelated brain networks. Brain Connect. 2012;2(3):125-41. doi:10.1089/brain.2012.0073
Figures