3907
In vivo microstructural mapping of the hippocampus in older adults with familial risk for Alzheimer’s disease1Montreal Neurological Institute, McGill University, Montreal, QC, Canada, 2Department of Physics, Concordia University, Montreal, QC, Canada, 3Montreal Heart Institute, Montreal, QC, Canada, 4McGill University, Montreal, QC, Canada, 5Department of Psychology, York University, Toronto, ON, Canada, 6McConnell Brain Imaging Centre, McGill University, Montreal, QC, Canada, 7Department of Biomedical Engineering, McGill University, Montreal, QC, Canada, 8Douglas Mental Health University Institute, Montreal, QC, Canada, 9Departments of Psychology and Psychiatry, McGill University, Montreal, QC, Canada
Synopsis
Keywords: Alzheimer's Disease, Quantitative Imaging, Hippocampus, Microstructure
Motivation: Understanding prodromal Alzheimer’s disease is essential for treatment development. Hippocampal volume loss indicates significant atrophy and may occur too late to slow disease progression.
Goal(s): We aimed to precisely map spatial variation in hippocampal microstructure in vivo using quantitative MRI in prodromal AD.
Approach: We use multiparametric quantitative MRI to comprehensively map hippocampal microstructure in healthy older adults with first-degree family history of Alzheimer’s disease and correlate maps with demographic risk factors for Alzheimer's disease.
Results: We identified two key contributors of microstructural variation (myelin content and free water). We revealed localized age-related demyelination and sex differences in hippocampal proton density.
Impact: This research provides crucial insights into age-related hippocampal microstructural changes and their implications for Alzheimer's disease. It has the potential to advance early detection and intervention strategies, ultimately improving patient outcomes in Alzheimer's disease management.
Introduction
Early detection of Alzheimer’s disease is essential for improving prognoses. The hippocampus, where early atrophy is localized 1, has a folded structure, with variation in microstructure and disease vulnerability between cytoarchitectonic subfields (CA1-4, subiculum, and dentate gyrus) and along the anterior-posterior axis (head, body and tail) 2,3.Detectible volume loss indicates a significant loss of neuronal tissue 4. Alternative techniques are required to detect extant tissue that where pathology is accumulating but has potential for therapeutic rescue. Quantitative MRI (qMRI) can detect subtle changes in the physicochemical environment of biological tissue in vivo, providing greater sensitivity to early pathological changes than volumetry 5.
We used qMRI to map hippocampal microstructure across its cytoarchitectonic subfields and longitudinal gradients in a cohort of older adults at-risk for Alzheimer’s disease. We describe common axes of microstructural variation and relate measures of microstructure to age and sex, demographic risk factors for Alzheimer’s disease.
Methods
123 cognitively healthy older adults with a first-degree family history of Alzheimer’s disease were included from the PREVENT-AD (PResymptomatic EValuation of Experimental or Novel Treatments for AD) cohort (mean age 67.9y, 72% female).3T MRI acquisition:T1w MPRAGE (1mm isotropic, TR/TE/TI=2300/2.96/900ms, FA=9°).
Multiparametric Mapping (MPM): Three multi-echo gradient-echo sequences (1mm isotropic, TA=17:30) with predominant weighting for: T1 (TR=18ms, 6 echoes, TE=2.16-14.81ms, FA 20°), magnetization transfer (MT) (TR=27ms, 6 echoes, TE=2.04-14.89ms, FA 6°) or proton density (PD) (TR=27ms, 8 echoes, TE=2.04-22.20ms, FA 6°).
Diffusion-weighted imaging (2mm isotropic, b=[300,1000,2000]s/mm2, 109 directions, TR/TE=3000/66ms, posterior-anterior phase encoding).
Image processing
Maps of R1, MT saturation (MTsat), R2* and proton density (PD) were created using the hMRI toolbox (v0.5.0) 6. Diffusion images were assessed using Neurite Orientation Dispersion and Density Imaging (NODDI) 7, enabling estimation of neurite density (intracellular volume fraction: ICVF), orientation dispersion (OD) and free water (isotropic volume fraction: ISOVF).
Unfolded hippocampal surfaces were created from each subject’s MPRAGE using HippUnfold 8. MPM and NODDI maps were aligned to the MPRAGE and mapped onto the unfolded hippocampal surfaces.
Statistical Analysis
We describe common patterns of microstructural variation across the allocortical surface of the hippocampus using principal component analysis (PCA) of the subject-averaged microstructure maps (bootstrapped: 500 iterations).
We tested associations between hippocampal microstructure and age and sex using Kendall Rank Correlation on each vertex of the hippocampal surface. P-values across vertices for each parameter underwent two-stage false discovery rate correction (α=0.01).
Results
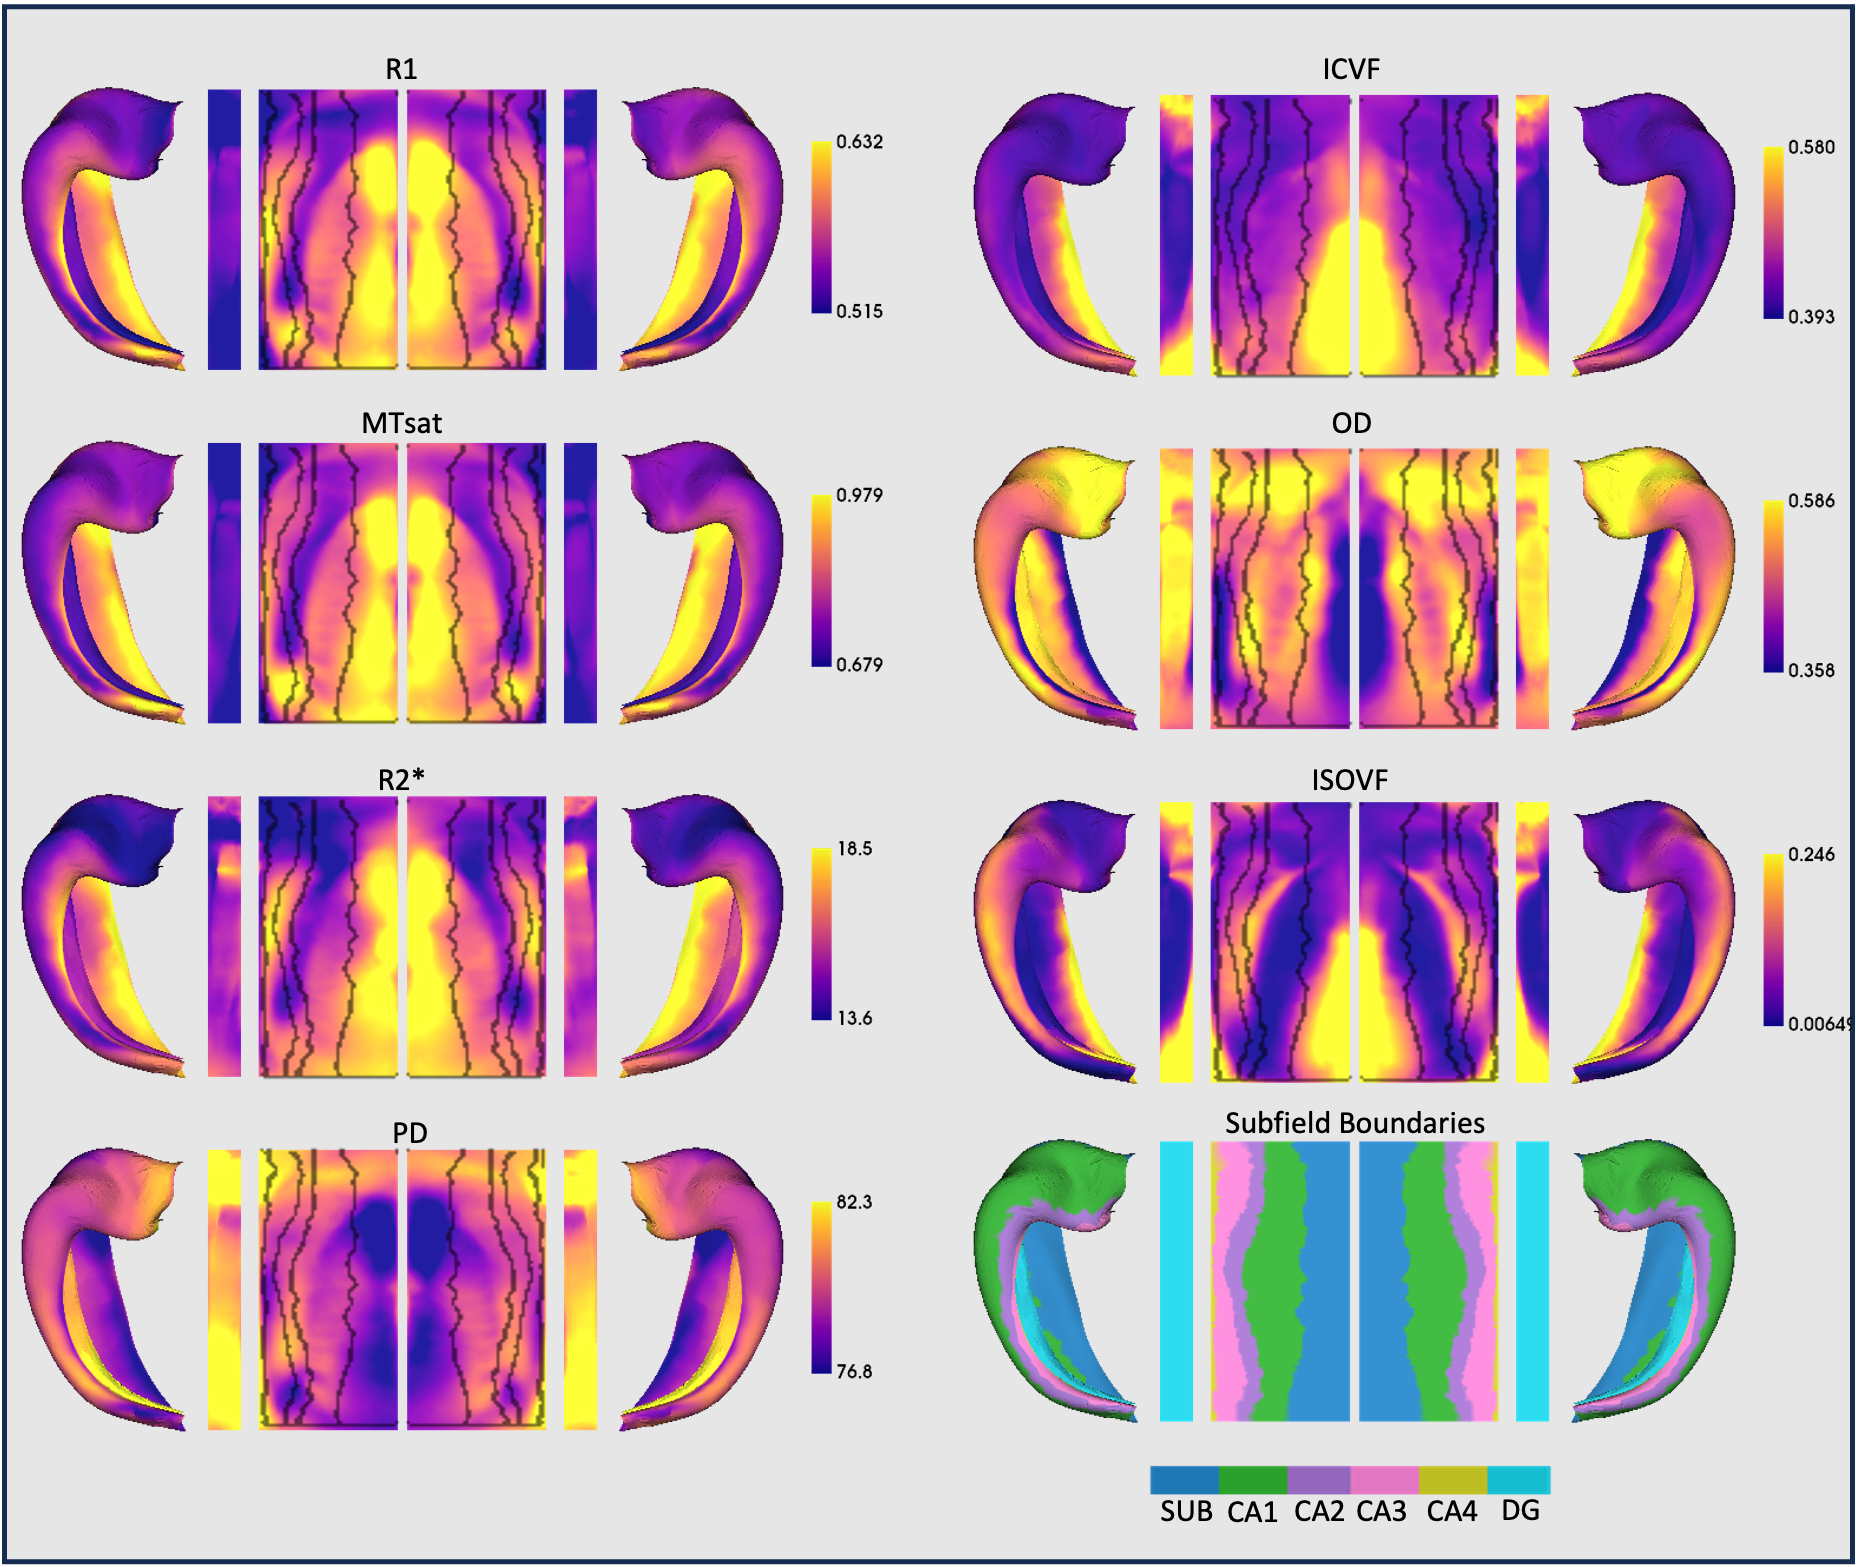
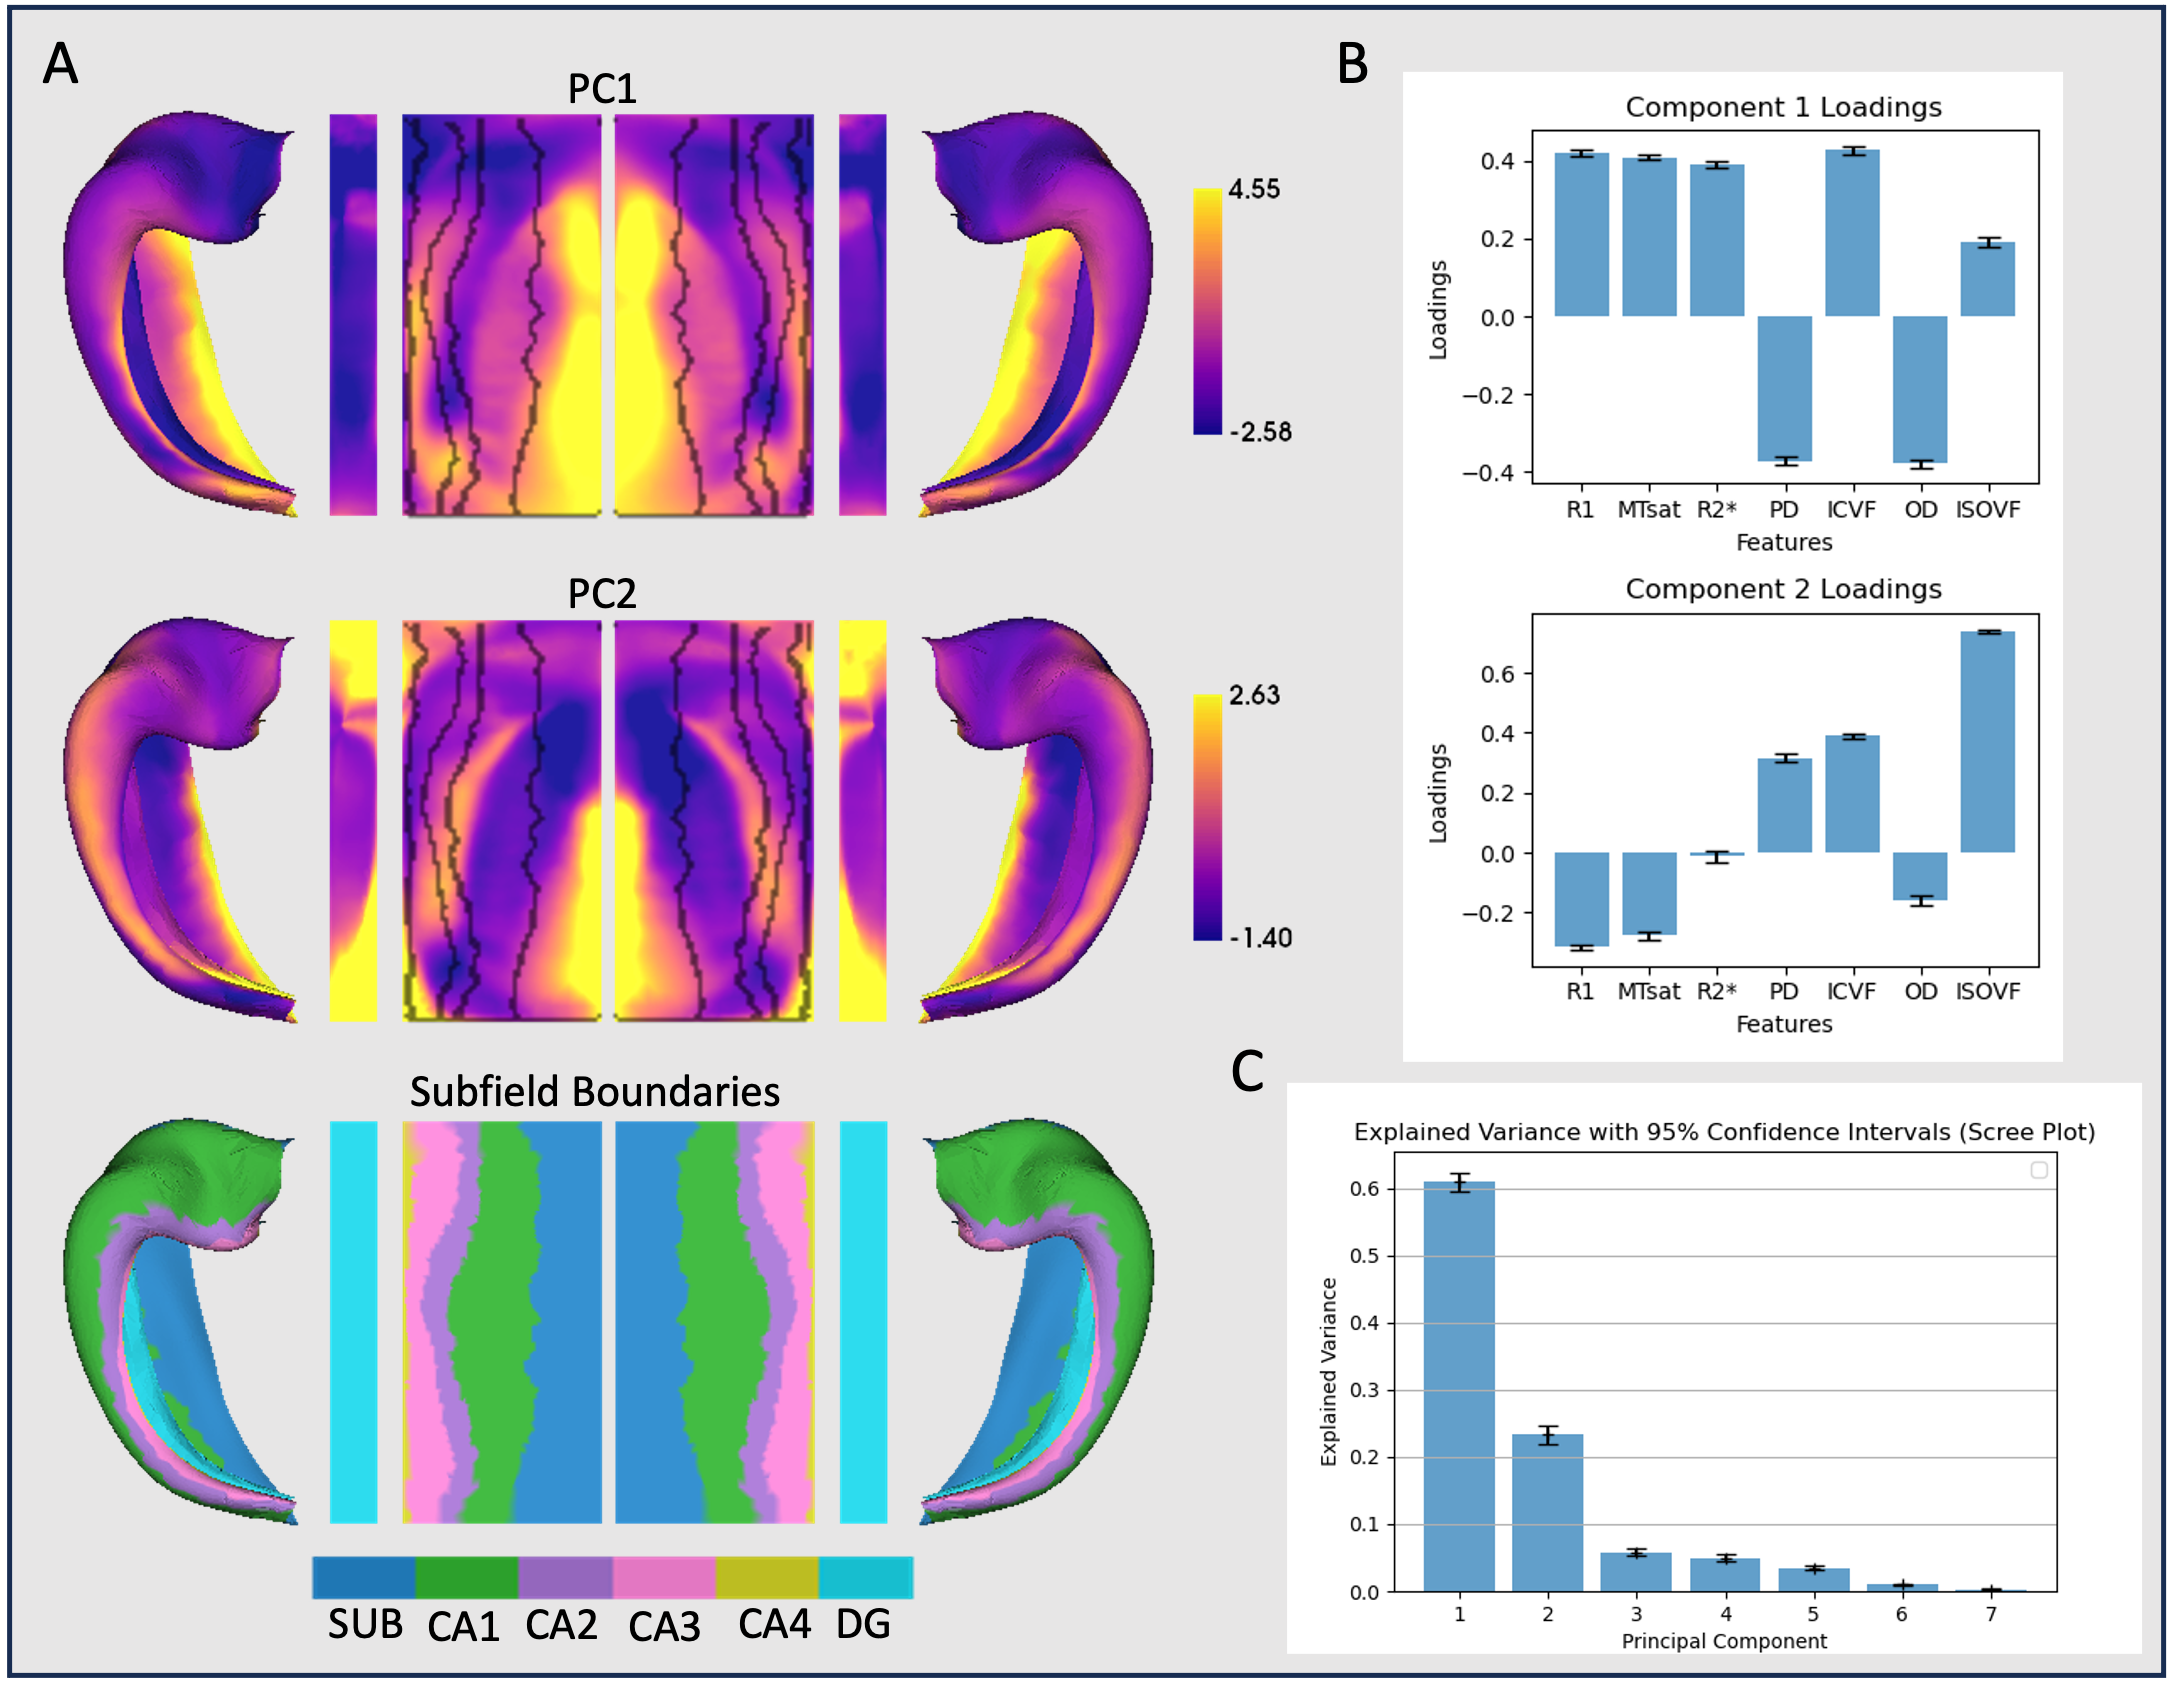
Figure 1 shows surface maps of microstructure measures, for which 84.2% of the variance was described by two principal components (Figure 2).PC1 closely tracked the boundaries of the cytoarchitectonic subfields and reflected a positive covariance of R1, MTsat, R2*, ICVF and, to a lesser extent, ISOVF, which were inversely related to PD and OD.
PC2 was primarily driven by ISOVF which positively covaried with ICVF and OD, and negatively covaried with R1, MTsat and OD and appears to track the pattern of curvature across the hippocampus.
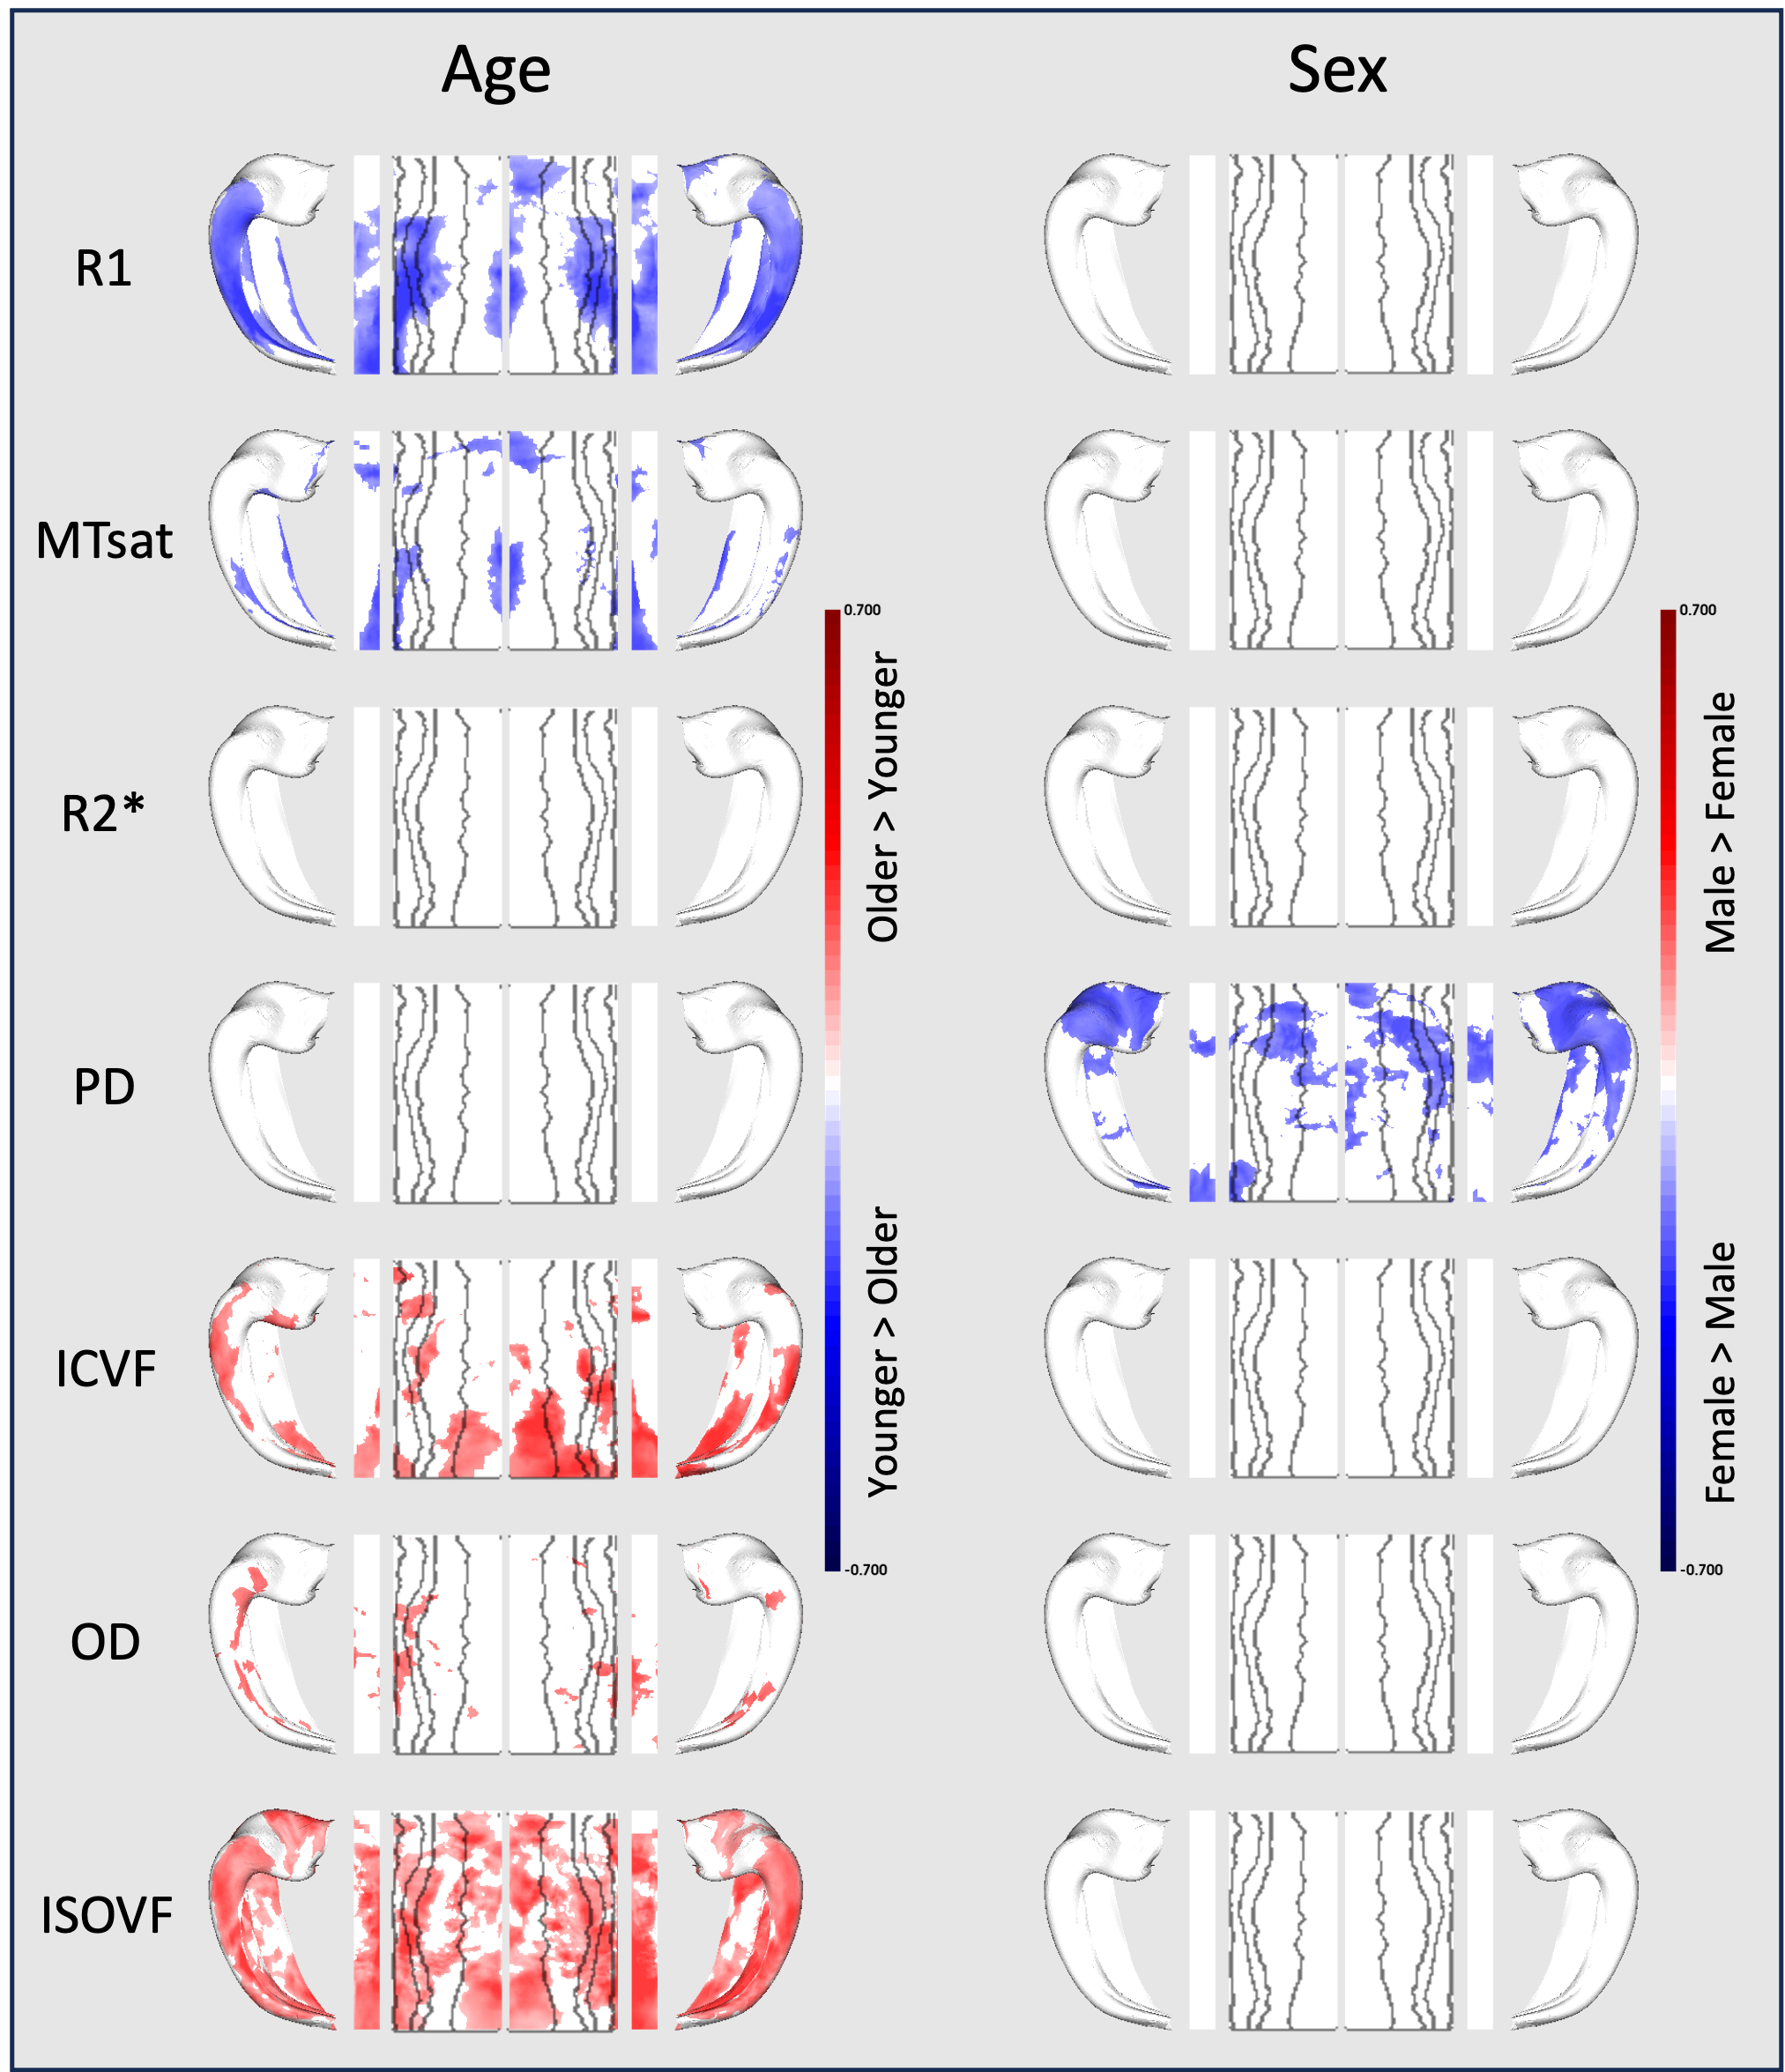
Microstructural variation with age and sex (Figure 3):
Greater age was associated with lower R1 and MTsat and greater ISOVF and ICVF, localized to specific areas of hippocampus within each parameter.
We observed significantly lower hippocampal PD in male participants, which is most pronounced in the head of the hippocampus across all subfields and in both hemispheres.
Discussion
A primary finding of the present study is that across seven microstructural parameters, two factors described most of the variance. PC1 demonstrates a covariance between measures sensitive to the macromolecular and diamagnetic properties of myelinated tissue. PC2 reveals a unique relationship between MPM parameters and NODDI parameters. It suggests that areas with high values in this component exhibit greater free water content within the tissue.Greater age was associated with reduced macromolecular content (R1, MTsat) and greater free water (ISOVF), reflecting age-related demyelination 9. In localized areas of the hippocampal tail, greater age was also associated with greater neurite density (ICVF), which may reflect the greater packing density of axons given reduced separation by myelin sheaths.
We note a specific difference between male and female subjects in hippocampal head PD. Further research is required to identify whether this difference relates to any cognitive differences or disease risk.
Conclusion
Here we present the most comprehensive in vivo mapping of hippocampal microstructure in older adults to date. Precision mapping of the hippocampus and its microstructure is essential for understanding the pathological progression of Alzheimer's disease and ultimately enabling early detection and intervention to improve patient outcomes. Future work will compare measures of hippocampal microstructure to molecular biomarkers of Alzheimer’s disease as well as assessing change in microstructure over time.Acknowledgements
We would like to thank the PREVENT-AD research team and study participants for their time and dedication in collecting the data used in this study. This project was made possible by financial support from the Alzheimer’s Association (AARG-22-927100) and National Institutes of Health (NIA R01 AG068563). R.N.S. is a Research Scholar supported by the Fonds de la Recherche du Quebec – Santé (FRQS). A.W. is a postdoctoral fellow also supported by FRQS.
We would also like to thank Jordan DeKraker for advice and support on using HippUnfold.
References
1. Shi F, Liu B, Zhou Y, Yu C, Jiang T. Hippocampal volume and asymmetry in mild cognitive impairment and Alzheimer’s disease: Meta analyses of MRI studies. Hippocampus. 2009;19(11):1055-1064. doi:10.1002/hipo.20573
2. de Flores R, La Joie R, Chételat G. Structural imaging of hippocampal subfields in healthy aging and Alzheimer’s disease. Neuroscience. 2015;309:29-50. doi:10.1016/j.neuroscience.2015.08.033
3. Braak H, Alafuzoff I, Arzberger T, Kretzschmar H, Tredici K. Staging of Alzheimer disease-associated neurofibrillary pathology using paraffin sections and immunocytochemistry. Acta Neuropathologica. 2006;112(4):389-404. doi:10.1007/s00401-006-0127-z
4. Jack CR, Knopman DS, Jagust WJ, et al. Tracking pathophysiological processes in Alzheimer’s disease: an updated hypothetical model of dynamic biomarkers. Lancet Neurol. 2013;12(2):207-216. doi:10.1016/S1474-4422(12)70291-0
5. Weiskopf N, Mohammadi S, Lutti A, Callaghan MF. Advances in MRI-based computational neuroanatomy: from morphometry to in-vivo histology. Curr Opin Neurol. 2015;28(4):313-322. doi:10.1097/WCO.0000000000000222
6. Tabelow K, Balteau E, Ashburner J, et al. hMRI - A toolbox for quantitative MRI in neuroscience and clinical research. Neuroimage. 2019;194:191-210. doi:10.1016/j.neuroimage.2019.01.029
7. Zhang H, Schneider T, Wheeler-Kingshott CA, Alexander DC. NODDI: Practical in vivo neurite orientation dispersion and density imaging of the human brain. NeuroImage. 2012;61(4):1000-1016. doi:10.1016/j.neuroimage.2012.03.072
8. DeKraker J, Haast RA, Yousif MD, et al. Automated hippocampal unfolding for morphometry and subfield segmentation with HippUnfold. Forstmann BU, de Lange FP, Bazin PL, eds. eLife. 2022;11:e77945. doi:10.7554/eLife.77945
9. Bartzokis G. Alzheimer’s disease as homeostatic responses to age-related myelin breakdown. Neurobiology of Aging. 2011;32(8):1341-1371. doi:10.1016/j.neurobiolaging.2009.08.007
Figures