3903
Cerebral blood and CSF flow dynamics in preclinical Alzheimer’s1University of Wisconsin-Madison, Madison, WI, United States, 2Umeå University, Umeå, Sweden
Synopsis
Keywords: Alzheimer's Disease, Alzheimer's Disease
Motivation: Cardiac driven CSF flow might play an important role in brain metabolite waste clearance. Comorbid cerebrovascular disease is common in Alzheimer’s disease and could lead to impaired CSF flow motion and waste clearance.
Goal(s): We aimed to characterize the associations between blood and CSF flow dynamics during preclinical AD.
Approach: Cognitively unimpaired participants underwent multi-delay (MD) ASL, and high- and low-velocity encoded 4D-Flow for the assessment of blood and CSF flow. AD pathology including amyloid and tau were determined from [11C]-PiB and [18F]-MK6240 PET.
Results: Blood flow pulsatility and CSF flow velocities were positively correlated and significantly higher in AD biomarker positive.
Impact: This work helps elucidate the coupling between blood and CSF flow during preclinical Alzheimer’s disease (AD), improving our understanding of neurofluids dynamics in AD. This information might help study brain clearance pathways which are hypothesized to be impaired in AD.
Introduction:
Animal studies indicate alterations in cerebrospinal fluid (CSF) flow may lead to impaired brain metabolite waste clearance.1 Brain clearance is hypothesized to be driven by CSF flow motion induced from arterial pulsations, respiration, and functional hyperemia. Failure in brain waste clearance has been implicated in Alzheimer’s disease (AD) the most common cause of dementia.2 AD is characterized by abnormal levels of amyloid and tau protein in the brain; however, comorbid cerebrovascular vascular disease (CVD) is frequent and might contribute to impaired brain clearance and CSF flow motion in AD.3 To study CVD and CSF, assessment of cerebral blood and CSF flow dynamics is feasible using arterial spin labeling (ASL) and phase contrast (PC) MRI. In this work, we examined the relationship between cerebral blood flow (CBF) (micro- and macro-vascular), and CSF flow using multi-delay (MD) ASL, and high- and low-velocity encoded 4D-flow MRI in a group of cognitively unimpaired participants with AD biomarkers including amyloid from [11C]-PiB and tau from [18F]-MK-6240 PET.Methods:
Data from 49 cognitively unimpaired participants (age=71±7y, 32F) from the Wisconsin Registry for Alzheimer’s Prevention4 were included. From these, 45 had AD biomarkers (n=27 amyloid and tau negative (A-T-), n=9 A+T- and n=9 A+T+). MRI: Three-dimensional PC MRI data with 3-directional velocity encoding were acquired on a 3.0T clinical MRI system (Signa Premier, GE Healthcare) using a 48-channel head coil (GE Healthcare). CSF flow scan parameters included: Venc=5cm/s, imaging volume =24x24x4cm3, isotropic resolution =1mm3, TR/TE=12.1/6.9ms and scan time ~8min. Blood flow scan parameters included: Venc=80cm/s, imaging volume =22x22x16cm3, isotropic resolution =0.7mm3, TR/TE=7.8/2.7ms and scan time ~5.6min. PC data were cardiac-gated using a photoplethysmogram and images reconstructed to 20 cardiac phases. MD-ASL data were collected with imaging volume = 24x24x16cm3, reconstructed 1.875x1.875mm2 in-plane resolution, 4mm slice thickness, TR/TE=6955/53ms, scan time =5min, and three post labeling delays (1.0, 1.8, 2.7s) to provide a measure of perfusion corrected for arrival time. CSF flow data were processed using GTFlow (GyroTools). Flow and velocity profiles were extracted at the level of the cerebral aqueduct (CA). Blood flow data were processed using a semi-automated MATLAB (MathWorks) tool.5 Derived hemodynamic parameters included blood flow pulsatile range, and pulsatility index (PI) in vessel segments including the internal carotid arteries (ICAs), basilar artery (BA), middle cerebral arteries (MCAs) and superior sagittal sinus. Total CBF from 4D-flow was defined as the summation of ICAs and BA flow. Arterial transit-time corrected CBF (tcCBF) maps were generated from MD-ASL data and co-registered to T1 images using SPM12. Grey matter (GM) and CSF probability maps were extracted from T1 images using CAT12.6 GM maps were binarized using a threshold of 0.75 and applied to tcCBF images to extract GM perfusion.7 PET: Amyloid (A) was assessed using [11C]-PiB. A+ was determined using a previously established global DVR threshold >1.19.8 Tau (T) was assessed using [18F]-MK6240. T+ was determined using a previously established entorhinal cortex SUVR threshold >1.27.9 Linear regressions were used to study the associations between blood flow, perfusion, and CSF flow markers. Group differences were assessed using Student's t-test (P<0.05 significance).Results:
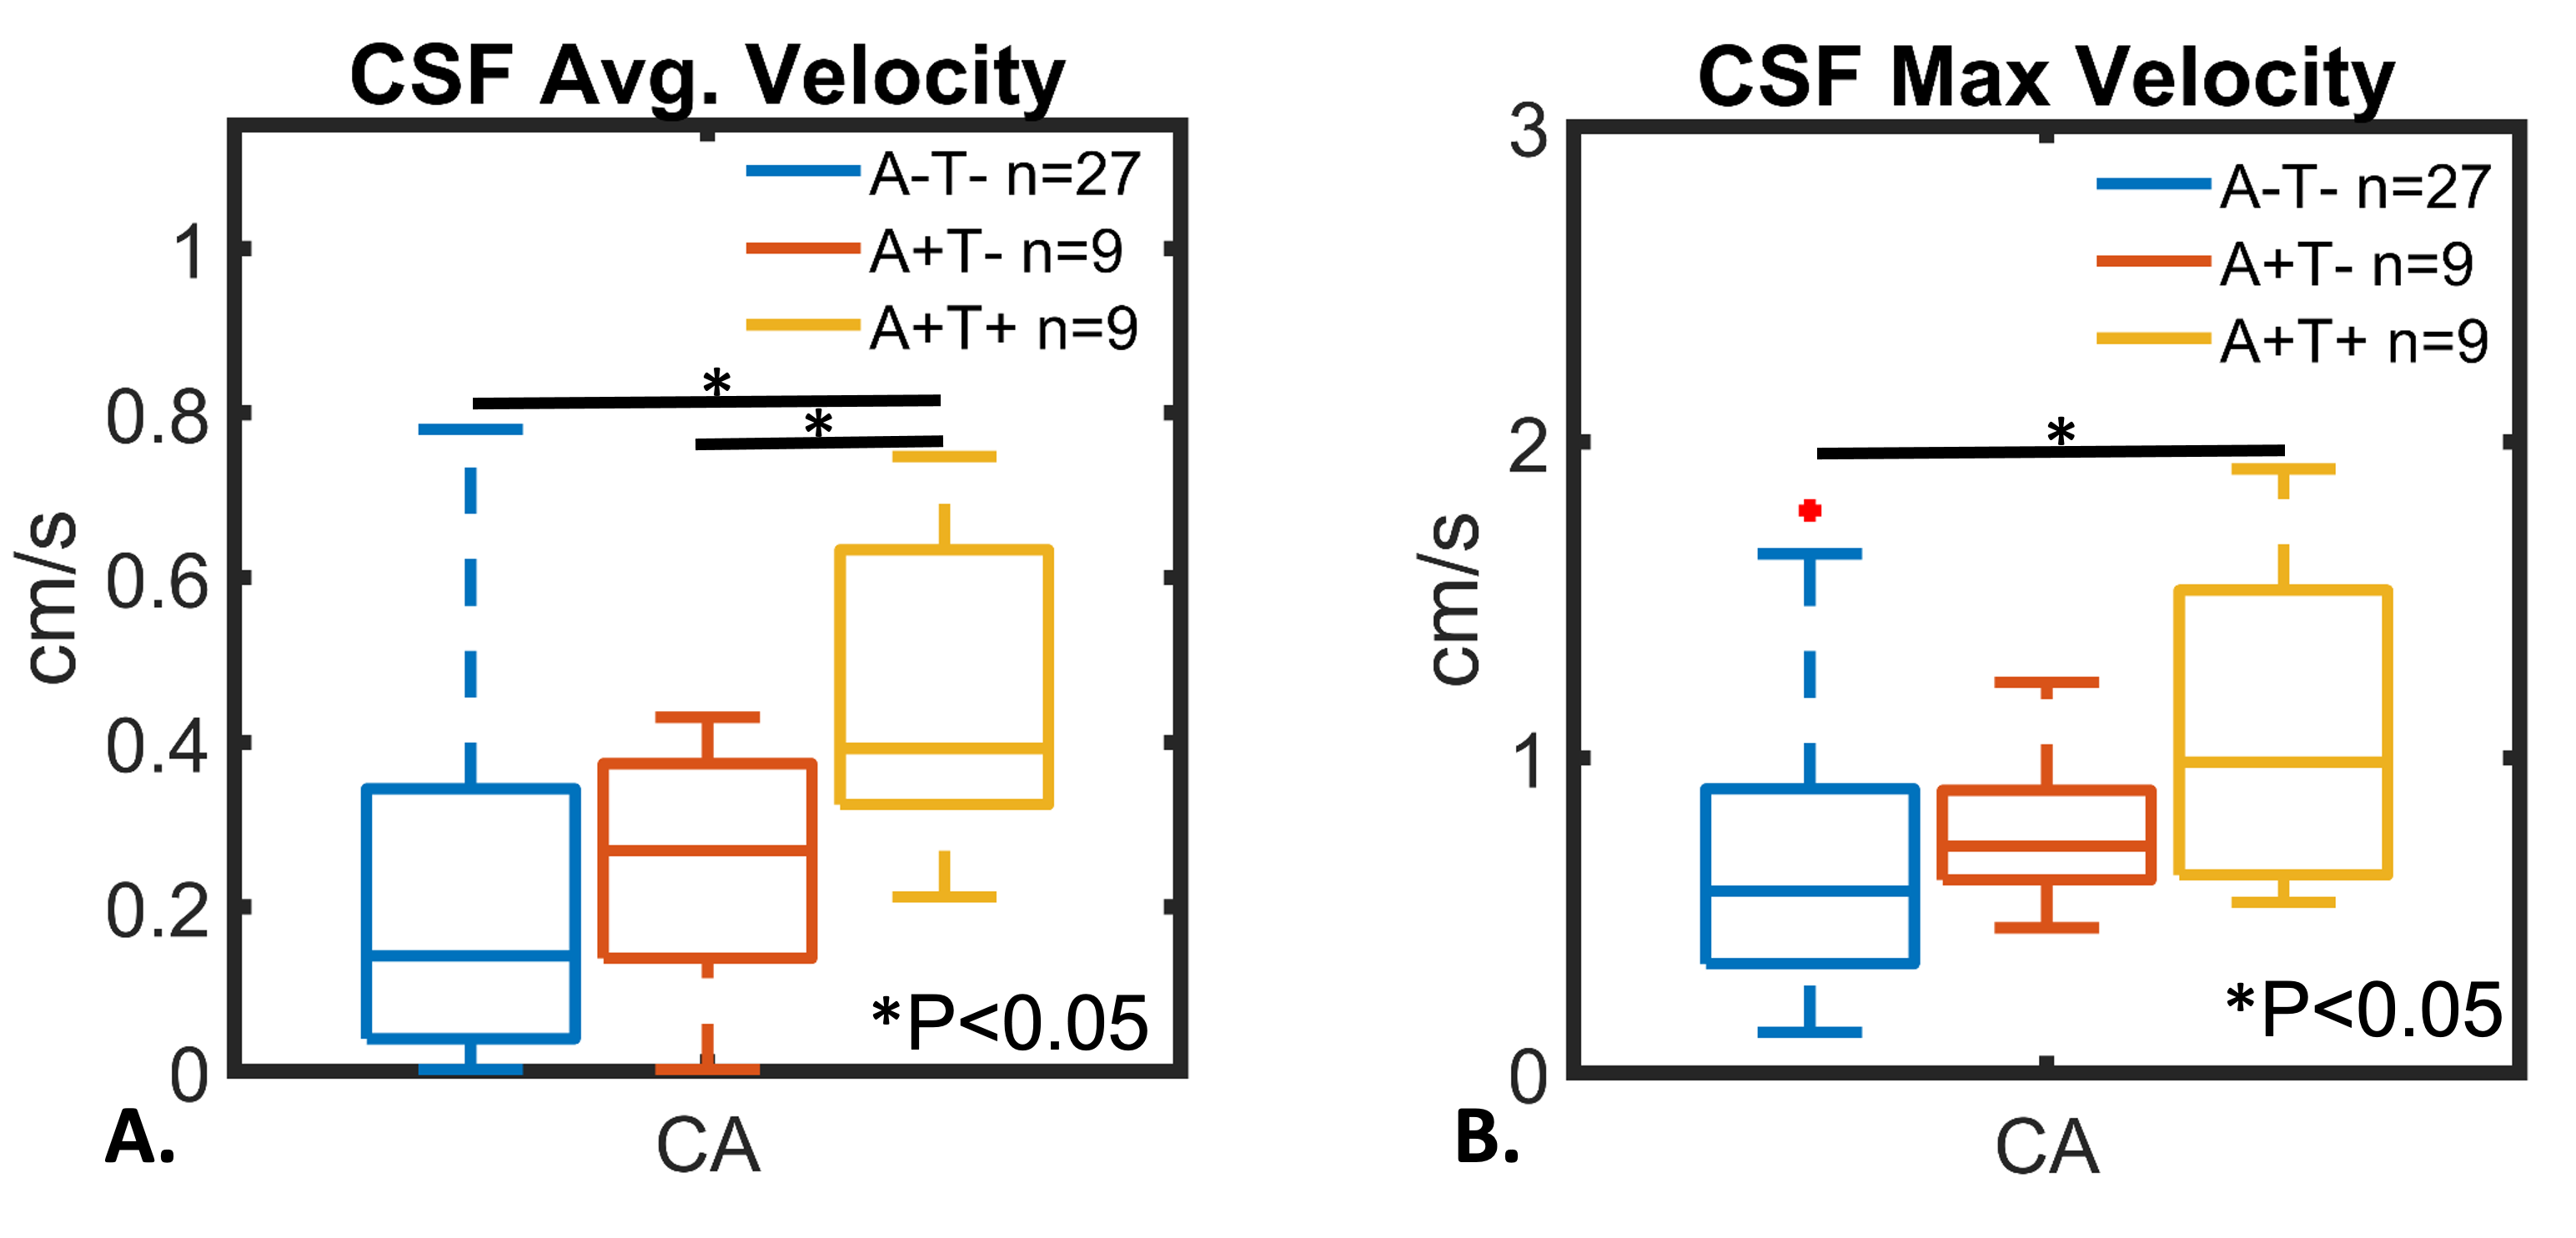
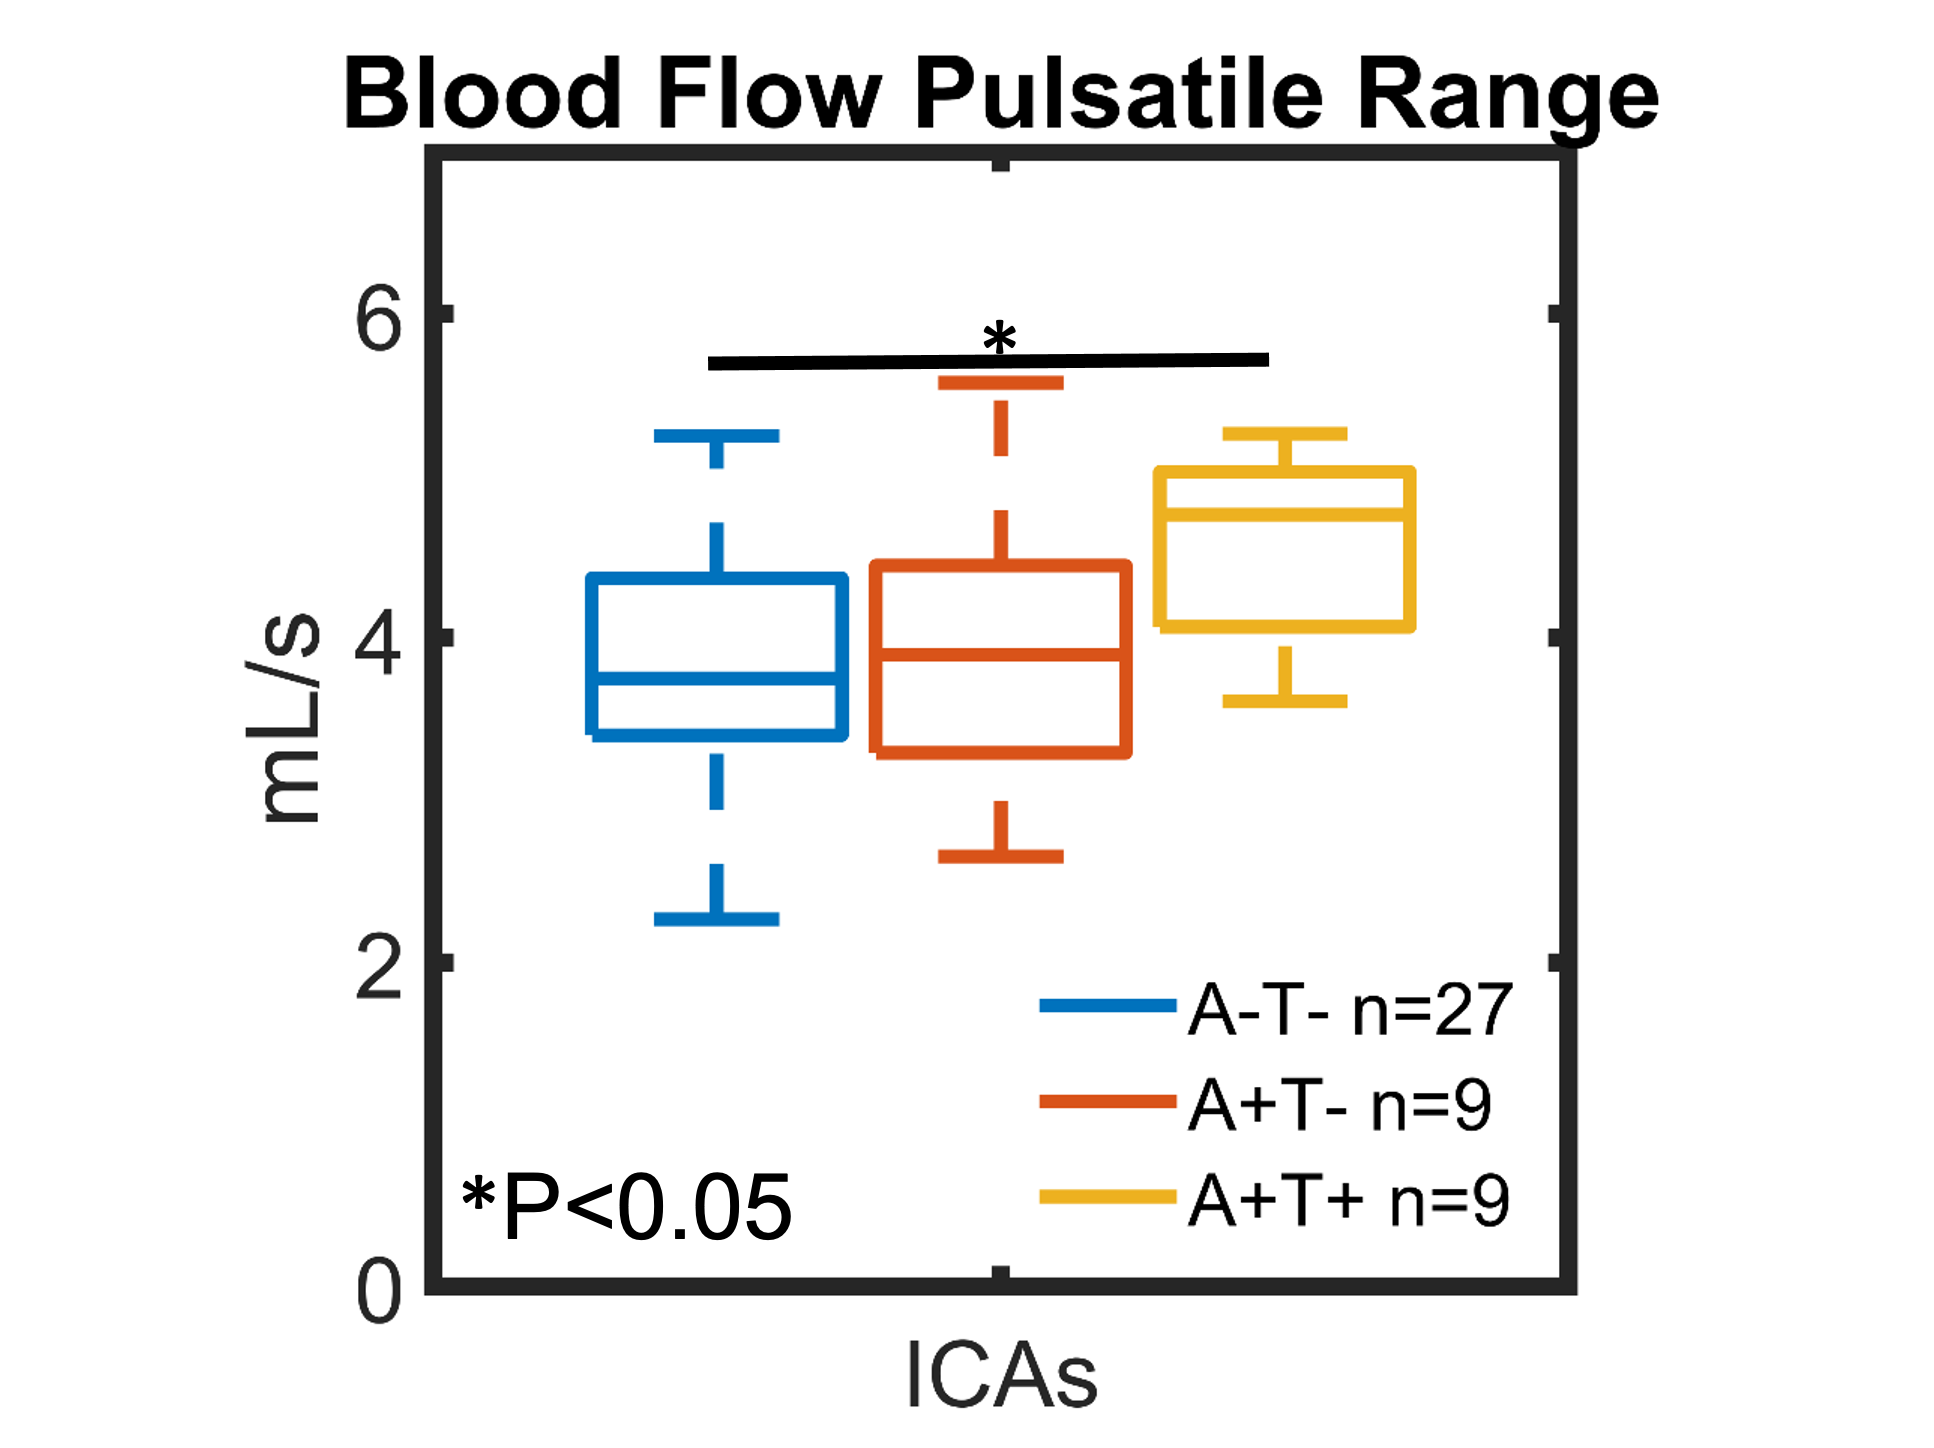
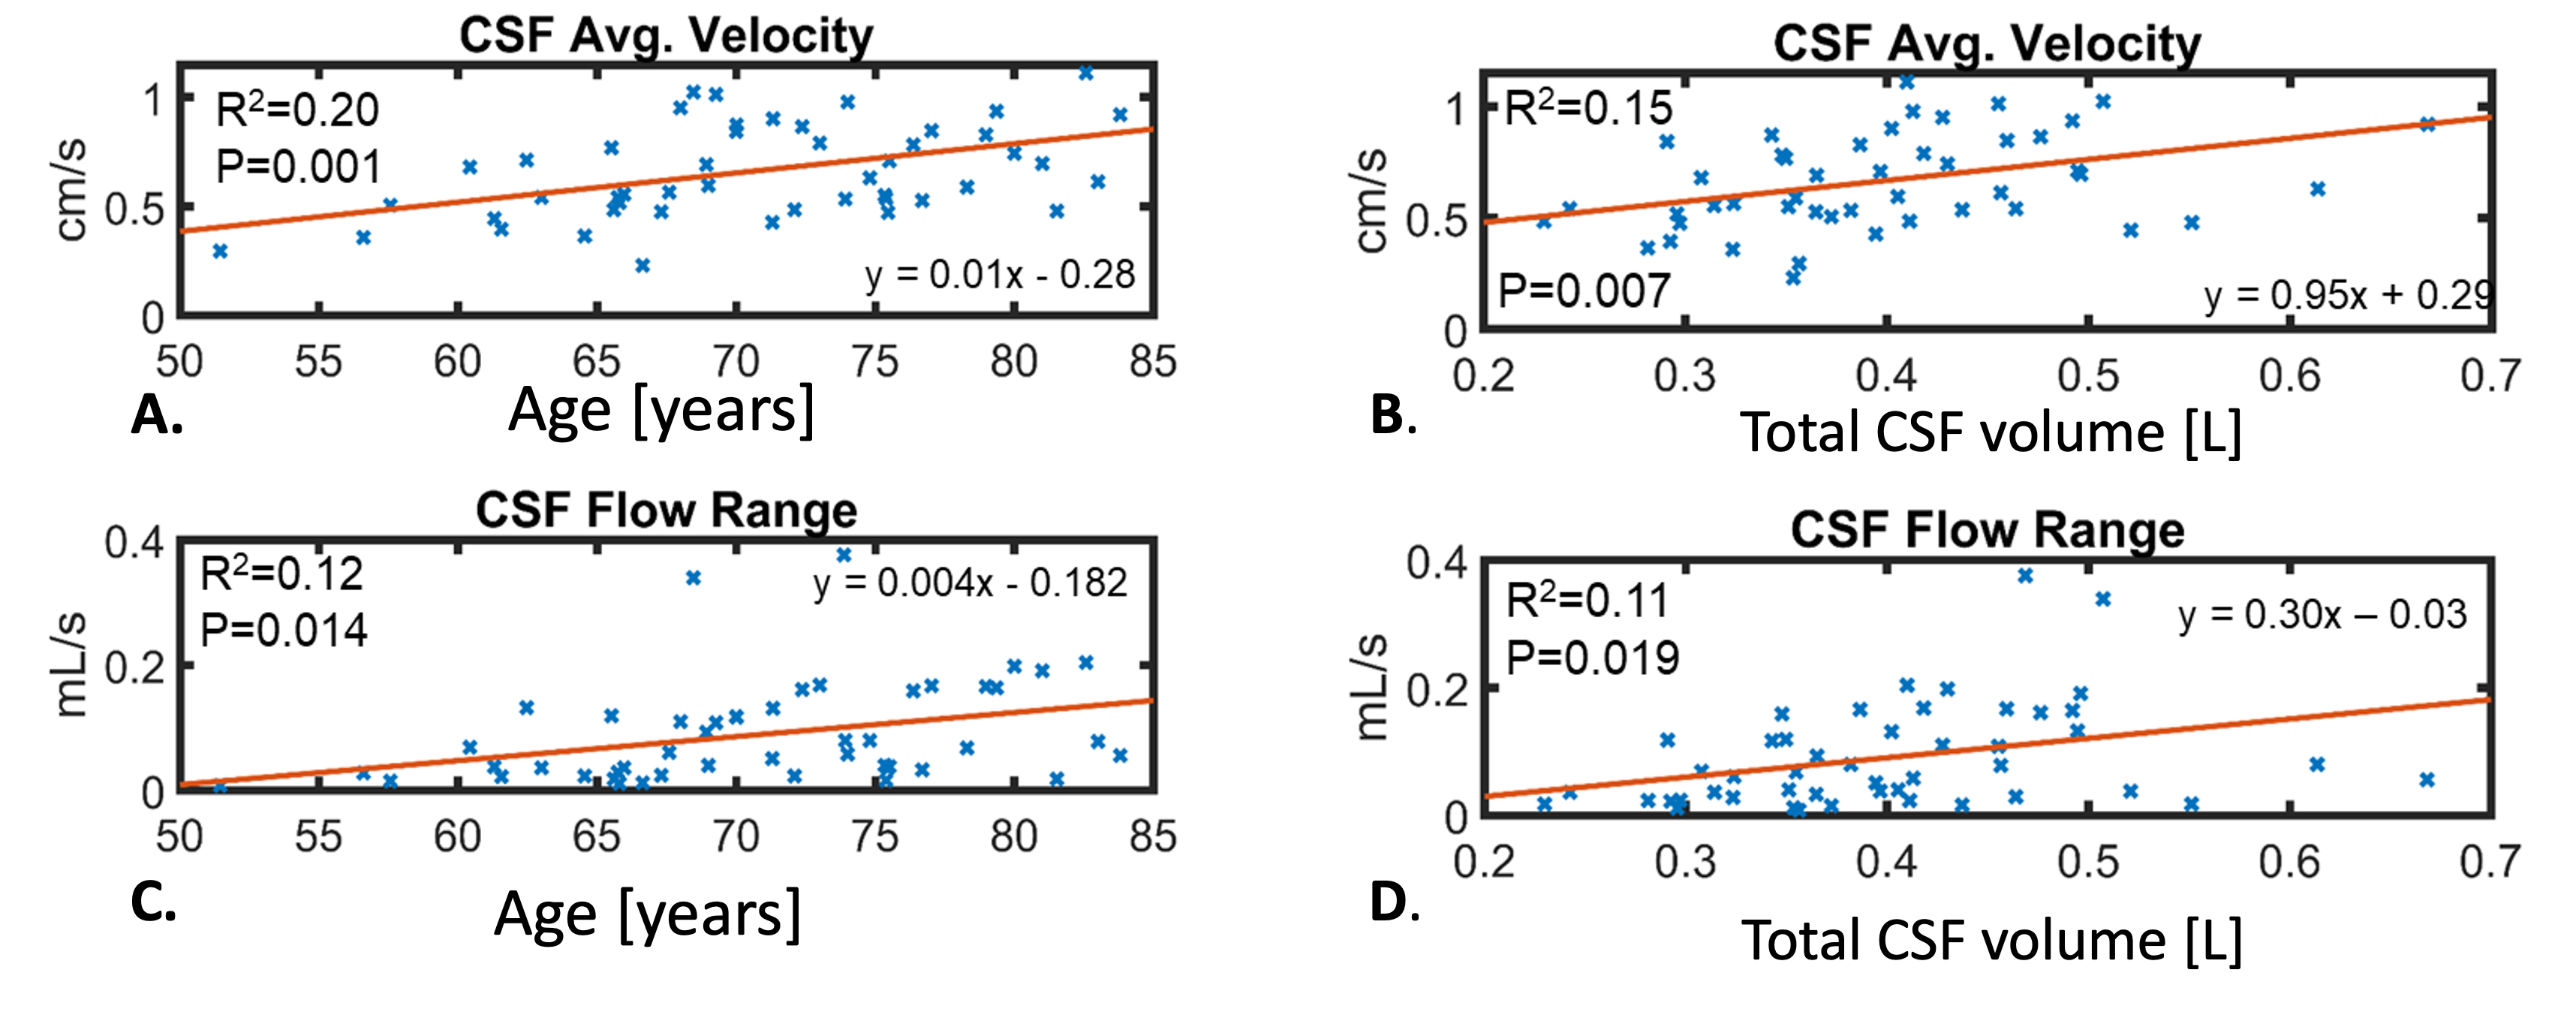
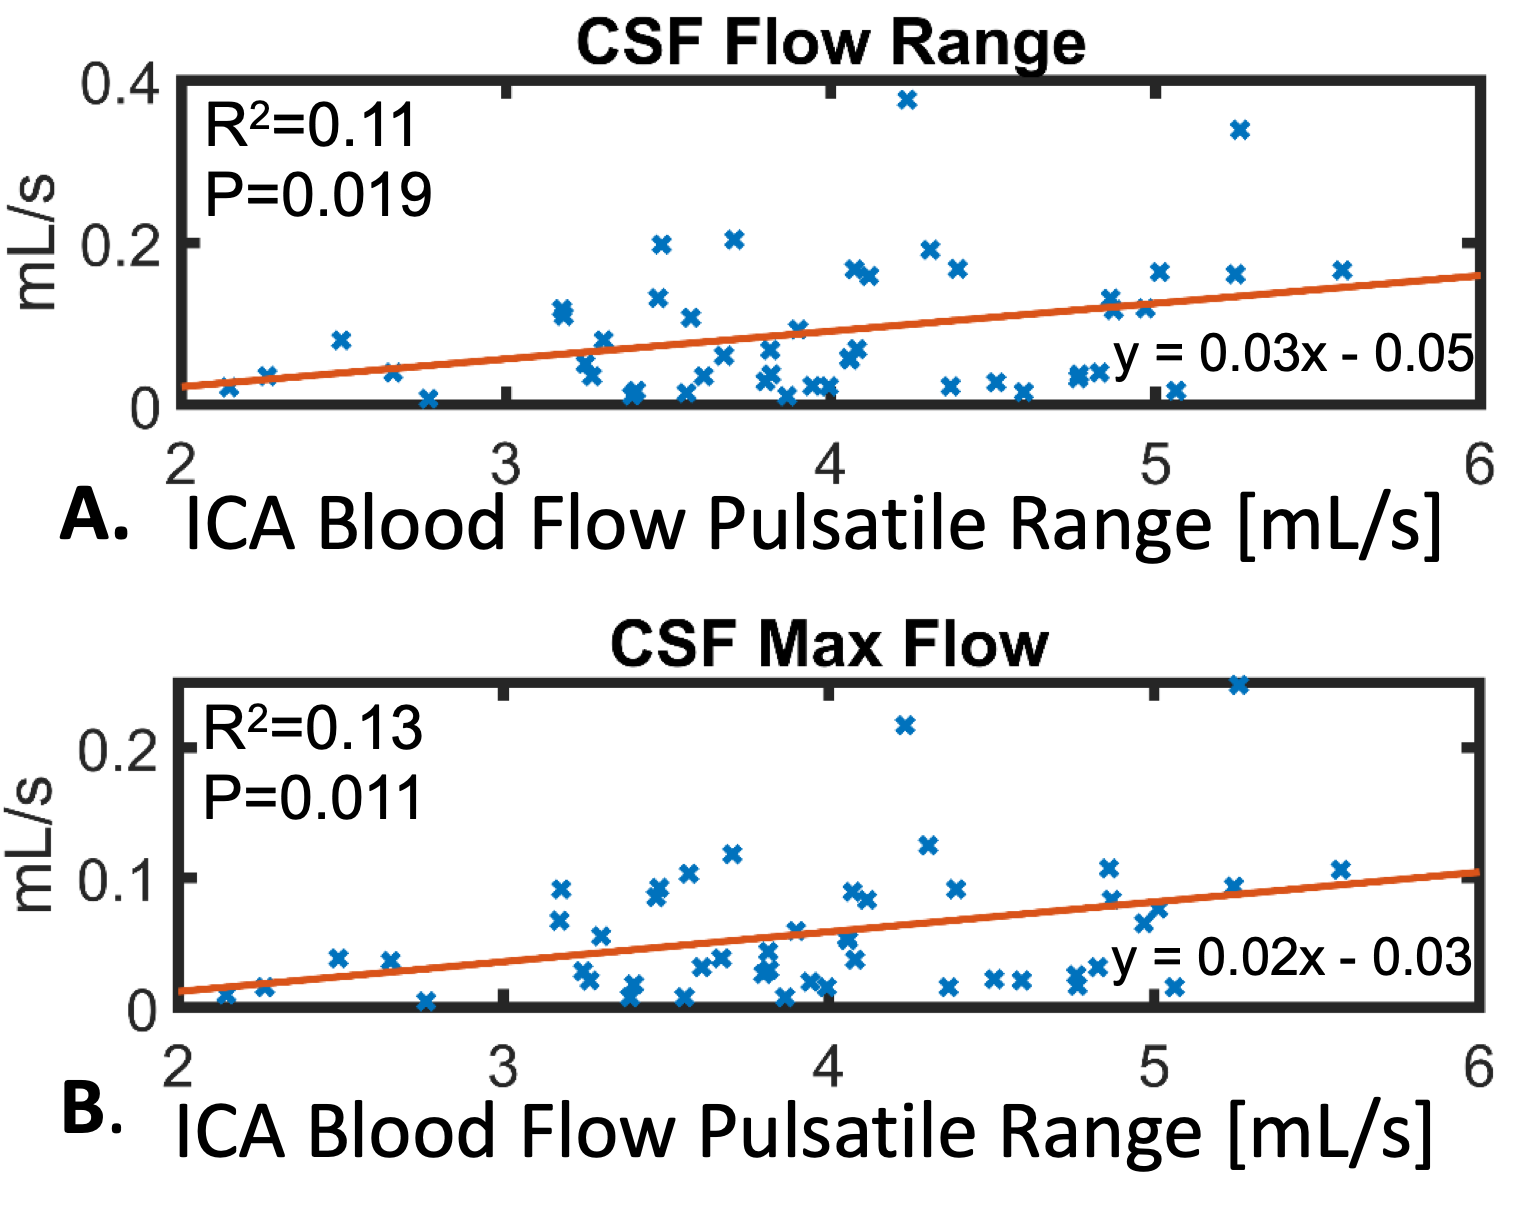
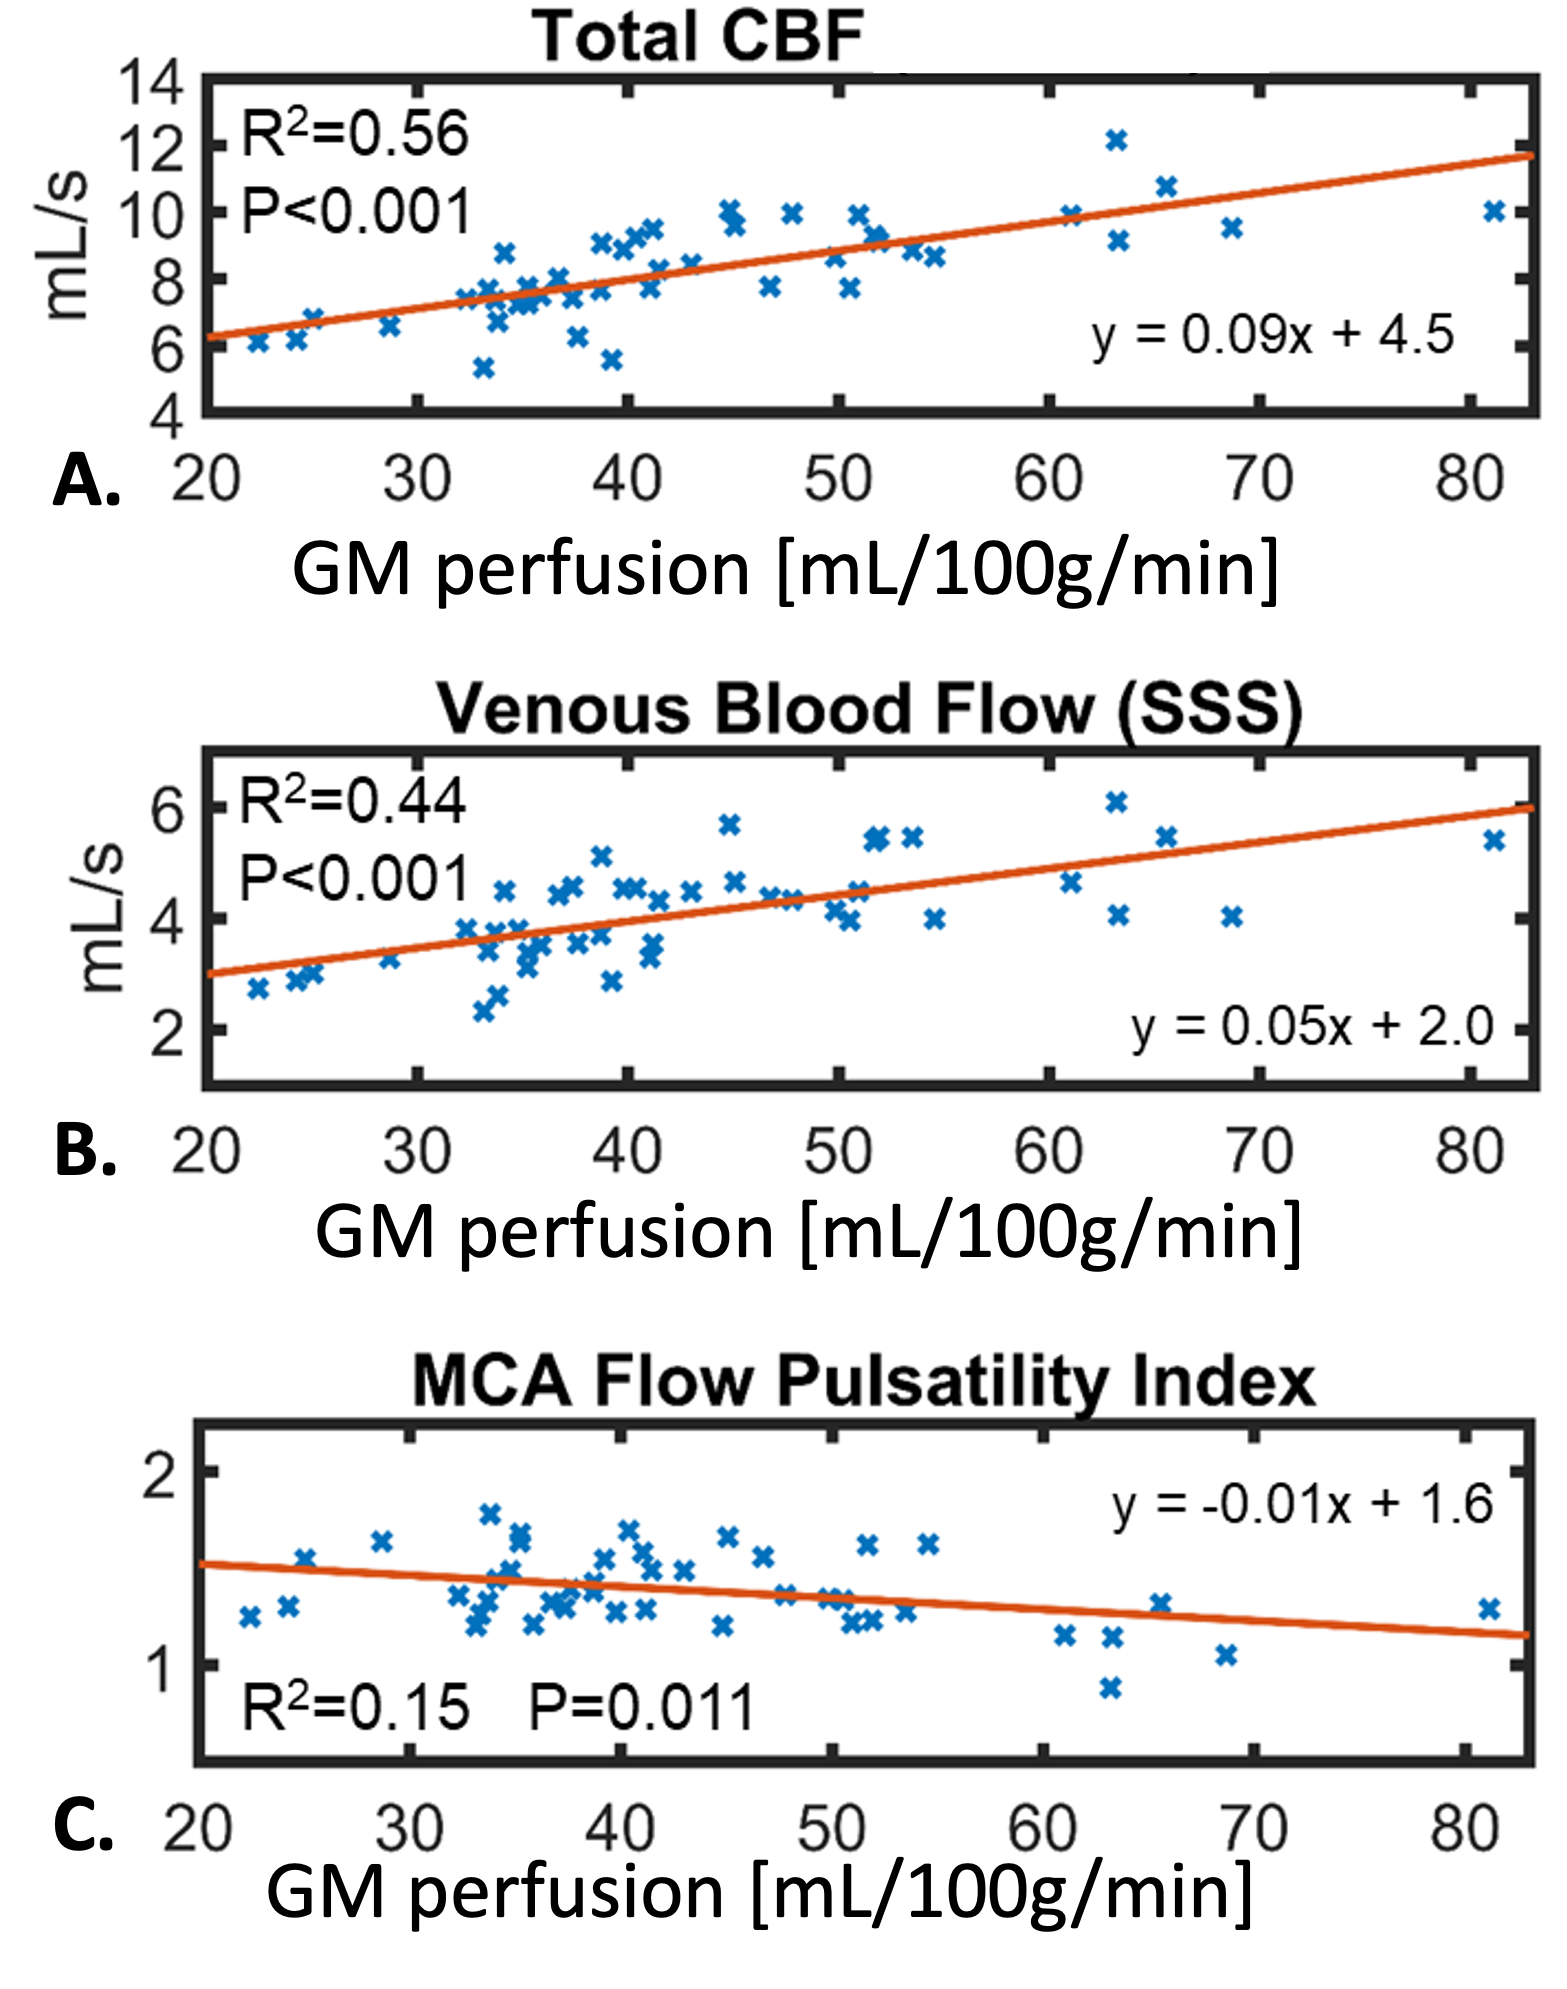
A+T+ participants showed significantly higher CSF flow velocities compared to A+T- (P=0.024) and A-T- (P=0.006) (Figure 1). ICAs blood pulsatile range was significantly higher in A+T+ compared to A-T- (P=0.007) (Figure 2). CSF flow velocities and range were positively correlated with age (R2=0.20, P=0.001; R2=0.12, P=0.014) and total intracranial CSF volume (R2=0.15, P=0.007; R2=0.11, P=0.019) (Figure 3). CSF flow range and maximum flow were positively correlated with ICAs blood pulsatile range (R2=0.11, P=0.019; R2=0.13, P=0.011) (Figure 4). Total CBF and venous blood flow from 4D-flow were positively correlated with GM perfusion from MD-ASL (R2=0.56, P<0.001; R2=0.44, P<0.001) (Figure 5). MCA PI was negatively correlated with GM perfusion (R2=0.15, P=0.011).Discussion and Conclusions:
Significant blood and CSF flow changes were observed in cognitively unimpaired AD biomarker positive participants including faster CA CSF flow velocities and blood flow pulsations in A+T+. Older age and larger intracranial CSF volume were associated with faster CA CSF flow. Blood flow pulsations and CSF flow dynamics were significantly correlated indicating neurofluid cardiac coupling. Together these observations suggest vascular driven and age related CSF flow changes in preclinical AD; however, CA is likely distant from where waste clearance presumably occurs. To further study brain clearance pathways, characterization of CSF flow in sub-arachnoid and perivascular spaces is needed. Finally, larger correlation coefficients were measured for CBF from 4D-flow and GM perfusion from MD-ASL compared to previous studies that used single delay ASL methods, likely due to increased robustness of MD approaches to late arterial filling.10Acknowledgements
We gratefully acknowledge research support from GE Healthcare, and funding support from the Alzheimer’s Association (AARFD-20-678095) and from NIH grants R01AG075788, R21AG077337, R01AG021155, P30AG062715, and UL1TR002373.References
1. Nedergaard M, Goldman SA. Glymphatic failure as a final common pathway to dementia. Science. 2020 Oct 2;370(6512):50-56. Doi: 10.1126/science.abb8739. PMID: 33004510; PMCID: PMC8186542.
2. Tarasoff-Conway JM, Carare RO, Osorio RS, et al. Clearance systems in the brain-implications for Alzheimer disease. Nat Rev Neurol. 2015 Aug;11(8):457-70. Doi: 10.1038/nrneurol.2015.119. Epub 2015 Jul 21. Erratum in: Nat Rev Neurol. 2016 Apr;12(4):248. PMID: 26195256; PMCID: PMC4694579.
3. Frank B, Ally M, Tripodis Y, et al. Trajectories of Cognitive Decline in Brain Donors With Autopsy-Confirmed Alzheimer Disease and Cerebrovascular Disease. Neurology. 2022 Jun 14;98(24):e2454-e2464. Doi: 10.1212/WNL.0000000000200304. Epub 2022 Apr 20. Erratum in: Neurology. 2023 Jan 24;: PMID: 35444054; PMCID: PMC9231841.
4. Johnson SC, Koscik RL, Jonaitis EM, et al. The Wisconsin Registry for Alzheimer’s Prevention: A review of findings and current directions. Alzheimers Dement (Amst). 2017 Dec 8;10:130-142. Doi: 10.1016/j.dadm.2017.11.007. PMID: 29322089; PMCID: PMC5755749.
5. Roberts GS, Hoffman CA, Rivera-Rivera LA, et al. Automated hemodynamic assessment for cranial 4D flow MRI. Magn Reson Imaging. 2023 Apr;97:46-55. Doi: 10.1016/j.mri.2022.12.016. Epub 2022 Dec 26. PMID: 36581214; PMCID: PMC9892280.
6. Gaser C, Dahnke R, Thompson PM, et al. CAT – A Computational Anatomy Toolbox for the Analysis of Structural MRI Data. bioRxiv 2022.06.11.495736; doi: https://doi.org/10.1101/2022.06.11.495736.
7. Chappell MA, McConnell FAK, Golay X, et al. Partial volume correction in arterial spin labeling perfusion MRI: A method to disentangle anatomy from physiology or an analysis step too far? Neuroimage. 2021 Sep;238:118236. Doi: 10.1016/j.neuroimage.2021.118236. Epub 2021 Jun 4. PMID: 34091034.
8. Racine AM, Clark LR, Berman SE, et al. Associations between Performance on an Abbreviated CogState Battery, Other Measures of Cognitive Function, and Biomarkers in People at Risk for Alzheimer’s Disease. J Alzheimers Dis. 2016 Oct 18;54(4):1395-1408. Doi: 10.3233/JAD-160528. PMID: 27589532; PMCID: PMC5074904.
9. Betthauser TJ, Koscik RL, Jonaitis EM, et al. Amyloid and tau imaging biomarkers explain cognitive decline from late middle-age. Brain. 2020 Jan 1;143(1):320-335. Doi: 10.1093/brain/awz378. Erratum in: Brain. 2020 Mar 1;143(3):e24. PMID: 31886494; PMCID: PMC6935717.
10. Dolui S, Wang Z, Wang DJJ, et al. Comparison of non-invasive MRI measurements of cerebral blood flow in a large multisite cohort. J Cereb Blood Flow Metab. 2016 Jul;36(7):1244-56. Doi: 10.1177/0271678X16646124. Epub 2016 May 3. PMID: 27142868; PMCID: PMC4929707.
Figures