3902
Microstructure Informed Susceptibility Source Separation (MI-SSS) Reveals Demyelination in Alzheimer’s Disease1Electrical and Computer Engineering, Cornell University, Ithaca, NY, United States, 2Department of Radiology, Weill Cornell Medicine, New York, NY, United States, 3Biomedical Engineering, Cornell University, Ithaca, NY, United States
Synopsis
Keywords: Alzheimer's Disease, White Matter, Microstructure
Motivation: Alzheimer’s Disease (AD) is the leading cause of dementia and the pathogenesis of AD is not well understood. Microstructural changes such as demyelination is known to be involved in AD progression and can noninvasive estimation of myelin content can help us better understand AD.
Goal(s): The aim of this study is to show MI-SSS potential in detection myelination changes in AD.
Approach: AD patient negative susceptibility content is compared with that in healthy subjects on both region and voxel level.
Results: MI-SSS demonstrated significantly lower negative susceptibility content in AD patients signaling AD pathology related demyelination.
Impact: Noninvasive imaging of brain microstructure may help to better understand pathological changes in Alzheimer’s Disease. Microstructure Informed Susceptibility Source Separation (MI-SSS) provides important information about the brain microstructure such as myelin content that can easily be adopted in clinical settings.
Introduction
Alzheimer's disease (AD) is the leading cause of dementia, impacting approximately 5.8 million Americans. It is a socially and economically debilitating condition without a cure1. The key pathological features of AD include the presence of extracellular beta-amyloid plaques (Aβ) and intracellular neurofibrillary tangles containing tau protein. These hallmark characteristics are thought to contribute to neurodegeneration, as elucidated in the 2018 NIA-AA (National Institute on Aging and Alzheimer's Association) "ATN" Research Framework2.Nevertheless, there is a widespread belief that the degeneration of white matter associated with small vessel ischemic disease, aging, and AD pathology plays a role in the pathogenesis of Alzheimer's disease3,4. This has not been formally incorporated into the ATN (Amyloid, Tau, Neurodegeneration) framework as of now. Additionally, recent research has uncovered that dysfunction and loss of myelin might be preceding amyloidosis, suggesting that myelin deterioration with age may play a pivotal role in the early pathogenesis of Alzheimer's disease (AD). Consequently, there is a compelling interest in the measurement of myelin content as a potentially crucial avenue in AD research5.
Quantitative susceptibility mapping (QSM) is a noninvasive imaging modality designed to map the distribution of susceptibility inside the body6 and uses multi gradient-echo (mGRE). In the brain, the main contributors to susceptibility contrast are diamagnetic myelin and paramagnetic iron. Therefore, QSM is a strong candidate for myelin quantification in AD, however, detecting myelin-specific contribution requires additional processing. Susceptibility source separation (SSS) has been developed for this purpose and provides diamagnetic ($$$\chi^-$$$) and paramagnetic ($$$\chi^+$$$) susceptibility maps7-9 from mGRE. $$$-\chi^-$$$ is regarded as a biomarker for brain myelin content.
SSS has been used to detect changes in the brain myelin in AD10. However, mGRE signal is susceptible to microstructural effects such as fiber orientation-dependent magnitude decay rates. Moreover, altered water content such as edema can affect the estimated susceptibility maps. Microstructure-informed SSS is developed to address these effects for more accurate susceptibility estimation. Here, we apply MI-SSS for the detection of demyelination in AD.
Methods
MI-SSS is a post-processing technique based on biophysical modeling of neural tissues. Tissue microstructure is modeled with three water pools (myelin, intra-extra cellular, and free water), and diamagnetic hollow cylindrical and paramagnetic isotropic susceptibility sources. $$$\chi^-$$$, $$$\chi^+$$$, and FWF values of each voxel are estimated with stochastic matching pursuit using a pre-computed dictionary with the described biophysical model11. For estimation, mGRE magnitude signal, QSM, and diffusion tensor imaging (DTI) – derived fiber orientation map are utilized.8 AD patients (3 females, age(min/max/mean):54/80/69), 15 individuals suffer from mild cognitive impairment (MCI) (14 females, age(min/max/mean):57/84/68), and 18 healthy control (HC) subjects (14 females, age(min/max/mean):57/84/68) were scanned on a 3T MRI scanner (Prismafit, Siemens Healthineers, Erlangen, Germany) with mGRE: FoV=256 mm, TR=63 ms, 10 TE=6.1:5.8:58.3 ms, flip angle=5°, voxel size 1x1x1 mm3 (interpolated to 0.5x0.5x1 mm3 on scanner). DTI data is collected with 2D Spin Echo Echo Planar Imaging (SE-EPI) with acquisition parameters: FoV=210 mm, TR=3230 ms, TE=89.20 ms, Flip angle=78°, voxel size=1.5 mm isotropic, 98 diffusion directions, b-values = 1500, 3000 mm2/s. Whole-brain T1-weighted (T1w) data was also collected using Magnetization Prepared Rapid Acquisition Gradient Echo (MPRAGE) with acquisition parameters: axial field of view FOV = 25.6 cm, phase FOV factor 100%, repetition time TR = 2400 ms, echo time TE = 2.96 ms, voxel size = 1 mm3 isotropic.
Estimated QSM, $$$\chi^-$$$, $$$\chi^+$$$, and FWF maps as well as T1w images are warped into standard (Montreal Neurological Institute) MNI space using Advanced Normalization Tools ANTs for analysis12. Region of interest level (ROI) analysis is done using the two-sample t-test.
Results and Discussion
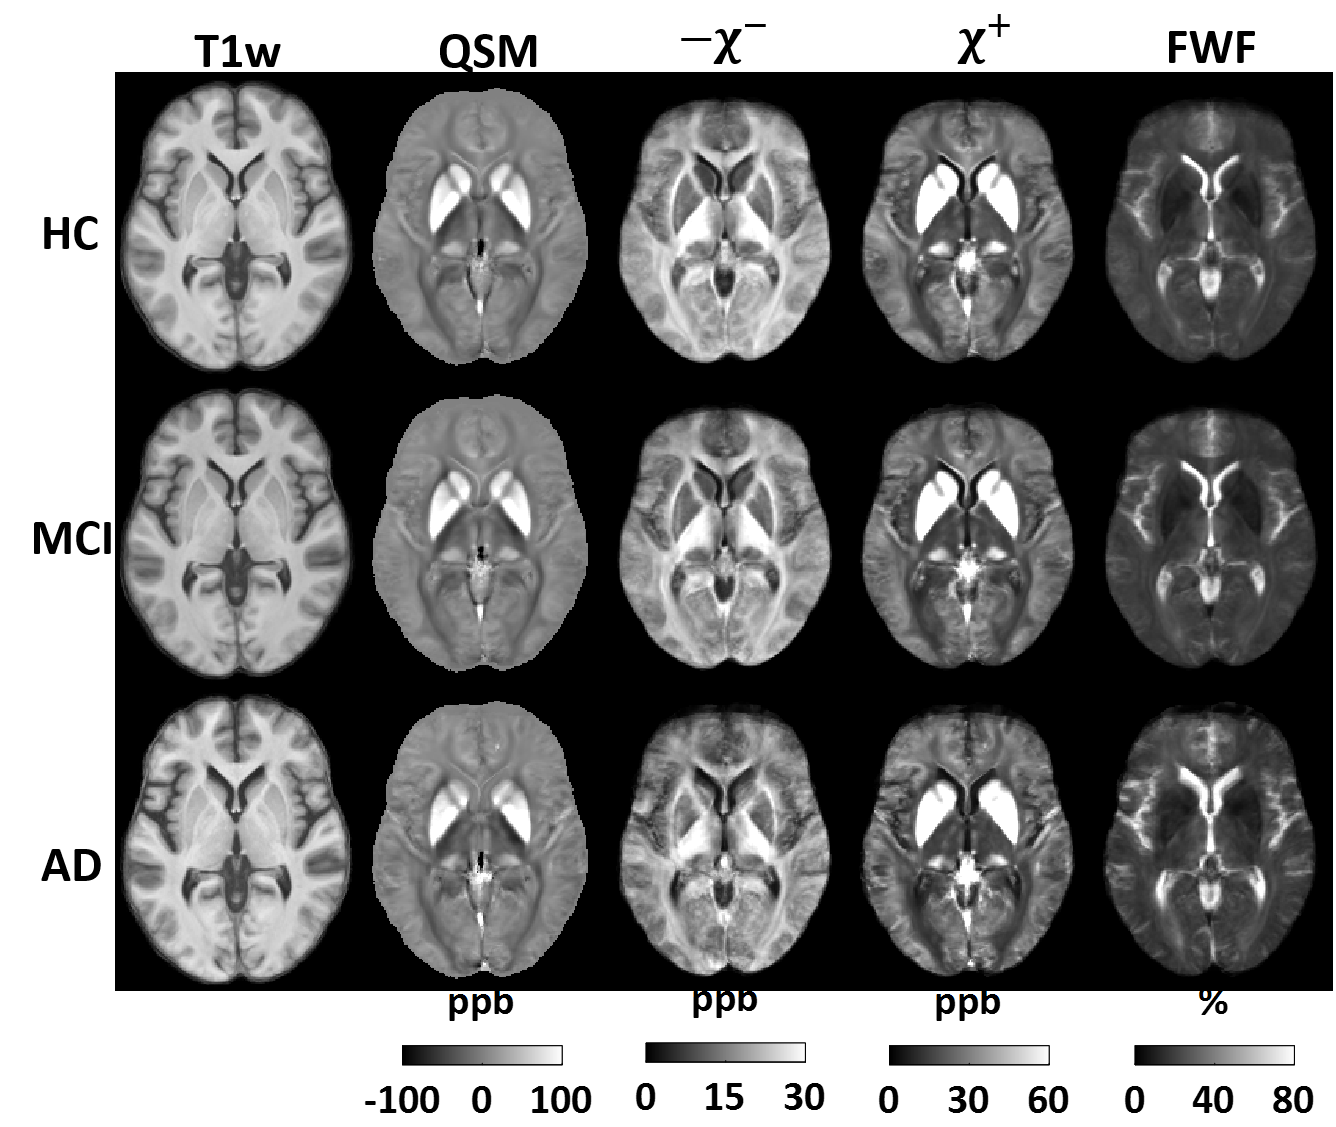
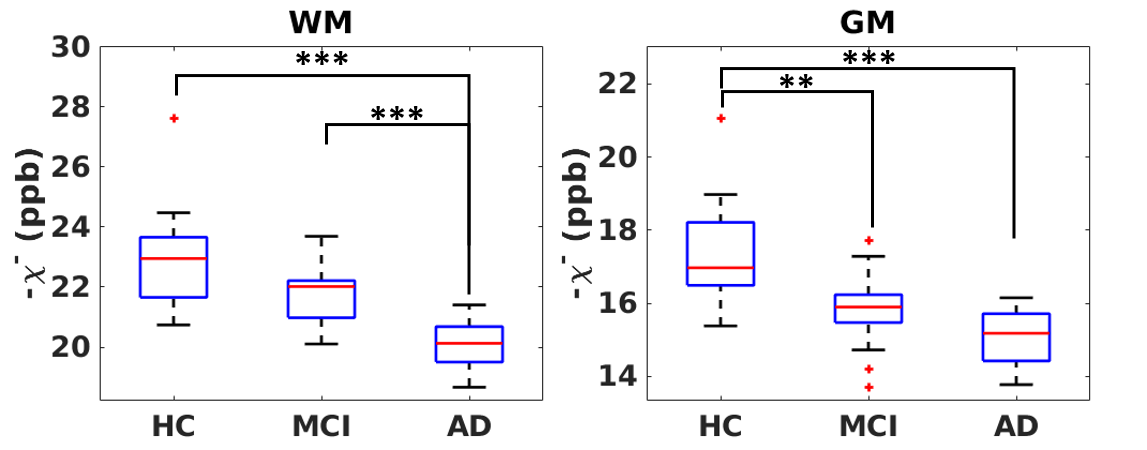
Figure 1 shows group averaged T1w images, QSM, $$$-\chi^-$$$, $$$\chi^+$$$, and FWF maps in MNI space.ROI level comparisons of $$$-\chi^-$$$ in white matter (WM) and gray matter (GM) are shown in Figure 2. $$$-\chi^-$$$ values can be seen to have a decreasing trend from HC to MCI to AD. This signals the demyelination due to neurodegeneration in AD pathology, and can be seen that it affects both WM and GM.
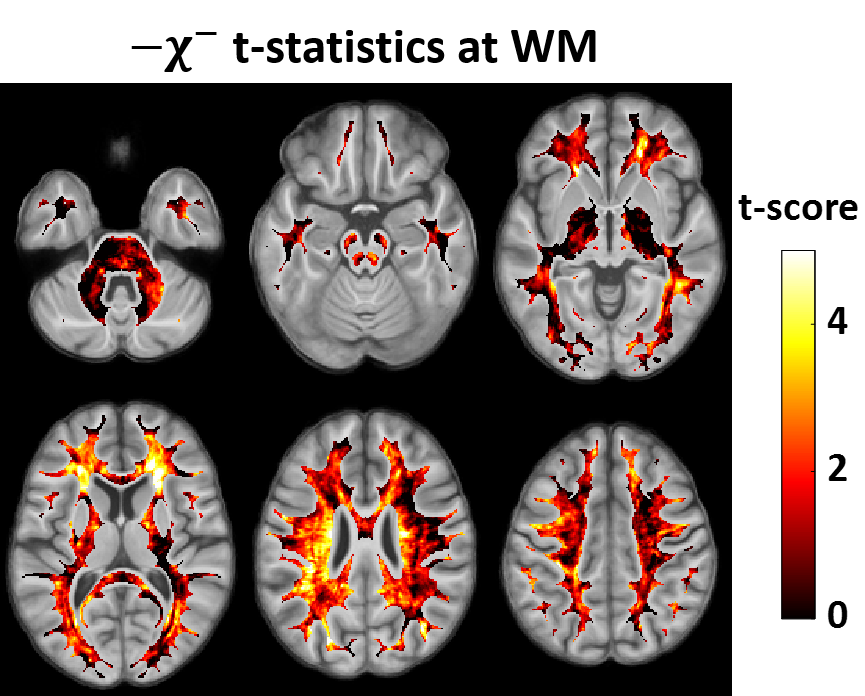
In Figure 3, the voxel-wise t-score of $$$-\chi^-$$$ between HC subjects and AD patients in WM is depicted. Decreased $$$-\chi^-$$$ in AD patients, especially around the ventricles parietal frontal white matter shows demyelination occurs predominantly in regions associated with white matter hyperintensities10,13.
Conclusion
MI-SSS may be able to detect myelin content changes in the brain due to AD pathology.Acknowledgements
This work was supported in part by research grants from the NIH: R01NS105144, R01NS090464, R01NS095562, S10OD021782, R01HL151686, R01 R56AG058913, R01 AG068398, AG057848, R01AG022374, RF1 AG057570, and National MS Society: RG-1602-07671.References
1. 2020 Alzheimer's disease facts and figures. Alzheimers Dement 2020.
2. Cummings J. The National Institute on Aging-Alzheimer's Association Framework on Alzheimer's disease: Application to clinical trials. Alzheimers Dement 2019;15(1):172-178.
3. Alber J, Alladi S, Bae HJ, Barton DA, Beckett LA, Bell JM, Berman SE, Biessels GJ, Black SE, Bos I, Bowman GL, Brai E, Brickman AM, Callahan BL, Corriveau RA, Fossati S, Gottesman RF, Gustafson DR, Hachinski V, Hayden KM, Helman AM, Hughes TM, Isaacs JD, Jefferson AL, Johnson SC, Kapasi A, Kern S, Kwon JC, Kukolja J, Lee A, Lockhart SN, Murray A, Osborn KE, Power MC, Price BR, Rhodius-Meester HFM, Rondeau JA, Rosen AC, Rosene DL, Schneider JA, Scholtzova H, Shaaban CE, Silva N, Snyder HM, Swardfager W, Troen AM, van Veluw SJ, Vemuri P, Wallin A, Wellington C, Wilcock DM, Xie SX, Hainsworth AH. White matter hyperintensities in vascular contributions to cognitive impairment and dementia (VCID): Knowledge gaps and opportunities. Alzheimers Dement (N Y) 2019;5:107-117.
4. Nasrabady SE, Rizvi B, Goldman JE, Brickman AM. White matter changes in Alzheimer's disease: a focus on myelin and oligodendrocytes. Acta Neuropathol Commun 2018;6(1):22.
5. Depp C, Sun T, Sasmita AO, Spieth L, Berghoff SA, Nazarenko T, Overhoff K, Steixner-Kumar AA, Subramanian S, Arinrad S, Ruhwedel T, Möbius W, Göbbels S, Saher G, Werner HB, Damkou A, Zampar S, Wirths O, Thalmann M, Simons M, Saito T, Saido T, Krueger-Burg D, Kawaguchi R, Willem M, Haass C, Geschwind D, Ehrenreich H, Stassart R, Nave KA. Myelin dysfunction drives amyloid-β deposition in models of Alzheimer's disease. Nature 2023;618(7964):349-357.
6. Wang Y, Liu T. Quantitative susceptibility mapping (QSM): Decoding MRI data for a tissue magnetic biomarker. Magn Reson Med 2015;73(1):82-101.
7. Dimov AV, Nguyen TD, Gillen KM, Marcille M, Spincemaille P, Pitt D, Gauthier SA, Wang Y. Susceptibility source separation from gradient echo data using magnitude decay modeling. J Neuroimaging 2022;32(5):852-859.
8. Shin HG, Lee J, Yun YH, Yoo SH, Jang J, Oh SH, Nam Y, Jung S, Kim S, Fukunaga M, Kim W, Choi HJ. χ-separation: Magnetic susceptibility source separation toward iron and myelin mapping in the brain. Neuroimage 2021;240:118371.
9. Chen J, Gong NJ, Chaim KT, Otaduy MCG, Liu C. Decompose quantitative susceptibility mapping (QSM) to sub-voxel diamagnetic and paramagnetic components based on gradient-echo MRI data. Neuroimage 2021;242:118477.
10. Ahmed M, Chen J, Arani A, Senjem ML, Cogswell PM, Jack CR, Liu C. The diamagnetic component map from quantitative susceptibility mapping (QSM) source separation reveals pathological alteration in Alzheimer's disease-driven neurodegeneration. Neuroimage 2023;280:120357.
11. Sisman M, Nguyen TD, Roberts AG, Romano DJ, Dimov AV, Kovanlikaya I, Spincemaille P, Wang Y. Microstructure-Informed Myelin Mapping (MIMM) from Gradient Echo MRI using Stochastic Matching Pursuit. medRxiv 2023.
12. Avants BB, Tustison N, Song G. Advanced normalization tools (ANTS). Insight j 2009;2(365):1-35.
13. Wardlaw JM, Valdés Hernández MC, Muñoz-Maniega S. What are white matter hyperintensities made of? Relevance to vascular cognitive impairment. J Am Heart Assoc 2015;4(6):001140.
Figures