3898
Brain age pre-training for prediction of Alzheimer’s disease diagnosis and mild cognitive impairment progression1Centre for Sleep and Cognition, Yong Loo Lin School of Medicine, National University of Singapore, Singapore, Singapore, 2Centre for Translational MR Research, Yong Loo Lin School of Medicine, National University of Singapore, Singapore, Singapore, 3Integrative Sciences and Engineering Programme (ISEP), National University of Singapore, Singapore, Singapore, 4Department of Electrical and Computer Engineering, National University of Singapore, Singapore, Singapore, 5N.1 Institute for Health & Institute for Digital Medicine (WisDM), National University of Singapore, Singapore, Singapore, 6Memory, Aging and Cognition Centre, National University Health System, Singapore, Singapore, 7Department of Psychological Medicine, Yong Loo Lin School of Medicine, National University of Singapore, Singapore, Singapore, 8Raffles Neuroscience Centre, Raffles Hospital, Singapore, Singapore, 9Department of Pharmacology, Yong Loo Lin School of Medicine, National University of Singapore, Singapore, Singapore
Synopsis
Keywords: Alzheimer's Disease, Brain, transfer learning, pretrain, AD diagnosis, MCI progression, stable progressive MCI
Motivation: Literature suggests large multisite brain age pre-trained models (indirect models) hold significant promise for downstream prediction on small clinical samples via transfer learning.
Goal(s): Our goal was to determine if such indirect models indeed outperform models trained-from-scratch (direct models), across varying training and validation set sizes, on two clinical prediction tasks: Alzheimer’s disease (AD) diagnosis, and mild cognitive impairment (MCI) progression.
Approach: State-of-the-art brain age model pre-trained on n=53,542 diverse dataset was used as initialization for indirect models.
Results: For AD Diagnosis, Direct model significantly outperformed feature extracted indirect model starting from 400 training and validation samples or more.
Impact: The 400-training-and-validation-samples threshold encourages clinical institutions with limited computing resources and small sample sizes (n<400) to feature extract the brain age pre-trained model instead of training from scratch, potentially lowering healthcare costs and speeding up Alzheimer’s disease diagnosis and prognosis.
Background
An individual's brain age, predicted by a machine learning algorithm using structural brain MRI data, holds vital clinical importance. Deviations in brain age, when higher than actual age, are linked to cognitive decline1, mortality2, and brain disorders3. Age data is widely available across MRI datasets. Therein lies a theoretical advantage in training brain age models on larger and diverse datasets, and thus applying these large pre-trained brain age models for downstream prediction on smaller clinical samples via transfer learning4. Alzheimer’s disease (AD) is an irreversible neurodegenerative disease resulting in severe memory loss, affects 32 million people globally5, and is the 7th leading cause of death globally6. Early AD detection is thus paramount for interventions to slow down AD progression7-9. Therefore, we aim to investigate if pre-trained brain age models outperform models trained-from-scratch to diagnose AD and predict mild cognitively impaired (MCI) progression to AD.Methods
We utilized 3 datasets for both AD diagnosis and MCI progression tasks – from the Alzheimer’s Disease Neuroimaging Initiative (ADNI), the Australian Imaging, Biomarkers and Lifestyle (AIBL) study, the Singapore Memory Aging and Cognition Centre (MACC) Harmonization cohort. There was no overlap of participants between the two tasks.Both tasks use binary classification and employ the same nested cross-validation method, evaluating performance using the test AUC (Area Under the Curve). Analyses were repeated with various training + validation set sizes, while maintaining consistent test sets and training to validation ratios. Test AUCs for models at the same training + validation set sizes were compared using the re-sampled t-test procedure, followed by FDR multiple comparisons correction. All models use the same network architecture backbone as the state-of-the-art pre-trained brain age model4.
Feature-extracted pre-trained models process MRI inputs through a pre-trained model until the second-to-last layer, generating 64-dimensional outputs per participant. These outputs are used to train a logistic regression model for label prediction4.
Finetuned pre-trained models involved unfreezing all layers, and the last age prediction layer was replaced with a binary prediction layer.
AD diagnosis aimed to distinguish between AD and non-cognitively impaired (NCI) individuals, involving 856 ADNI, 156 AIBL, and 260 MACC participants. Three models were compared, including a trained-from-scratch model (Direct-scratch), feature-extracted brain age pre-trained model (Indirect-brainage), and a finetuned brain age pre-trained model (Indirect-finetune), with training + validation set sizes ranging from 50 to 997. Indirect-brainage and Indirect-finetune were initialized with the state-of-the-art pre-trained brain age model4.
MCI progression aimed to distinguish between stable from progressive MCI, utilizing 478 ADNI, 20 AIBL, and 78 MACC participants. Three models were compared, consisting of a trained-from-scratch model (Direct-scratch), feature-extracted Indirect-brainage-finetune (Indirect-brainage-finetune-AD), and feature-extracted Direct-scratch (Direct-AD), with training + validation set sizes ranging from 50 to 448.
Results
Figure 1 displays AD diagnosis test AUC for three models – Indirect-brainage, Indirect-brainage-finetune, and Direct-scratch at the largest training and validation set size of 997. The finetuned Indirect-brainage-finetune significantly outperforms feature-extracted Indirect-brainage.Figure 2 illustrates relationship between the model's AD diagnosis test AUC and the training and validation set sizes for three models – Indirect-brainage, Indirect-brainage-finetune, and Direct-scratch. Table 1 presents p-values from re-sampled t-tests comparing Direct-scratch and Indirect-brainage, as well as Direct-scratch and Indirect-brainage-finetune across different training and validation sample sizes. Direct-scratch outperformed Indirect-brainage significantly from size 400 or greater up to the largest size of 997. However, there were no significant differences between Direct-scratch and Indirect-brainage-finetune across all training and validation set sizes.
Figure 3 illustrates MCI progression test AUC for three models – Direct-scratch, Direct-AD, and Indirect-brainage-finetune-AD at the largest training and validation set size of 448. Direct-AD, which extracted AD diagnosis features significantly outperforms trained-from-scratch Direct-scratch.
Figure 4 depicts relationship between the model's MCI progression test AUC and the training and validation set sizes for two models – Indirect-brainage-finetune-AD and Direct-AD. Notably, there were no significant differences in test AUCs between the two models across all training and validation set sizes.
Conclusion
For AD diagnosis, finetuning the pre-trained brain age model significantly improves prediction as compared to feature extraction of the pre-trained brain age model. Interestingly, a model trained-from-scratch significantly outperforms a feature extracted pre-trained brain age model at a training and validation sample size equal to 400 or greater, at AD diagnosis. Hence, for smaller sample sizes (less than 400), using the less computationally intensive feature extraction from the pre-trained model is justified over training a model from scratch.For MCI progression, feature extracting the pre-trained AD diagnosis model significantly improves prediction as compared to the trained-from-scratch at the largest training and validation set size. This justifies AD diagnosis pre-training for improving MCI progression prediction performance.
Acknowledgements
This work was supported by the Singapore National Research Foundation (NRF) Fellowship (Class of 2017), the National University of Singapore Yong Loo Lin School of Medicine (NUHSRO/2020/124/TMR/LOA), the Singapore National Medical Research Council (NMRC) LCG (OFLCG19May-0035), NMRC STaR (STaR20nov-0003), and the United States National Institutes of Health (R01MH120080).
Data was collected by the AIBL study group. AIBL study methodology has been reported previously (Ellis et al. 2009)
Data collection and sharing for this project was funded by the Alzheimer's Disease Neuroimaging Initiative (ADNI) (National Institutes of Health Grant U01 AG024904) and DOD ADNI (Department of Defense award number W81XWH-12-2-0012). ADNI is funded by the National Institute on Aging, the National Institute of Biomedical Imaging and Bioengineering, and through generous contributions from the following: AbbVie, Alzheimer's Association; Alzheimer's Drug Discovery Foundation; Araclon Biotech; BioClinica, Inc.; Biogen; Bristol-Myers Squibb Company; CereSpir, Inc.; Cogstate; Eisai Inc.; Elan Pharmaceuticals, Inc.; Eli Lilly and Company; EuroImmun; F. Hoffmann-La Roche Ltd and its affiliated company Genentech, Inc.; Fujirebio; GE Healthcare; IXICO Ltd.;Janssen Alzheimer Immunotherapy Research & Development, LLC.; Johnson & Johnson Pharmaceutical Research & Development LLC.; Lumosity; Lundbeck; Merck & Co., Inc.;Meso Scale Diagnostics, LLC.; NeuroRx Research; Neurotrack Technologies; Novartis Pharmaceuticals Corporation; Pfizer Inc.; Piramal Imaging; Servier; Takeda Pharmaceutical Company; and Transition Therapeutics. The Canadian Institutes of Health Research is providing funds to support ADNI clinical sites in Canada. Private sector contributions are facilitated by the Foundation for the National Institutes of Health (www.fnih.org). The grantee organization is the Northern California Institute for Research and Education, and the study is coordinated by the Alzheimer's Therapeutic Research Institute at the University of Southern California. ADNI data are disseminated by the Laboratory for Neuro Imaging at the University of Southern California.
References
1. Elliott, M. L. et al. Brain-age in midlife is associated with accelerated biological aging and cognitive decline in a longitudinal birth cohort. Mol Psychiatry 26, 3829-3838, doi:10.1038/s41380-019-0626-7 (2021).
2. Cole, J. H. et al. Brain age predicts mortality. Mol Psychiatry 23, 1385-1392, doi:10.1038/mp.2017.62 (2018).
3. Kaufmann, T. et al. Common brain disorders are associated with heritable patterns of apparent aging of the brain. Nat Neurosci 22, 1617-1623, doi:10.1038/s41593-019-0471-7 (2019).
4. Leonardsen, E. H. et al. Deep neural networks learn general and clinically relevant representations of the ageing brain. Neuroimage 256, 119210, doi:10.1016/j.neuroimage.2022.119210 (2022).
5. Gustavsson, A. et al. Global estimates on the number of persons across the Alzheimer's disease continuum. Alzheimers Dement 19, 658-670, doi:10.1002/alz.12694 (2023).
6. (WHO), W.H.O. Dementia, <https://www.who.int/news-room/fact-sheets/detail/dementia> (2023).
7. Diogo, V. S., Ferreira, H. A., Prata, D. & Alzheimer's Disease Neuroimaging, I. Early diagnosis of Alzheimer's disease using machine learning: a multi-diagnostic, generalizable approach. Alzheimers Res Ther 14, 107, doi:10.1186/s13195-022-01047-y (2022).
8. Livingston, G. et al. Dementia prevention, intervention, and care: 2020 report of the Lancet Commission. Lancet 396, 413-446, doi:10.1016/S0140-6736(20)30367-6 (2020).
9.Kane, R. L. et al. in Interventions to Prevent Age-Related Cognitive Decline, Mild Cognitive Impairment, and Clinical Alzheimer's-Type Dementia AHRQ Comparative Effectiveness Reviews (2017).
Figures
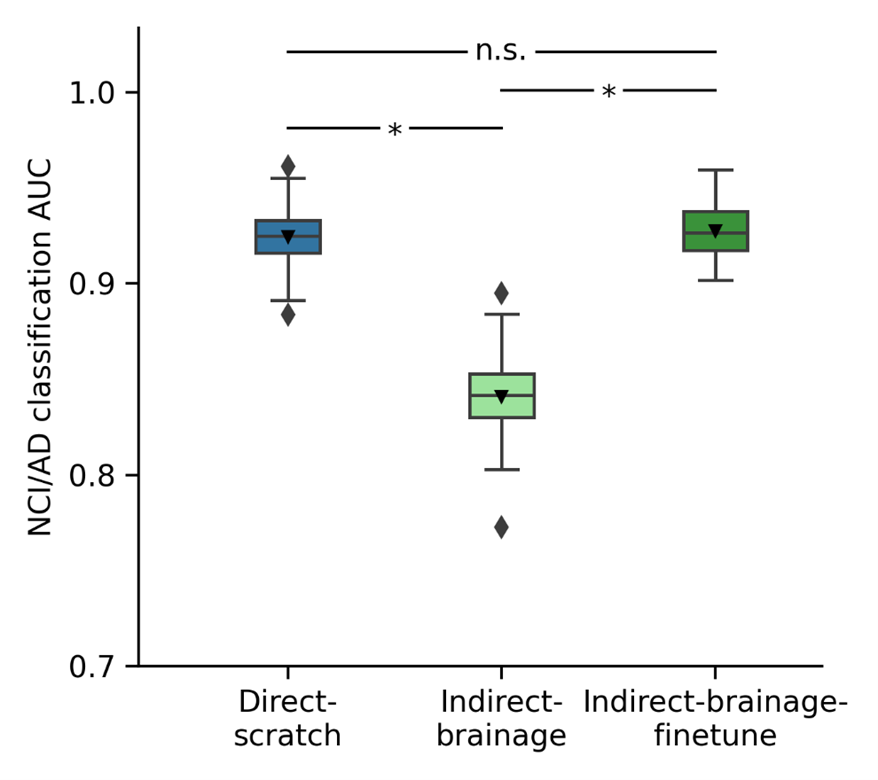
Figure 1. AD diagnosis prediction AUC on test set. Bar plots show the averaged test AUC across 50 repeated data splits, with error bars representing the standard deviation. P values are computed using resampled t-test and are used to compare the significant differences between comparison models. “*” indicates statistical significance (p < 0.05) after FDR correction (q < 0.05) and “n.s.” indicates not significant.
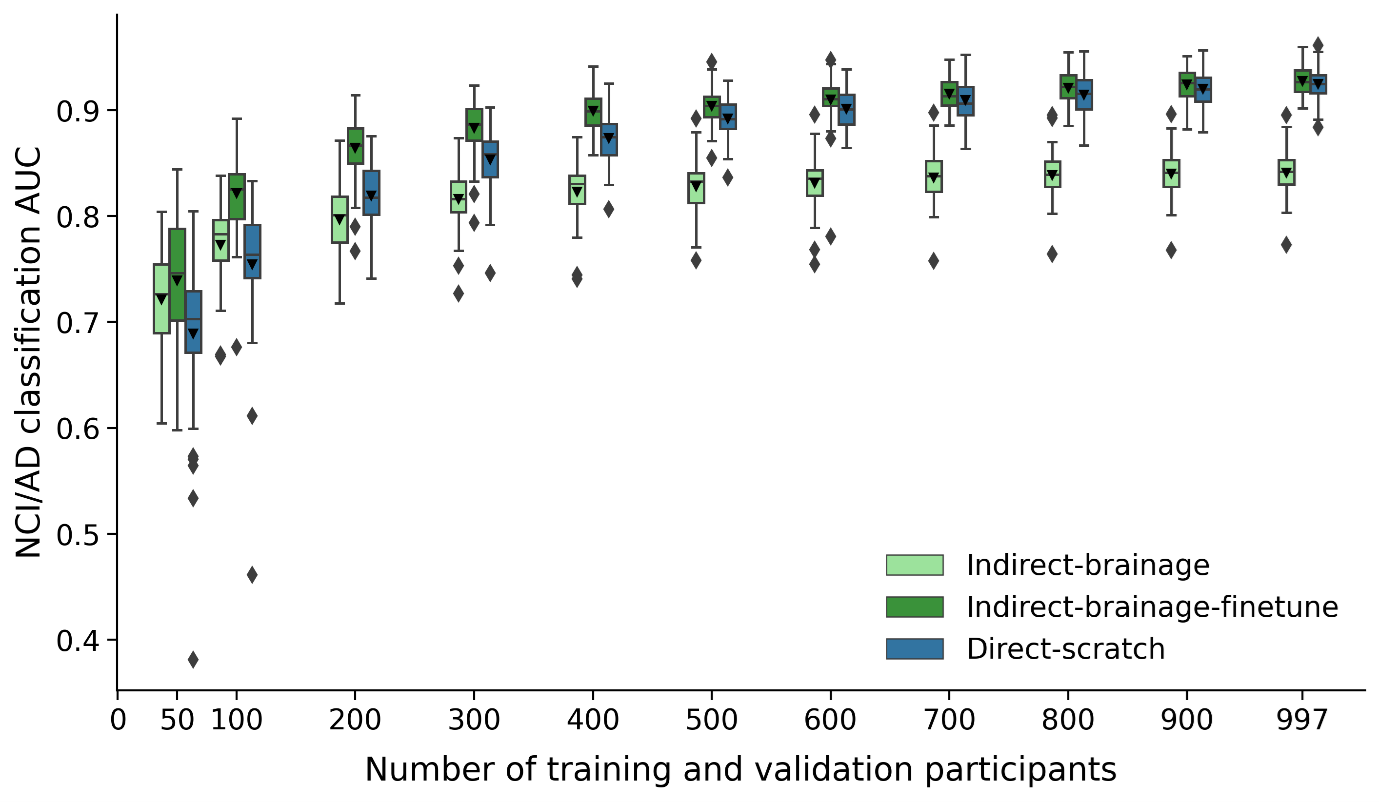
Figure 2. AD diagnosis prediction performance (AUC) of Indirect-brainage, Indirect-brainage-finetune, and Direct-scratch with different number of training and validation participants. Direct-scratch performs significantly better than Indirect-brainage with more than 400 training and validation participants, while Indirect-brainage-finetune achieves similar performance as Direct-scratch across different number of training and validation participants. Box plots show test performance across 50 random repeats of train-validation split.
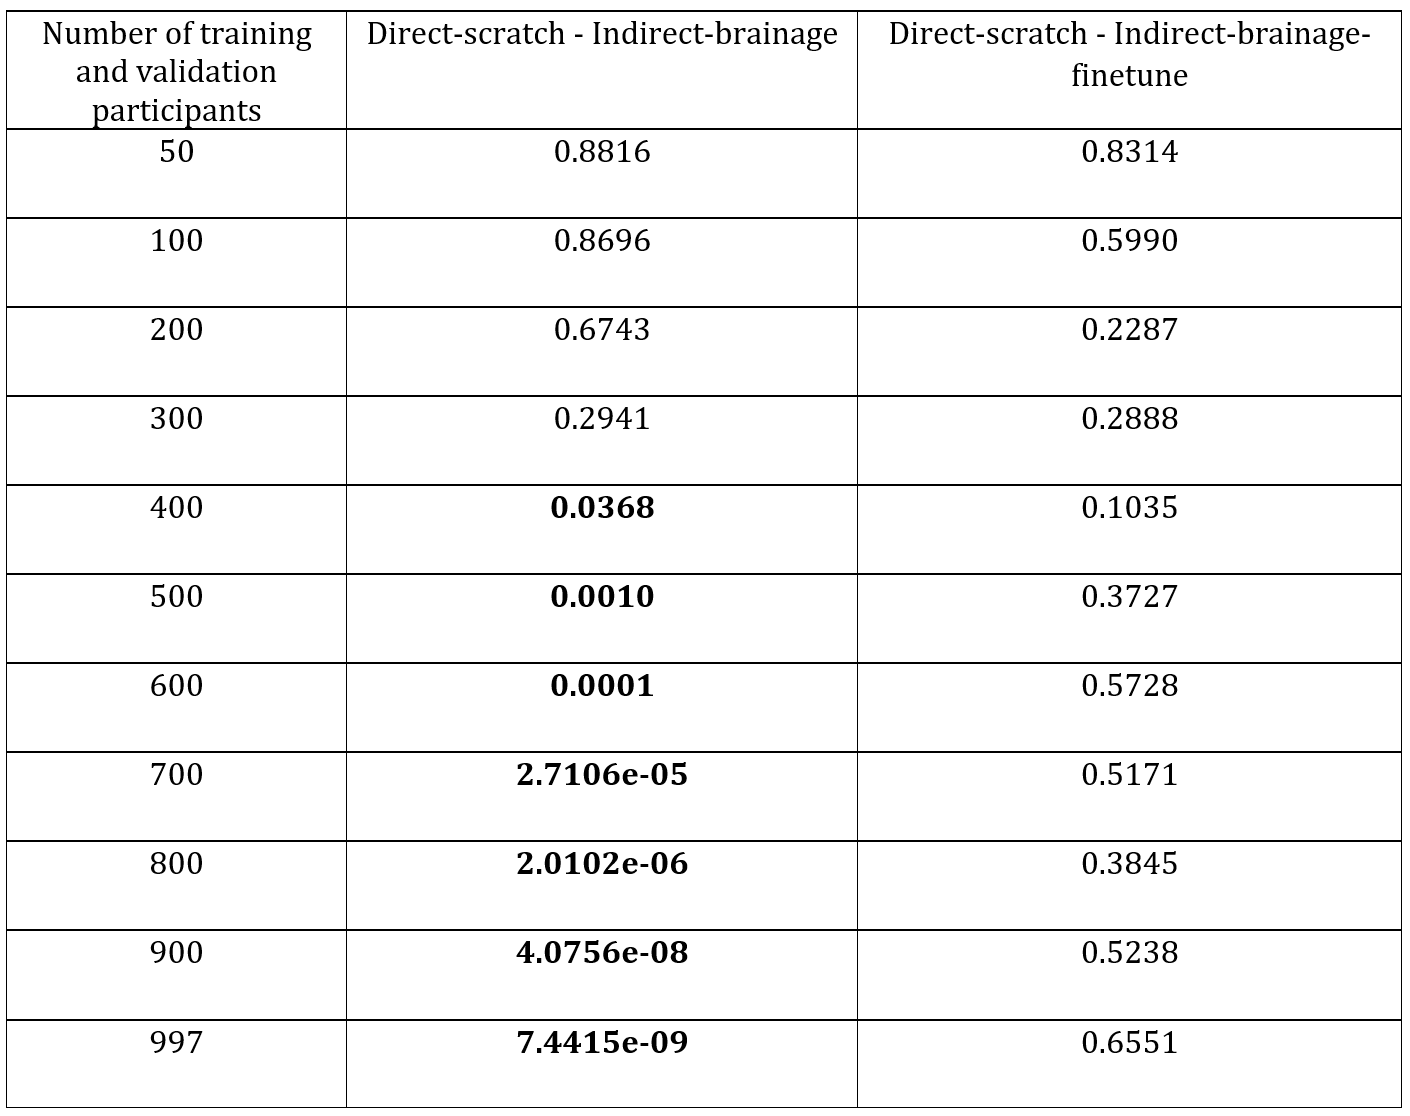
Table 1. Resampled t-test p values between AD classification AUC of direct and each indirect model on test set for at varying number of training and validation participants. At each number of training and validation participants, the data split is repeated 50 times. Bolded p values indicate significant p value (p < 0.05) after FDR correction (q < 0.05). P values of models at the full dataset (number of training and validation participants is 997) are included for comparison.
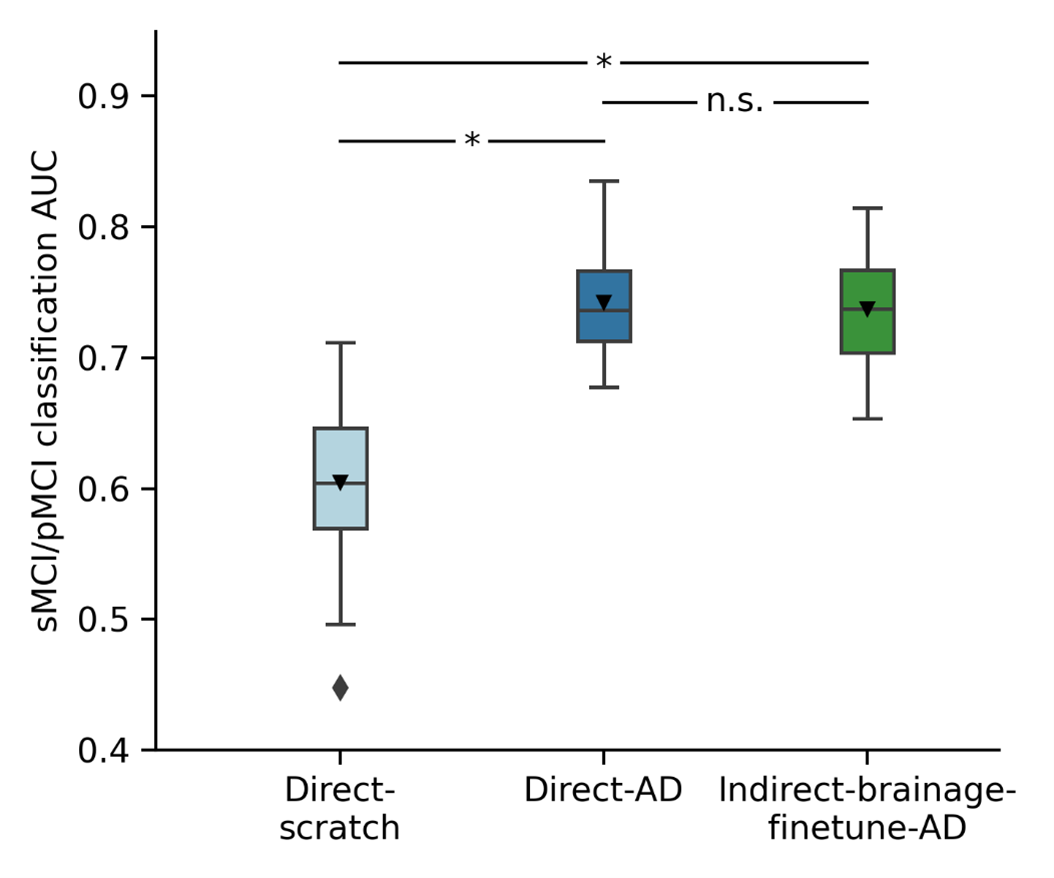
Figure 3. MCI progression prediction AUC on test set. Bar plots show the averaged test AUC across 50 repeated data splits, with error bars representing the standard deviation. P values computed using resampled t-test and used to compare significant differences between comparison models. “*” indicates statistical significance (p < 0.05) after FDR correction (q < 0.05) and “n.s.” indicates not significant. Direct-AD significantly outperforms Direct-scratch. There is no statistically significant difference in performance between Direct-AD and Indirect-brainage-finetune-AD.
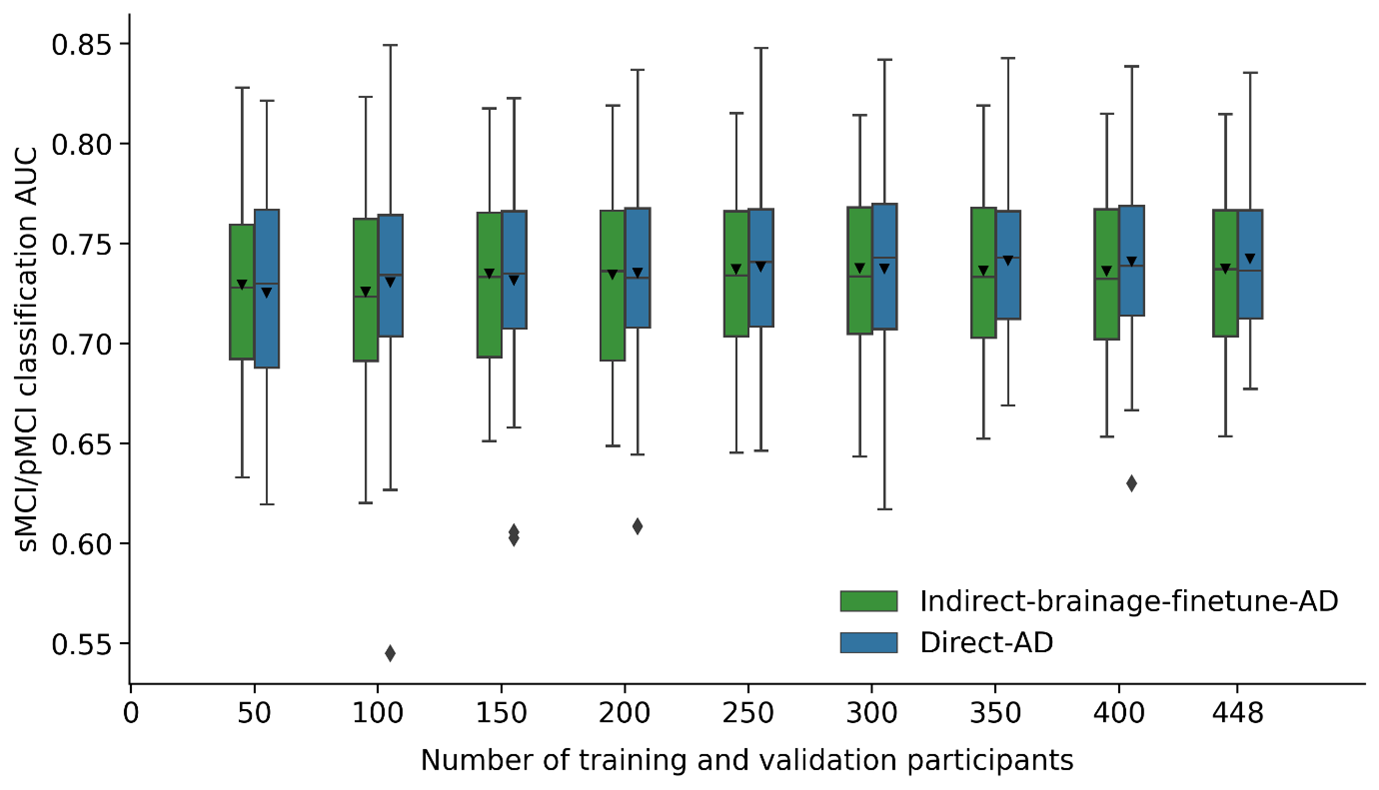
Figure 4. MCI progression prediction performance (AUC) of Indirect-brainage-finetune-AD and Direct-AD across different number of training and validation participants. Test set is the same across different number of training and validation participants. There are no statistically significant differences between Indirect-brainage-finetune-AD and Direct-AD across all numbers of training and validation participants. Box plots show test performance across 50 random repeats of train-validation split.