3890
Longitudinal changes in cerebral metabolic rate of oxygen (CMRO2) in older adults without and with cognitive impairment1Department of Biomedical Engineering, Johns Hopkins University School of Medicine, Baltimore, MD, United States, 2Center for Imaging Science, Whiting School of Engineering, Johns Hopkins University, Baltimore, MD, United States, 3Department of Neurology, Johns Hopkins University School of Medicine, Baltimore, MD, United States, 4The Russell H. Morgan Department of Radiology & Radiological Science, Johns Hopkins University School of Medicine, Baltimore, MD, United States, 5F.M. Kirby Center for Functional Brain Imaging, Kennedy Krieger Institute, Baltimore, MD, United States
Synopsis
Keywords: Aging, Aging
Motivation: Cerebral metabolic rate of oxygen (CMRO2) reflects the brain’s energy consumption and neural function. Longitudinal CMRO2 changes in the aging brain have not been fully characterized.
Goal(s): Our goal was to study longitudinal CMRO2 changes in cognitively normal older adults and examine differences in CMRO2 between participants without and with cognitive impairment.
Approach: CMRO2 was estimated from MRI measurements. Linear mixed effect (LME) models were employed to evaluate the relationship between CMRO2 and the related independent variables.
Results: CMRO2 decreased with age cross-sectionally and increased with follow-up time longitudinally. CMRO2 was lower in cognitively impaired participants compared to cognitively normal participants.
Impact: The present work revealed a bell-shaped trajectory of CMRO2 in aging. CMRO2 may also be a promising biomarker of neurogenerative diseases.
Introduction
Cerebral metabolic rate of oxygen (CMRO2) denotes the amount of O2 that the brain consumes. Due to the scarcity and complexity of techniques to measure CMRO2 in humans (e.g., 15O-PET), longitudinal changes in CMRO2 have not been fully characterized. Using an MRI-based global CMRO2 technique, the present study reports CMRO2 changes in older adults from a total of 544 measurements, the largest CMRO2 dataset to date. We examined longitudinal and cross-sectional CMRO2 levels in the aging brain, as well as their dependence on the apolipoprotein E4 (APOE4) genotype. We also performed the analysis on two related physiological parameters, cerebral blood flow (CBF) and cerebral oxygen extraction fraction (OEF). In addition, we examined the difference in CMRO2 between cognitively normal and impaired participants.Methods
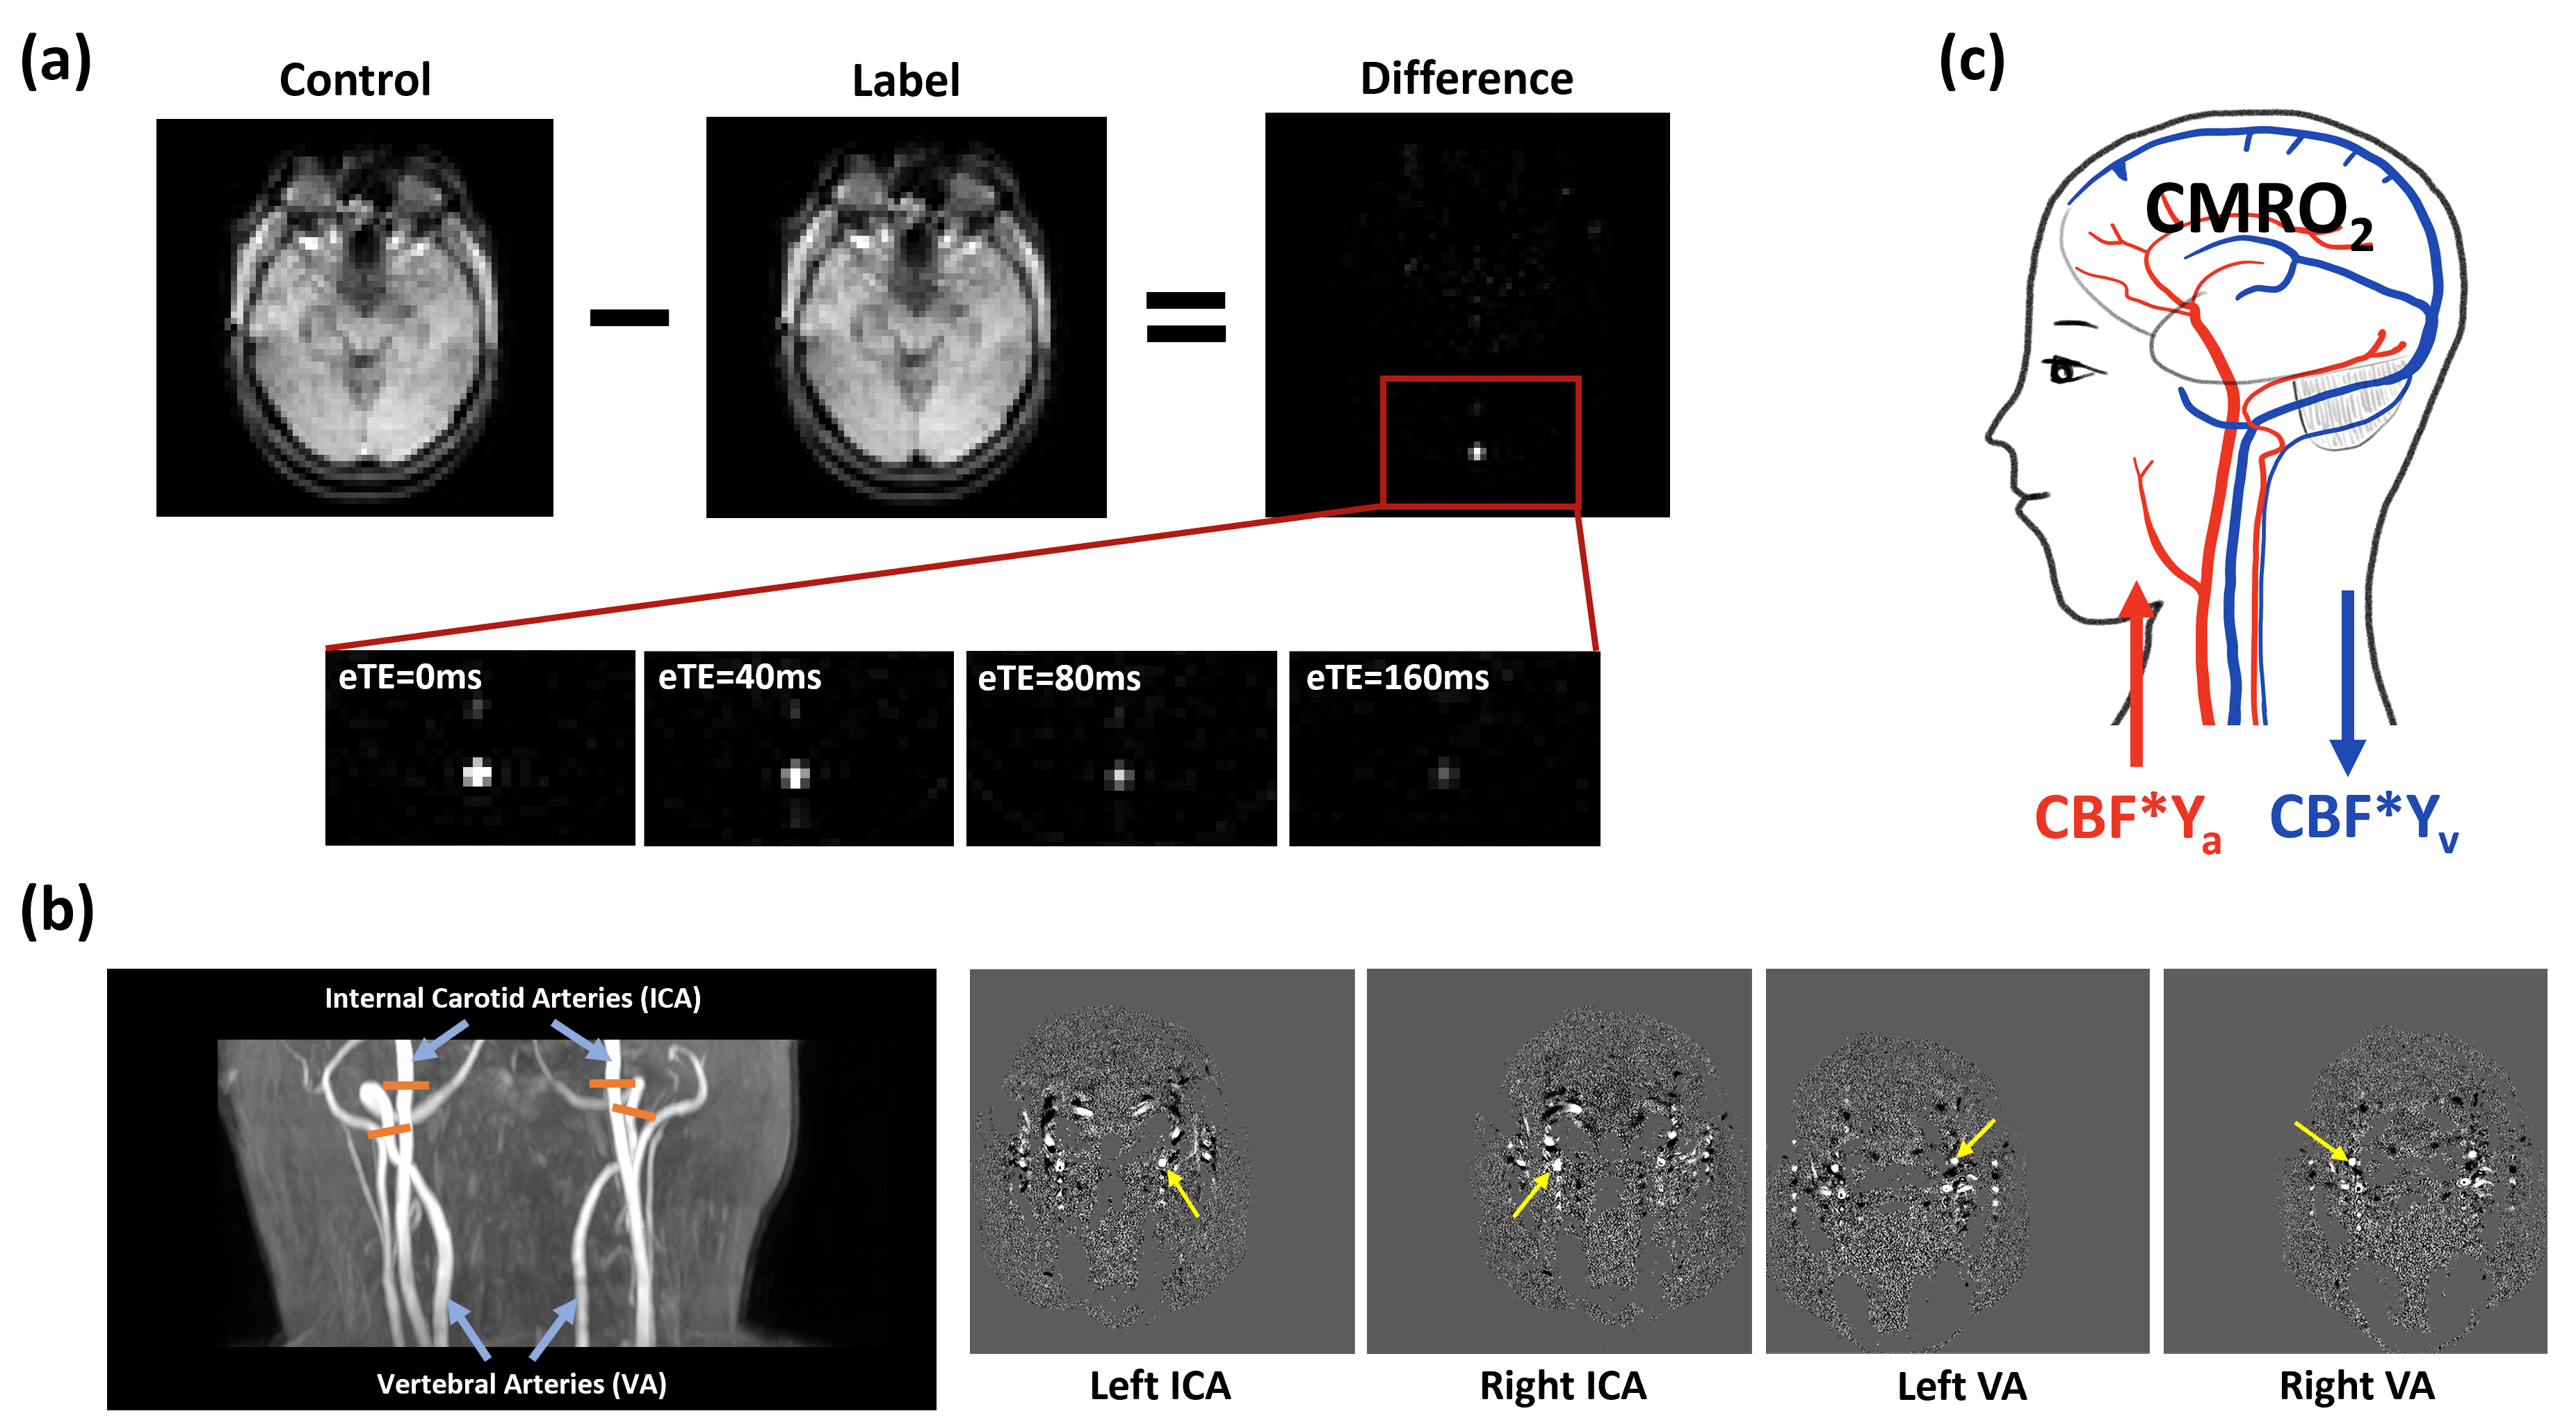
Experimental procedure: The participants in this study were part of the Biomarkers for Older Controls at Risk for Dementia (BIOCARD) cohort. A total of 174 participants with normal cognition and 55 cognitively impaired individuals (either mild cognitive impairment or dementia), aged 50 to 92 years old, were included in these analyses. Each participant was scanned on a 3T MRI (Philips) approximately every two years. On average, participants had 2.4 scans (range = 1-4) collected over 3.3 years of follow-up. Figure 1 shows the illustration of CMRO2 estimation from the arterio-venous difference in oxygen content1-2, i.e., CMRO2 = CBF*(Ya-Yv)*Ch, where Yv was the venous oxygenation measured by T2-Relaxation-Under-Spin-Tagging (TRUST)3-4, CBF was measured with phase-contrast MRI applied on the four feeding arteries of the brain5. Ya, the arterial oxygenation, was assumed to be 98%. Ch is the oxygen-carrying capacity of the blood. OEF was calculated as (Ya−Yv)/Ya.Data analysis: Linear mixed effect (LME) models were used to study cross-sectional and longitudinal alterations in aging.
Results and Discussion
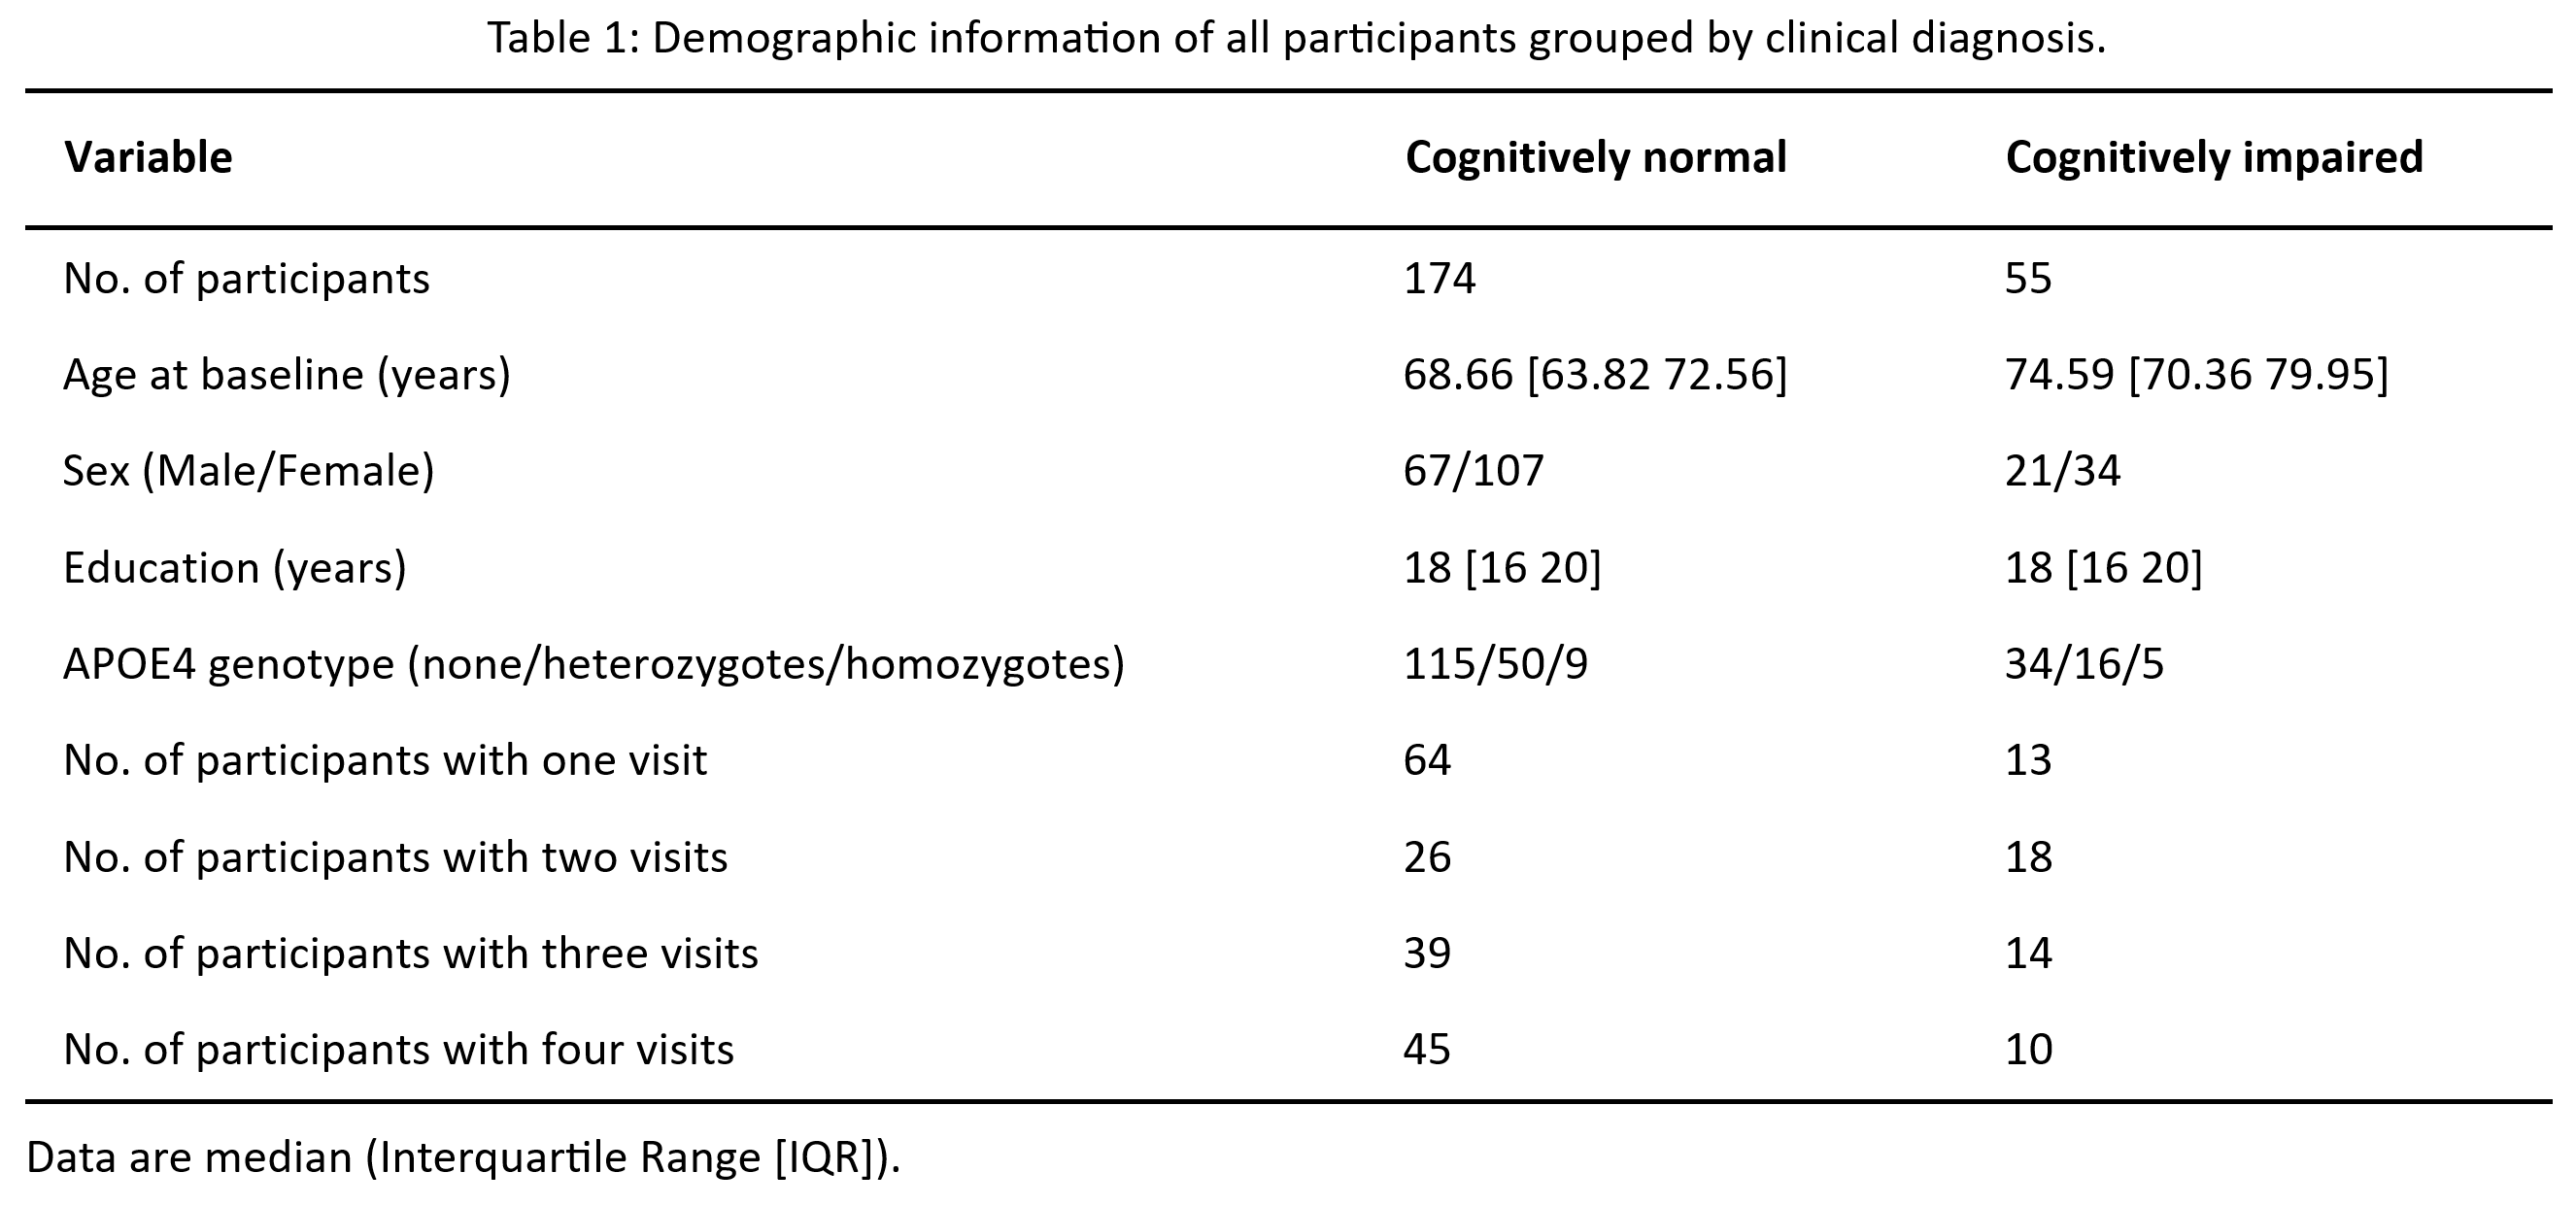
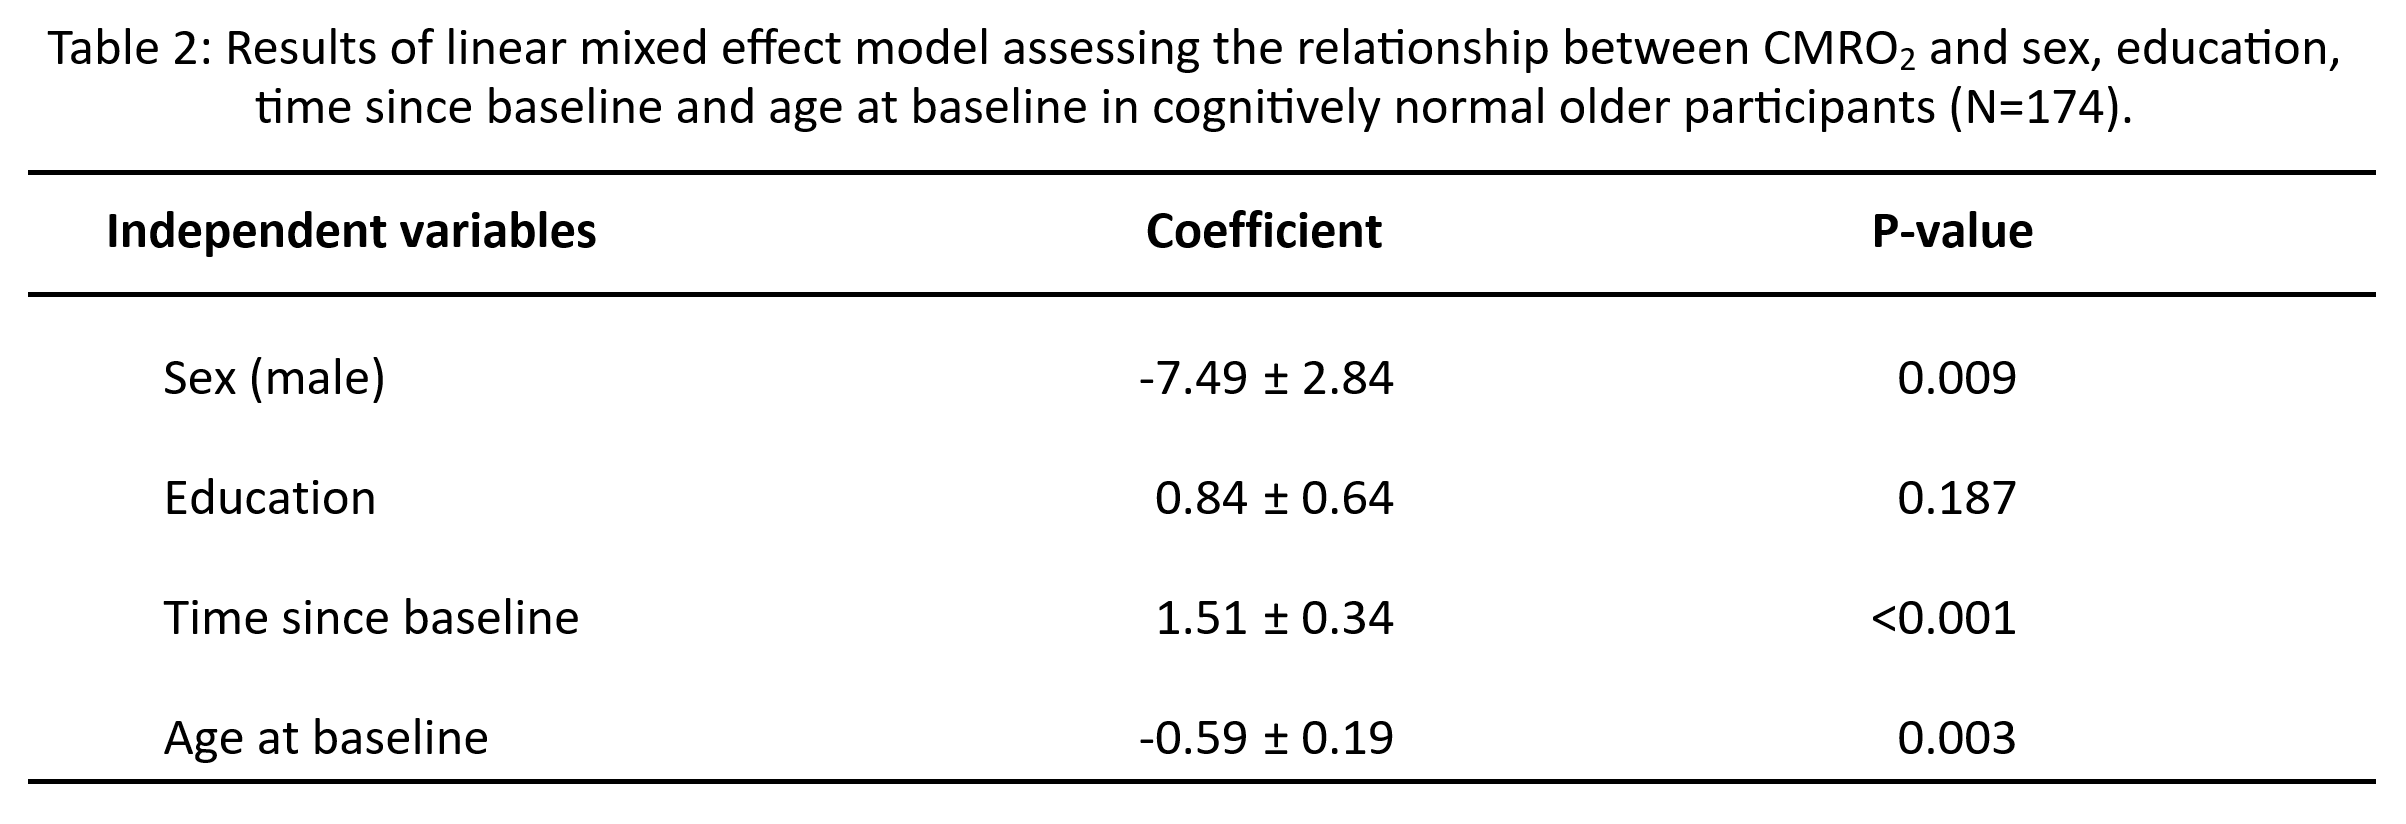
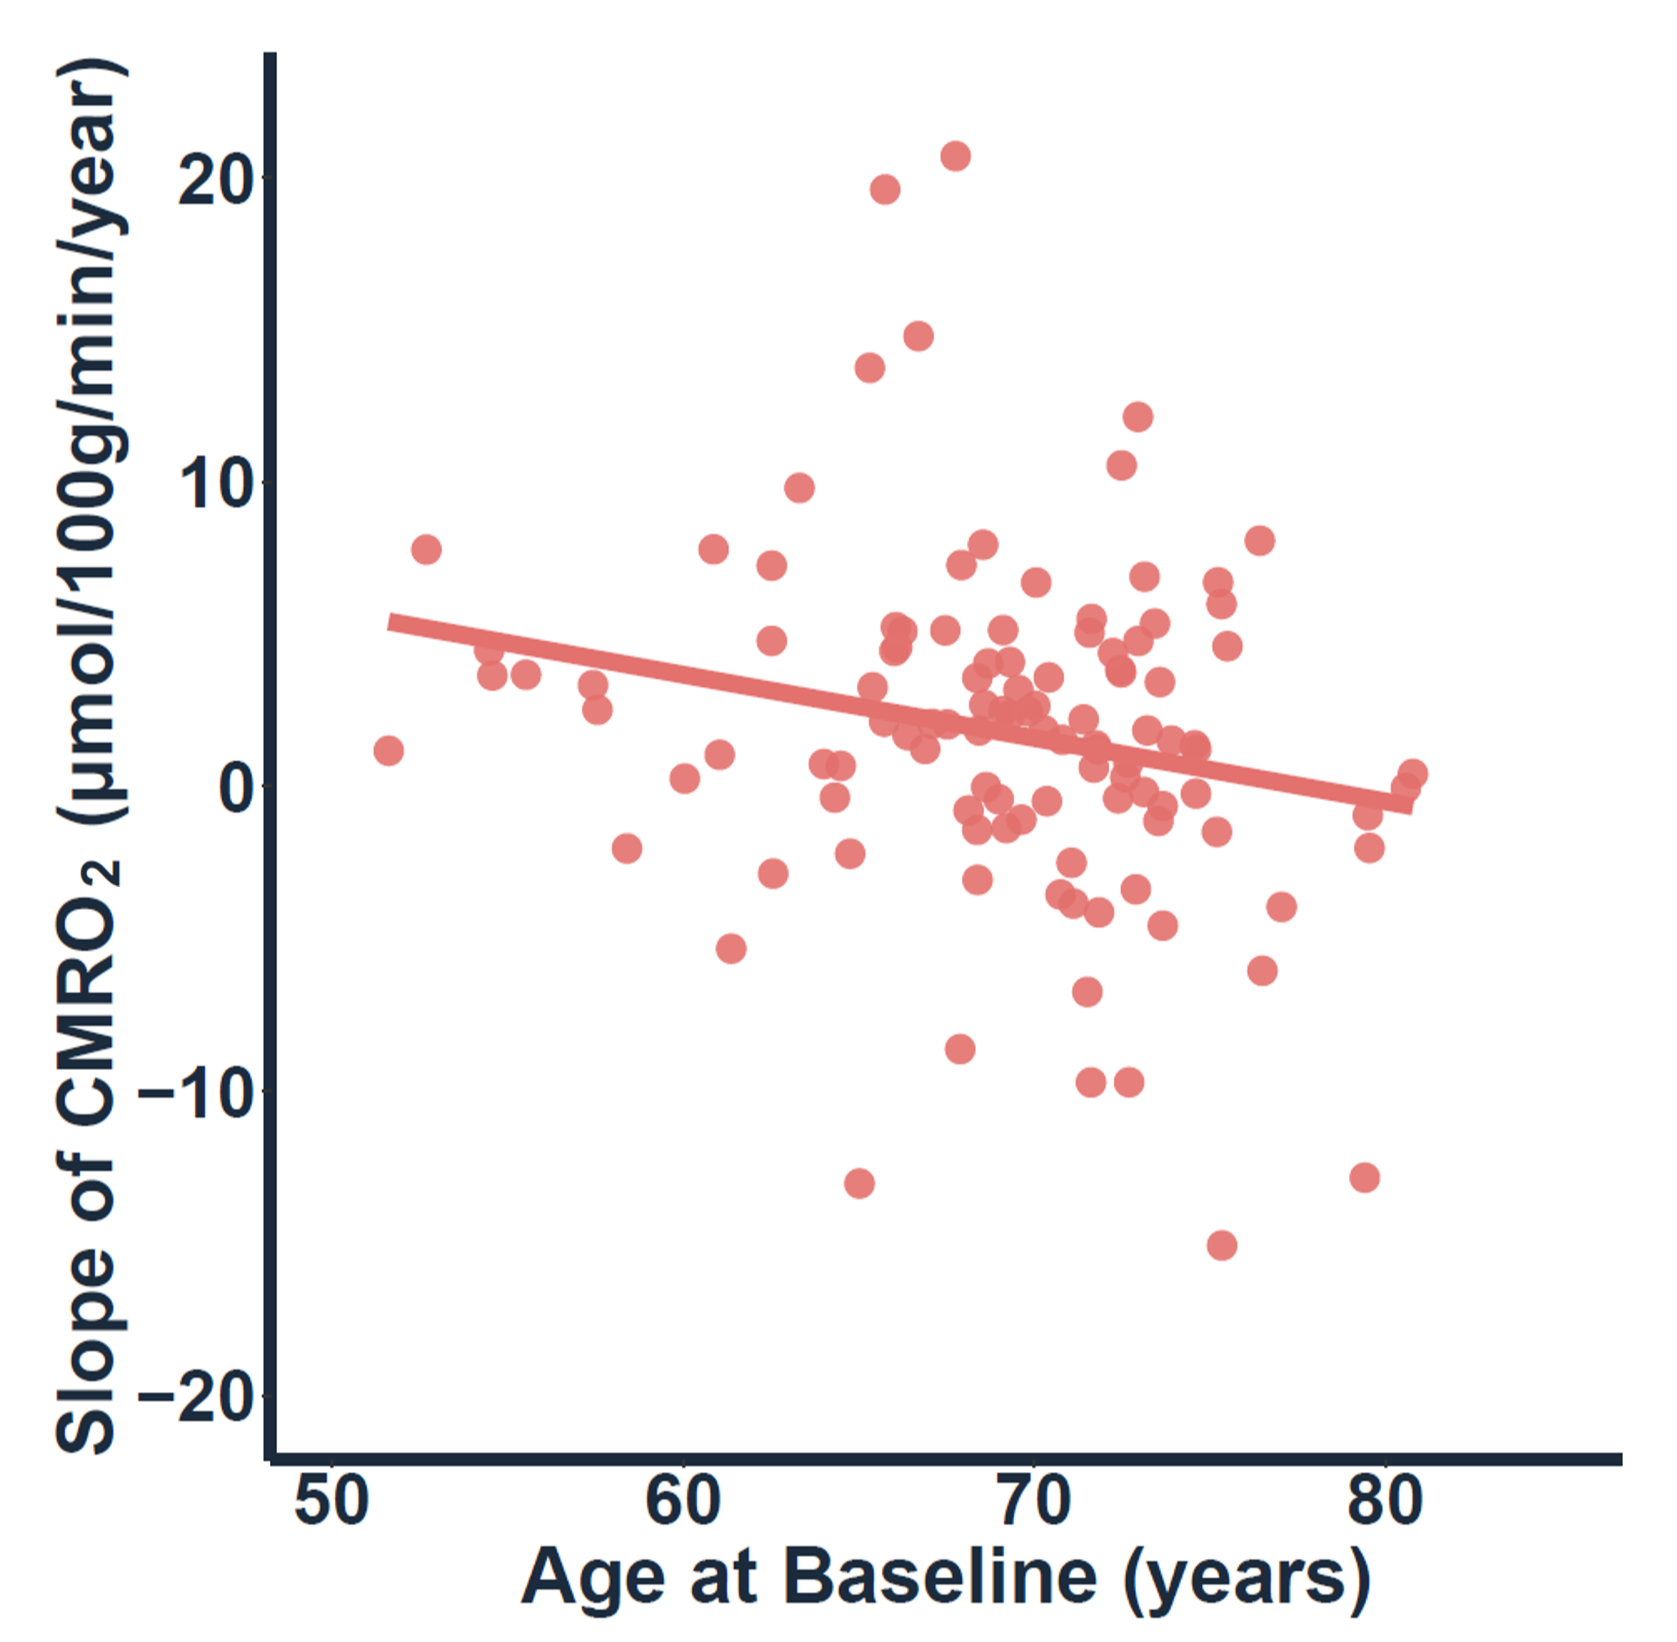
Table 1 summarizes the demographic and clinical information of the participants. Table 2 shows the results of the LME model, examining changes in CMRO2 among individuals with normal cognition. Longitudinally, there was an increase in CMRO2 with time (p<0.001), suggesting that the brain is “working harder” to compensate for its lower efficiency. There was also an effect of baseline age on CMRO2 (p=0.003). From the fifties to the eighties, there was a general effect of decreasing CMRO2 cross-sectionally, which may be related to the brain running out of compensatory capacity and showing signs of neurodegeneration. Note that the longitudinal follow-up time is on the order of 2-6 years, which is much shorter than the cross-sectional age range (~30 years). Therefore, the cross-sectional and longitudinal observations are not necessarily contradictory, because they are reporting CMRO2 changes at different time spans.The above findings suggest that CMRO2 changes in aging are bell-shaped, rather than monotonic. To further investigate this question, we examined baseline age as a predictor of the slope of the CMRO2 change (in μmol/100g/min/year). We found an age-dependence of the CMRO2 slope (p=0.02). Specifically, older adults less than the age of 75 years old tend to show a time-increase in CMRO2 whereas those at more advanced age tend to show a time-decrease in CMRO2 (Figure 2).
Next, we studied the effect of APOE4 on brain physiological parameters, including CMRO2, OEF, and CBF among cognitively normal participants. The number of APOE4 alleles (coded 0,1,2) was associated with OEF (coefficient=-1.5, p=0.02), but not with CMRO2 or CBF (both p>0.05). When only including noncarriers and participants with one APOE4 allele (i.e., heterozygotes), we did not observe any association between APOE4 carrier status and the three parameters. However, when including noncarriers and participants with two E4 alleles (i.e., homozygotes), the homozygotes had lower OEF and higher CBF compared to noncarriers (p=0.02, p=0.04, respectively), indicating that brain physiological alterations by APOE4 are most pronounced in homozygotes. These findings also suggest that the decrease of OEF in APOE4 carriers is mainly caused by the increase of blood supply rather than an alteration of oxygen consumption.
With 55 cognitively impaired participants included in the LME model, the diagnosis category (coded 0 for normal cognition and 1 for cognitive impairment) was negatively associated with CMRO2 (coefficient=-7.3, p=0.02). In other words, CMRO2 was lower in cognitively impaired participants than those with normal cognition. This finding indicates that CMRO2 is sensitive in detecting neurodegeneration.
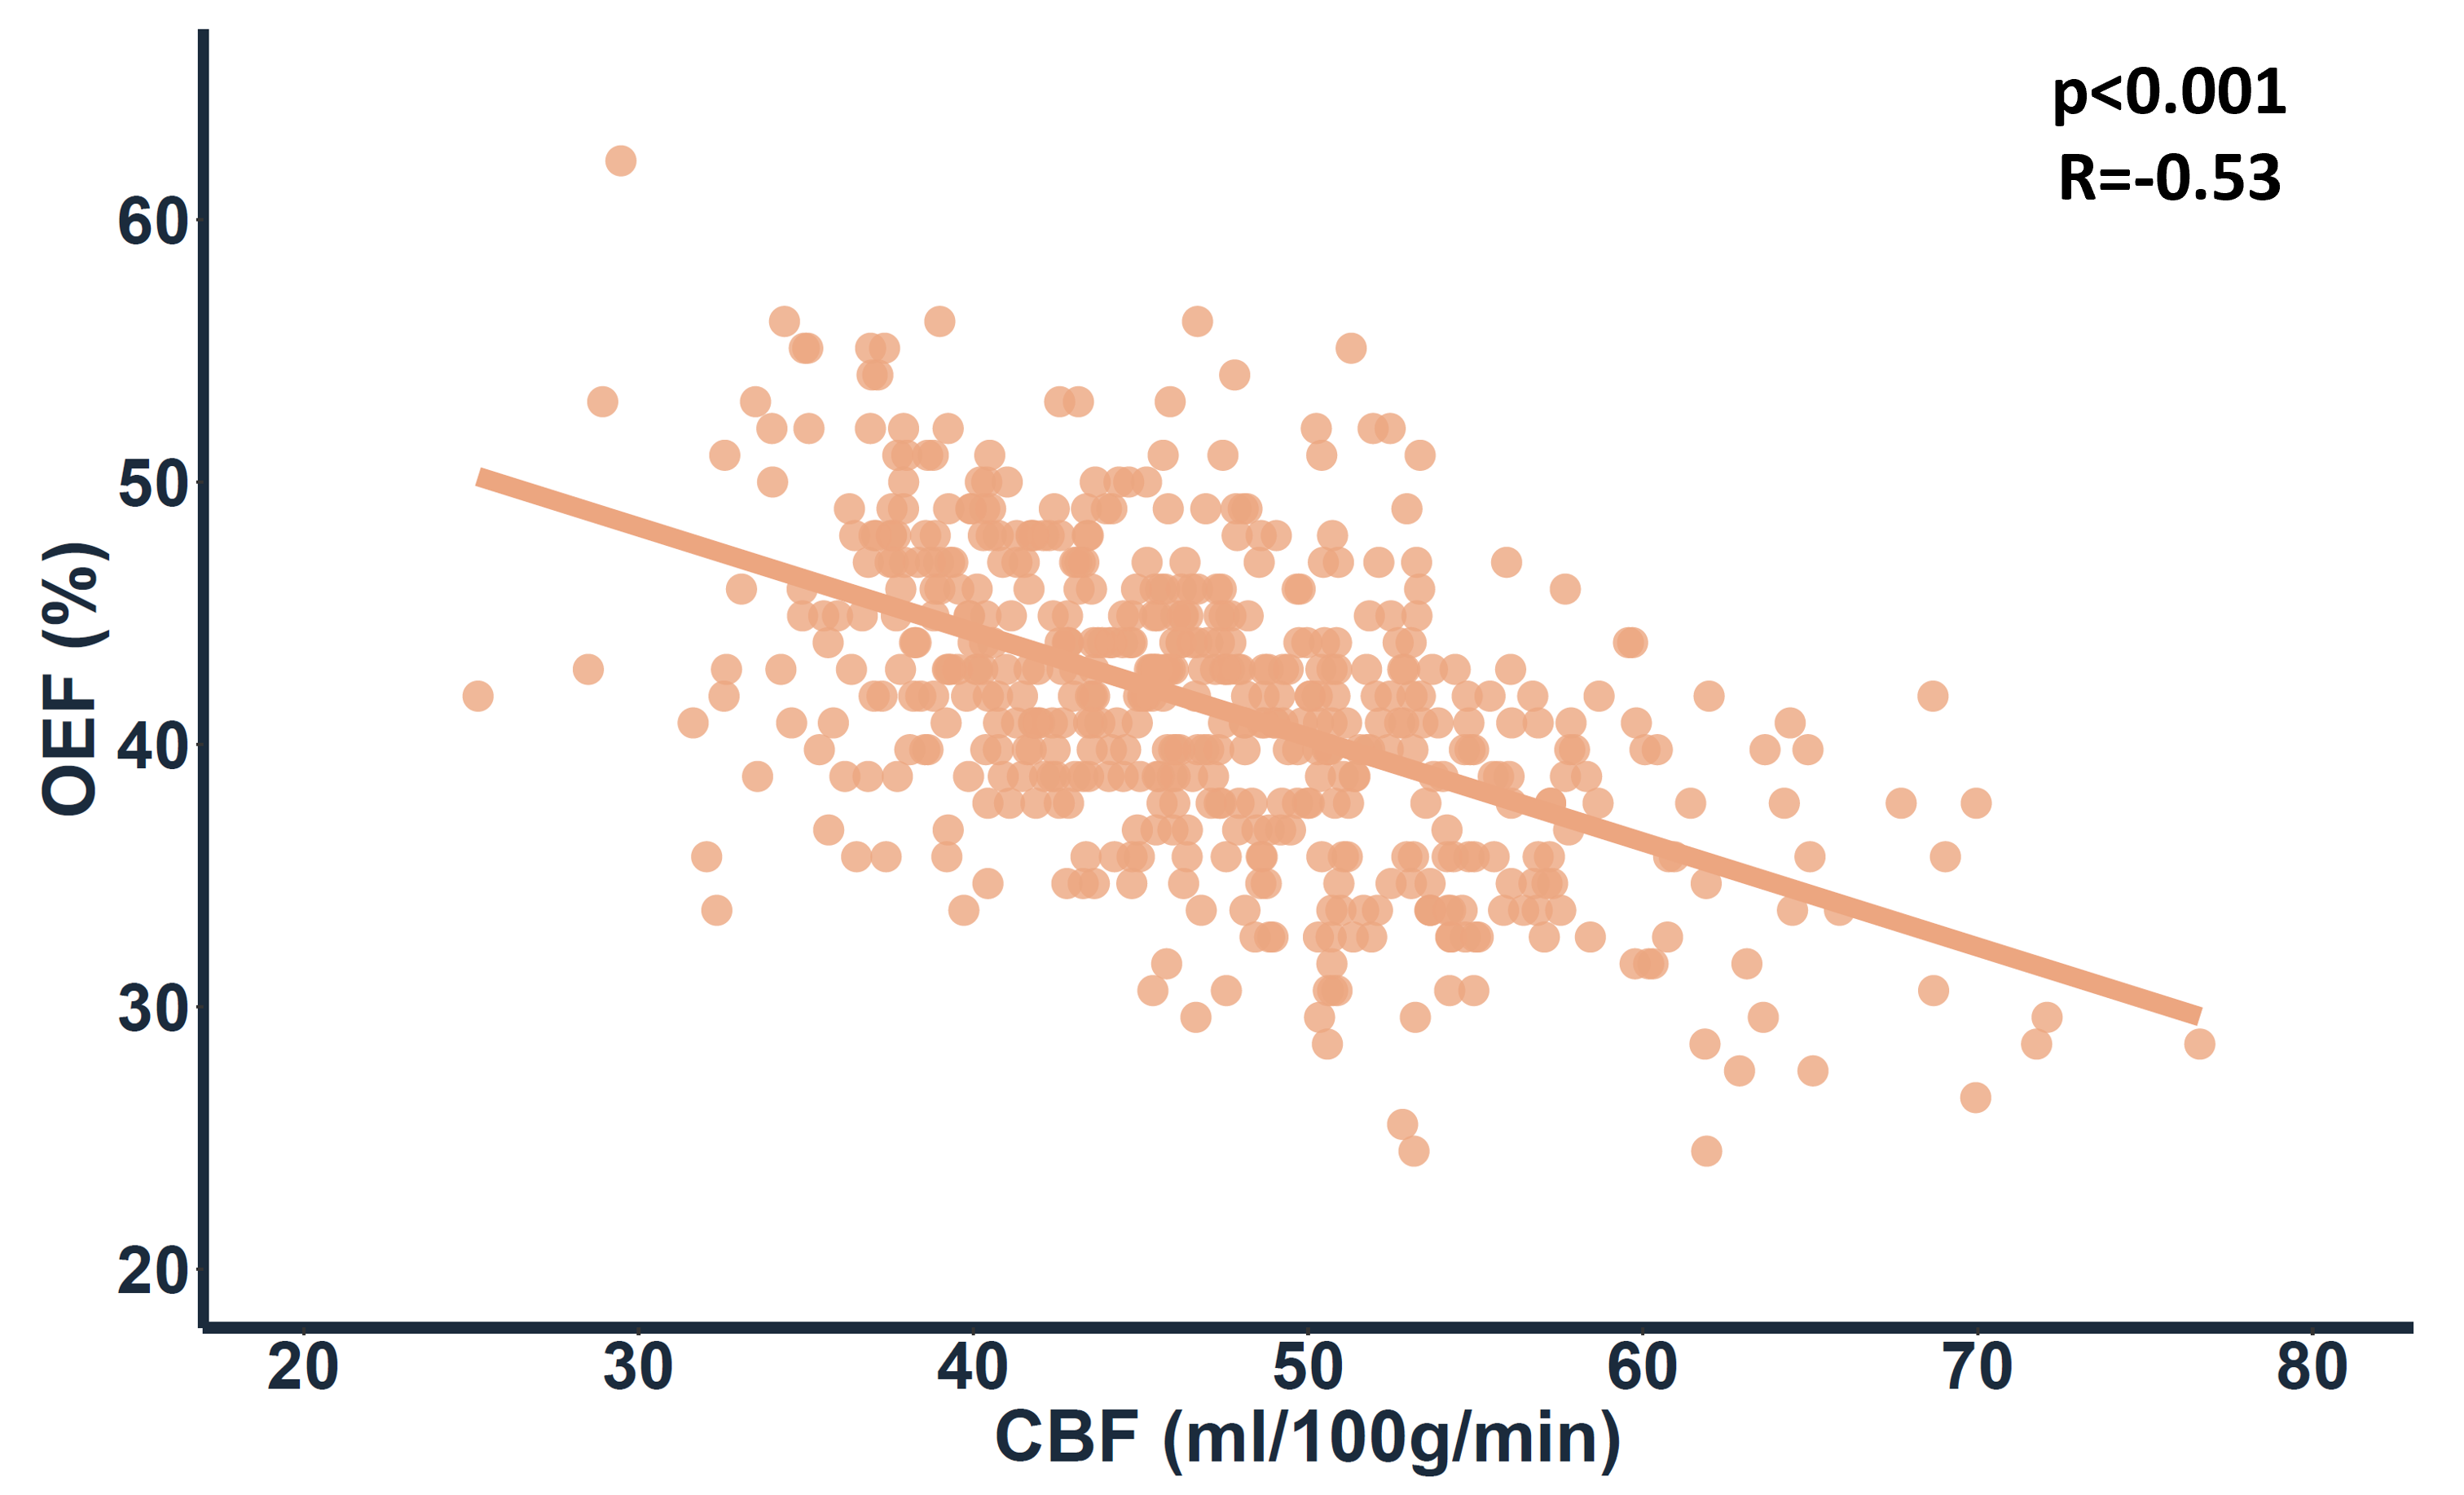
Additionally, from a basic physiology point-of-view, we aimed to understand the relationship between CBF and OEF. We examined the correlation between CBF and OEF (Figure 3). A strong negative association was observed (R=-0.53, p<0.001).
Conclusion
This study suggests CMRO2 may follow a “bell-shaped” curve in the aging brain, and indicates that CMRO2 may be a useful biomarker of neural efficiency in neurodegenerative diseases.Acknowledgements
No acknowledgement found.References
- Lu H, Xu F, Rodrigue KM, et al. Alterations in cerebral metabolic rate and blood supply across the adult lifespan. Cereb Cortex. 2011;21:1426-1434.
- Thomas BP, Sheng M, Tseng BY, et al. Reduced global brain metabolism but maintained vascular function in amnestic mild cognitive impairment. J Cereb Blood Flow Metab. 2017;37(4):1508-1516.
- Lu H, Ge Y. Quantitative evaluation of oxygenation in venous vessels using T2-relaxation-under-spin-tagging MRI. Magn Reson Med. 2008;60(2): 357-363.
- Lu H, Xu F, Grgac K, et al. Calibration and validation of TRUST MRI for the estimation of cerebral blood oxygenation. Magn Reson Med. 2012;67(1): 42-49.
- Liu P, Xu F, Lu H. Test-retest reproducibility of a rapid method to measure brain oxygen metabolism. Magn Reson Med. 2013;69(3):675-681.
Figures