3885
Metabolic and vascular aspects of the ageing brain correlated with age, gender, lifestyle and intelligence1INM-4, Research Centre Juelich, Juelich, Germany, 2Department of Biomedical Engineering, The State University of New York at Buffalo, Buffalo, NY, United States, 3INM-1, Research Centre Juelich, Juelich, Germany, 4Institute for Anatomy I, Medical Faculty & University Hospital Düsseldorf, Heinrich Heine University Düsseldorf, Germany, Düsseldorf, Germany, 5Department of Biomedical Engineering, Cornell University, Ithaca, NY, United States, 6Department of Radiology, Weill Cornell Medical College, New York, NY, United States, 7RWTH Aachen University, Aachen, Germany, 8INM-11, JARA, Research Centre Juelich, Juelich, Germany, 9JARA - BRAIN - Translational Medicine, Aachen, Germany
Synopsis
Keywords: Aging, Metabolism, CMRO2, perfusion, gender aspects, IQ, lifestyle, multi-contrast, oxygen extraction fraction
Motivation: Metabolic aspects of brain ageing and normal functioning in the elderly, especially gender-specific, are still insufficiently understood. Lifestyle influences are thought important, but proper quantification of their effect is pending.
Goal(s): To investigate correlations between metabolic function, age and lifestyle.
Approach: Brain oxygen metabolism reflected by CMRO2 and OEF as well as circulatory aspects (CBF and venous blood fraction) are measured by MRI in an elderly cohort characterised by lifestyle and IQ information.
Results: Gender-specific correlations between metabolism/circulation and age, lifestyle and IQ are found. Their differences suggest different adaptation mechanisms of men and women to the challenges of ageing.
Impact: Metabolic and circulatory parameters of the ageing brain show correlations with gender and lifestyle, besides age. Gender differences, strongest in OEF, are attributed to effects of menopause and different adaptation mechanisms. We find correlations of IQ with metabolism and circulation.
Introduction
The human brain consumes about 20% of the total energy, although it only accounts for 2% of the total body weight1, and requires oxygen to maintain neural activity. The cerebral metabolic rate of oxygen consumption (CMRO2) is thus an important index for brain function2. In the context of brain aging, earlier studies based on PET reported decreasing resting CMRO2 in older subjects3,4, whereas age-related increase of resting metabolic rate in the human brain was reported by MRI5. The exact relationship between CMRO2 and age thus warrants further examination. With age, many aspects of the brain structure undergo a pronounced decline, but there appear to be several compensatory mechanisms in brain aging allowing normal functioning of many individuals. In a preliminary study6, we found pronounced gender differences in regional and whole-brain oxygen extraction fraction (OEF), attributed to the onset of menopause in the elderly female population. Below we extend this investigation to the influence of age, gender and lifestyle factors on region-specific metabolic (CMRO2, OEF) and circulatory aspects (cerebral blood flow CBF, venous blood fraction v) using data acquired from a subset of the population-based cohort 1000BRAINS7,8. Correlations between these parameters and an intelligence quotient obtained from a mini-IQ-test (Wechsler equivalent) are reported.Materials and Methods
146-volunteers (male/female 83/63, mean age 65.5+-10.9 years) were investigated with an extensive multiparametric quantitative protocol6,13-15 at a 3T Siemens scanner. OEF and v were derived from the magnitude and phase data of the single a 3D multi-echo gradient echo acquisition (TR=50ms, 7deg, 18 echoes, 1x1x2mm3, TA=4min:30s) using the QQ-CC-TV method 9-12. CBF was measured using a pcASL protocol validated against PET16. Data on four lifestyle variables - physical activity, social integration, alcohol consumption and smoking - were combined in a lifestyle risk factor8, shown to correlate with differences in gyrification index and resting state functional connectivity in the full 1000BRAINS cohort8. Given our previous findings6 of gender-related differences, we investigate correlations between different parameters separately for each gender.Brain parcellation was done with Freesurfer and statistical analysis using python and Matlab.
P-values below 0.05 were considered significant. Multiple comparison corrections were not included in the analysis at this stage.
Results and Discussion
Representative maps of the metabolic and vascular parameters are shown in Fig.1. Distinct cortical and subcortical regional distributions are visualized in Fig.2.Strong correlations between CBF and OEF at the whole-brain and regional level were found for both men and women, confirming previous reports5.
IQ and lifestyle risk factor were not significantly correlated in neither male nor female participants (age used as a covariate); both showed a trend of decreasing with age. The male and female volunteers had similar age distributions assessed with a Kolmogorov-Smirnoff test (65.7f, 65.1m), but slightly different IQ distributions (mean 107m, 102f) and risk scores (mean -0.8m, -1.8f).
As previously reported6, OEF was significantly reduced in the female population, compared to the male one. Since mean age in our cohort was much above the average menopausal age (51 y), the effect might be due to a decline after menopause in cellular machinery responsible for oxidative metabolism, such that the cells cannot enhance their oxygen metabolic rate even though blood oxygen is available5.
The fraction of venous blood shows negative correlations with age, higher in females, but for fewer ROIs than in males. Gender aspects are shown for CBF in Fig. 3.
The different impact of age and lifestyle risk score on the investigated parameters is illustrated in Fig.4a by their p-values for correlations with OEF, CMRO2 and CBF for both genders. Judging from the number of ROIs with significant correlations, lifestyle is a substantially better correlate than age for OEF (women 98 vs 0, men 184 vs 18), age is better for CMRO2 for women only (9 vs 20; no significant correlations for men), whereas CBF, apart from gender differences, only correlates with age (women 74, men 109 ROIs). Fig. 4b illustrates the trend of the correlations (whether significant of not), which is different between male and female participants, possibly indicating different adaptation mechanisms to cha(lle)nges met during ageing.
Several ROIs and parameters showed significant correlations with IQ (age as a covariate). Fig. 5 illustrates the distribution of ROIs showing this effect for OEF, for which the correlation is mainly due to female participants and is mainly positive. CBF and CMRO2 show negative correlations with IQ for both sexes.
Conclusions
Circulatory aspects are more influenced by age than metabolic ones, which are found to correlate with gender and lifestyle in the elderly. The metabolic age of the brain reflects more than the number of life years.Acknowledgements
No acknowledgement found.References
[1] D. Attwell, S.B. Laughlin An energy budget for signaling in the grey matter of the brain
J. Cereb. Blood Flow Metab., 21 (2001), pp. 1133-1145
[2] R.B. Buxton. Introduction to Functional Magnetic Resonance Imaging: Principles and Techniques. Cambridge Univ, Press, Cambridge, UK (2002)
[3] Aanerud, P. Borghammer, M.M. Chakravarty, K. Vang, A.B. Rodell, K.Y. Jonsdottir, A. Moller, M. Ashkanian, M.S. Vafaee, P. Iversen, P. Johannsen, A. Gjedde. Brain energy metabolism and blood flow differences in healthy aging.J. Cereb. Blood Flow Metab., 32 (2012), pp. 1177-1187
[4] M. Ibaraki, Y. Shinohara, K. Nakamura, S. Miura, F. Kinoshita, T. Kinoshita. Interindividual variations of cerebral blood flow, oxygen delivery, and metabolism in relation to hemoglobin concentration measured by positron emission tomography in humans. J. Cereb. Blood Flow Metab., 30 (2010), pp. 1296-1305
[5] Peng SL, Dumas JA, Park DC, Liu P, Filbey FM, McAdams CJ, Pinkham AE, Adinoff B, Zhang R, Lu H. Age-related increase of resting metabolic rate in the human brain. Neuroimage. 2014 Sep;98:176-83. doi: 10.1016/j.neuroimage.2014.04.078.
[6]
A.M. Oros-Peusquens, L. Hau, J. Cho, N. Bittner,
S. Caspers, Y. Wang, and N.J. Shah. Pronounced gender and lifestyle effects in
the oxygen extraction fraction (OEF) of the ageing brain. Proc.Intl.Soc.Magn.Reson.Med.
2023, abstract
nr. 1303.
[7] Caspers, S. et al. Studying variability in human brain aging in a population-based German cohort-rationale and design of 1000BRAINS. Front. Aging Neurosci. 6, 149 (2014).
[8] Bittner, N., Jockwitz, C., Mühleisen, T.W. et al. Combining lifestyle risks to disentangle brain structure and functional connectivity differences in older adults. Nat Commun 10, 621 (2019). https://doi.org/10.1038/s41467-019-08500-x
[9] Cho J, Kee Y, Spincemaille P, et al. Cerebral metabolic rate of oxygen (CMRO2) mapping by combining quantitative susceptibility mapping (QSM) and quantitative blood oxygenation level-dependent imaging (qBOLD). Magn Reson Med.2018;80:1595-1604
[10] Cho J, Zhang S, Kee Y, et al. Cluster analysis of time evolution (CAT) for quantitative susceptibility mapping (QSM)and quantitative blood oxygen level-dependent magnitude (qBOLD)-based oxygen extraction fraction (OEF) and cerebral metabolic rate of oxygen (CMRO2) mapping.Magn Reson Med.2020;83:844-857.
[11] Cho J, Spincemaille P, Nguyen TD, Gupta A,Wang Y. Temporal clustering, tissue composition, and total variation for mapping oxygen extraction fraction using QSM and quantitative BOLD. Magn Reson Med. 2021;86:2635-2646. doi:10.1002/mrm.28875
[12] Cho J, Lee J, An H, et al. Cerebral oxygen extraction fraction (OEF): comparison of challenge-free gradient echo QSM+qBOLD (QQ) with 15O PET in healthy adults. J Cereb Blood Flow Metab 2021; 41: 1658–1668.
[13] A.M. Oros-Peusquens, J. Kielmann, N.J. Shah. The ageing quantitative brain: a multiparametric qMRI study. Proc.Intl.Soc.Magn.Reson.Med. 2021, abstract nr. 262
[14] J.Kielmann, A.M. Oros-Peusquens, N. Bittner, S. Caspers, N.J. Shah. Asymmetries in the distribution of quantitative MRI parameters in the brain. Proc.Intl.Soc.Magn.Reson.Med. 2021, abstract nr. 3067
[15] A.M. Oros-Peusquens, L. Hau, N.J. Shah. Iron, myelin and cortical brain ageing: investigating correlations between QSM, R2, R2* and R2'. Proc.Intl.Soc.Magn.Reson.Med. 2022, abstract nr. 1526
[16] Zhang K, Herzog H, Mauler J, Filss C, Okell TW, Kops ER, Tellmann L, Fischer T, Brocke B, Sturm W, Coenen HH, Shah NJ. Comparison of cerebral blood flow acquired by simultaneous [15O]water positron emission tomography and arterial spin labeling magnetic resonance imaging. J Cereb Blood Flow Metab. 2014. doi: 10.1038/jcbfm.2014.92
[17] Amunts K, Lepage C, Borgeat L, Mohlberg H, Dickscheid T, Rousseau MÉ, Bludau S, Bazin PL, Lewis LB, Oros-Peusquens AM, Shah NJ, Lippert T, Zilles K, Evans AC. BigBrain: an ultrahigh-resolution 3D human brain model. Science. 2013:1472-5. doi: 10.1126/science.1235381.
[18] Zheng, G., Wen, J., Lu, H. et al. Elevated global cerebral blood flow, oxygen extraction fraction and unchanged metabolic rate of oxygen in young adults with end-stage renal disease: an MRI study. Eur Radiol 26, 1732–1741 (2016). https://doi.org/10.1007/s00330-015-3968-9.
Figures
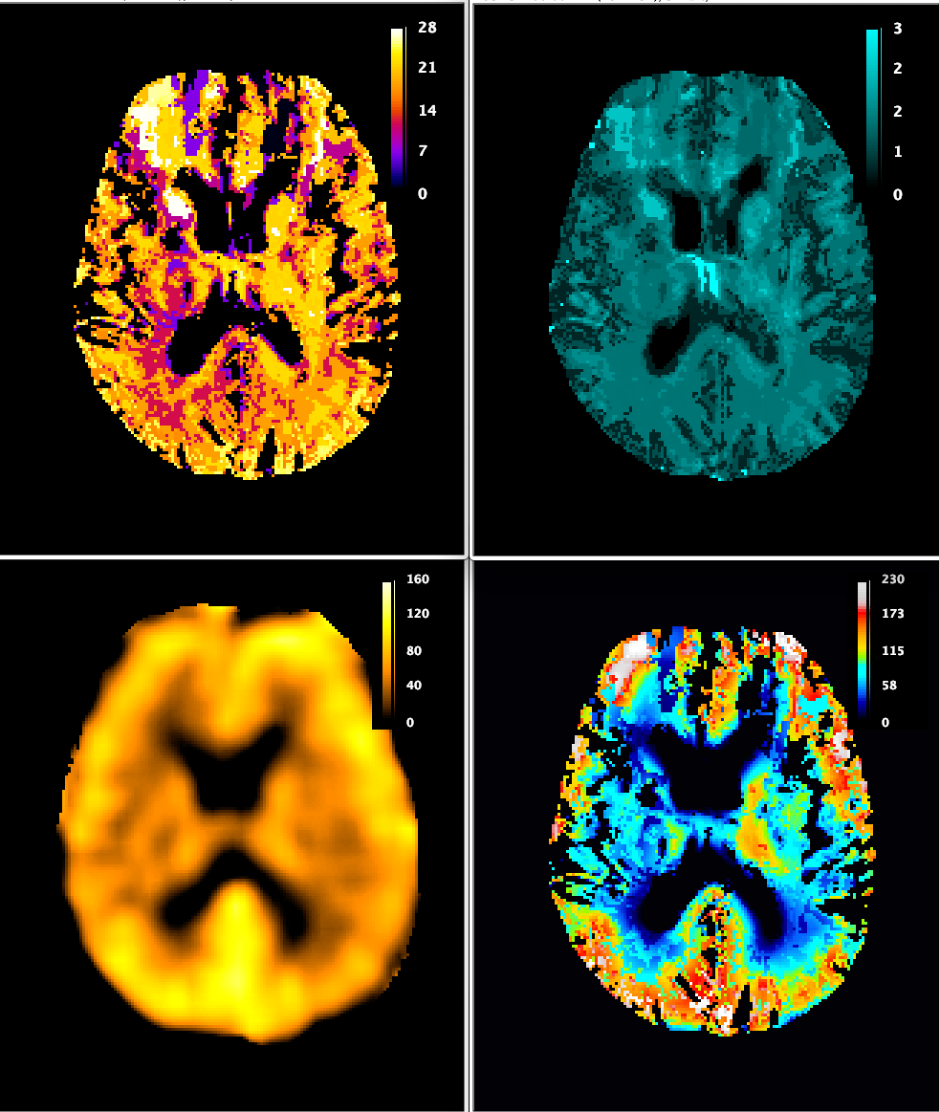
CMRO2(mmol O2/min/100g) = CBF(ml/min/100g) x OEF x Ya x 8.97/0.44 x Hct (mmol O2/ml). [18]
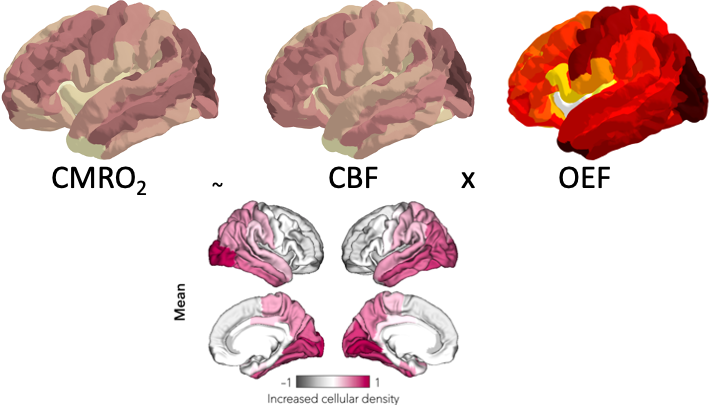
Figure 2. Characteristic distributions of (from left to right) CMRO2, CBF and OEF for each ROI of the Destrieux atlas. CMRO2 is proportional to CBF*OEF. All parameters are high in the primary areas (visual, sensorimotor) and lower OEF and CMRO2 in higher cognitive areas (insular cortex). An important, but not exhaustive role in this distribution is played by cell density (from Big Brain histological atlas [18]), showing a roughly similar trend.
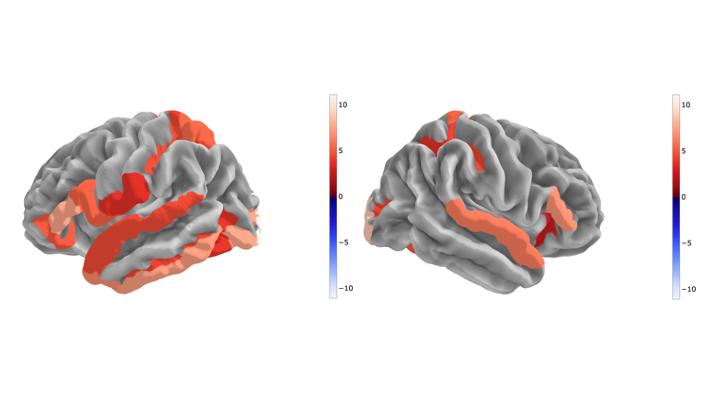
Figure 3. Gender differences in CBF (red: higher in female) are most pronounced in the occipital cortex, where also fMRI reports differential activation strength between men and women.
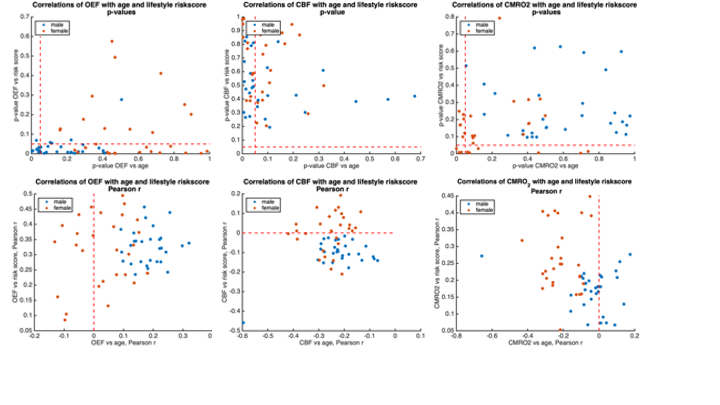
Figure 4a.(top) P-values of correlations over volunteers between CMRO2, CBF and OEF in each ROI of the Destrieux atlas with age and lifestyle risk score, respectively. The significance threshold (p<0.05) is marked with a dashed line. The values are shown separately for the male and female volunteers. Fig. 4b.(bottom) Pearson’s r for the same correlations, showing the trend of the dependence. Whenever negative and positive correlations are both present, the r=0 line is marked with a dashed line. The values are shown separately for the male (blue) and female (red) volunteers.
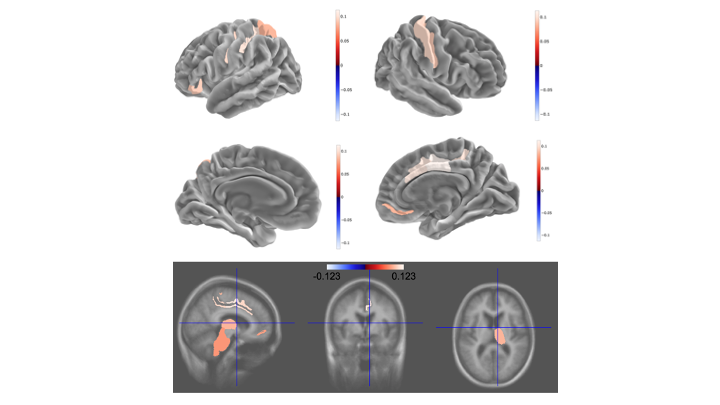
Figure 5.ROIs in which correlations between OEF and IQ are significant. The correlations were calculated over all volunteers, with gender as a covariate. Separate analysis for men and women reveal that the positive correlations are driven by data from female volunteers.