3880
Unravelling microstructural age-related changes in the acoustic radiations through advanced diffusion MRI analysis1Danish Research Centre for Magnetic Resonance, Centre for Functional and Diagnostic Imaging and Research, Copenhagen University Hospital - Amager and Hvidovre, Copenhagen, Denmark, 2Hearing Systems Section, Department of Health Technology, Technical University of Denmark, Kongens Lyngby, Denmark, 3Department of Neurology, Copenhagen University Hospital Bispebjerg and Frederiksberg, Copehagen, Denmark, 4Department of Clinical Medicine, Faculty of Health and Medical Sciences, University of Copenhagen, Copehagen, Denmark, 5Department of Applied Mathematics and Computer Science, Technical University of Denmark, Kongens Lyngby, Denmark
Synopsis
Keywords: Aging, Aging, microstructure, µFA, tensor-valued encoding, auditory system, tractography, white matter
Motivation: Age-related hearing loss is widespread, but the impact of aging on the central auditory pathway's structure and function is poorly understood.
Goal(s): This study aims to characterise the microstructural signatures of aging in the acoustic radiations.
Approach: Forty-five participants between 18-76 years underwent diffusion weighted MRI. Tractography was used to delineate each subject's acoustic radiations, and maps of diffusion MRI metrics and biophysical model parameters were computed.
Results: Mean isotropic kurtosis and axonal volume were found to increase with age in the bilateral acoustic radiations. The increase in apparent axonal volume fraction contradicts previous studies and expectations of decreased fibre integrity with age.
Impact: The aging-related microstructural changes to the central auditory pathway shown here may have functional consequences in terms of hearing ability and hearing rehabilitation strategies among the elderly. Future studies could incorporate electrophysiological measurements to assess this microstructure-function relationship.
Introduction
Hearing loss is highly prevalent among the elderly, yet little is known about how aging impacts the structure and function of the central auditory pathway. Previous research1 identified age-related reductions in the “fibre density” of the acoustic radiation (AR), the largest central auditory tract, using in-vivo diffusion magnetic resonance imaging (dMRI) with a diffusion tensor imaging (DTI) and fixel-based approach. However, DTI is non-specific to microstructure, and fixel-based measures of fibre density may be influenced by signals from the extra-axonal space2. In this dMRI study, we aim to further shed light on age-related changes in the AR by estimating axonal intra-cellular volume fraction (ICVF) using the Neurite Orientation Dispersion and Density Imaging3 (NODDI) and spherical mean technique4,5 (SMT). We also leveraged tensor value encoded (TVE) dMRI to compute model-free metrics: microscopic fractional anisotropy (µFA), mean isotropic kurtosis (MKi) and mean anisotropic kurtosis (MKa). Unlike DTI metrics, these are not biased by relative orientations of intra-voxel tracts.Methods
Figure 1 depicts the methodological pipeline.MRI
Forty-five participants (40.9 $$$\pm$$$ 17.5 years, 24 female, 19-76 years) underwent MRI using a 3T Siemens Prisma at the Danish Research Centre for Magnetic Resonance. Multi-shell dMRI was acquired with a pulsed gradient spin echo (PGSE) echo-planar imaging (EPI) sequence: b = [1000,2500] s/mm2, 1.786x1.786x1.8 mm3 voxel size, field-of-view (FOV) 220x222x149 mm3, 60 isotropically distributed gradient directions, TE/TR = 64/2750 ms. TVE-dMRI was acquired with linear (LTE) and spherical tensor encoding (STE) for b= [100,700,1400,2000] s/mm2 repeated [6,6,12,16] times respectively. The LTE b-vector principal eigenvectors were distributed isotropically on the unit sphere. A spin-echo-based EPI was employed with: 2.5 mm isotropic voxel size, FOV 231x238x177mm3, TE/TR = 90/7400 ms. For both PGSE and TVE scans, additional b=0 and reverse phase encoded b=0 volumes were acquired for susceptibility-induced distortion correction. Finally, an MPRAGE was acquired.
Pre-processing
The PGSE and TVE data were denoised6, then corrected for Gibbs ringing7 and susceptibility-induced distortions with FSL TOPUP8. Correction of subject motion and eddy-current distortions was performed with FSL EDDY9 for the PGSE data, or elastix10 with extrapolated reference images11 for the TVE data.
Tractography
The PGSE-dMRI data were upsampled to 1 mm isotropic resolution using FSL FLIRT with sinc interpolation12. The MPRAGE was registered to this space using FLIRT, and subsequently non-linearly transformed to MNI space using FSL FNIRT. Atlas-based regions-of-interest (ROI) representing the medial geniculate nucleus13 (MGN), Heschl’s gyrus (HG) (Harvard-Oxford Cortical atlas) and the corpus callosum14 (CC) were transformed from MNI to upsampled subject PGSE-dMRI space.
Anatomically constrained tractography was performed in MRtrix315 on the upsampled PGSE-dMRI dataset using the probabilistic iFOD2 algorithm, maximum step angle of 30$$$^{\circ} $$$, step size 1.25 mm, 40000 target streamlines and unidirectional seeding. Streamlines were seeded from the MGN to the HG and obtained streamline density maps were thresholded (Figures 2a-d).
Model fitting and analysis
MRtrix3’s “dwi2tensor” produced maps of fractional anisotropy (FA), mean diffusivity (MD), axial diffusivity (AD) and radial diffusivity (RD) on the upsampled PGSE-dMRI data with b$$$\leq$$$1000 s/mm2. The SMT4,5 and the AMICO implementation16 of NODDI3 were fitted to the original-resolution PGSE-dMRI data for ICVF estimates. µFA, MKi and MKa maps were obtained using the multi-dimensional dMRI toolbox17 implementation “dtd_gamma”18. AR and CC masks were linearly interpolated to the relevant spaces, producing weighted masks for calculation of within-ROI parameter averages with reduced partial volume effects.
Results and Discussion
Figure 2 shows tractography and parameter map examples. Figure 3a plots the parameters vs. age in the bilateral ARs and CC. Notably, estimated ICVF increased with age in the ARs, but decreased in the CC. MKi increased with age in both regions. Figures 3b-c show parameter correlation matrices.The observed age-related increase in apparent axonal ICVF in the ARs contradicts previous findings of reduced fibre density1 , while changes to FA, ICVF, and MKi in the CC are in line with previous studies19–22. Increased MKi represents increased variance of intra-voxel isotropic diffusivities which, in aging, has been hypothesized to be driven by elevated glial cell density19. This effect could potentially positively bias apparent ICVF, but should also lead to FA and µFA reductions not seen here. Furthermore, changes to intermingling tracts23 that share voxels with the AR may also influence the dMRI metrics, obscuring AR-specific changes.
Conclusion
We show that the central auditory pathway exhibits aging-related microstructural changes in the form of increased MKi and apparent axonal ICVF. This may have functional consequences in terms of hearing ability and implications for rehabilitation of hearing. Future studies would benefit from histology to disentangle specific cellular changes in the AR microstructure from the dMRI metrics.Acknowledgements
We would like to thank the participants for participating in this study. The study is funded by a synergy grant from Novo Nordisk foundation to the UHEAL project Uncovering Hidden Hearing Loss (Grant Nr. NNF17OC0027872). HRS holds a 5-year professorship in precision medicine at the Faculty of Health Sciences and Medicine, University of Copenhagen which is sponsored by the Lundbeck Foundation (Grant No. R186-2015-2138).References
1. Koops EA, Haykal S, Van Dijk P. Macrostructural Changes of the Acoustic Radiation in Humans with Hearing Loss and Tinnitus Revealed with Fixel-Based Analysis. J Neurosci. 2021;41(18):3958-3965.
2. Dhollander et al., Fixel-Based Analysis of Diffusion MRI. Fixel-based Analysis of Diffusion MRI: Methods, Applications, Challenges and Opportunities - NeuroImage. 2021;118417
3. Zhang H, Schneider T, Wheeler-Kingshott CA, Alexander DC. NODDI: Practical in vivo neurite orientation dispersion and density imaging of the human brain. NeuroImage. 2012;61(4):1000-1016
4. Kaden E, Kruggel F, Alexander DC. Quantitative mapping of the per-axon diffusion coefficients in brain white matter: Quantitative Mapping of the Per-Axon Diffusion Coefficients. Magn Reson Med. 2016;75(4):1752-1763.
5. Kaden E, Kelm ND, Carson RP, Does MD, Alexander DC. Multi-compartment microscopic diffusion imaging. NeuroImage. 2016;139:346-359.
6. Ma X, Uğurbil K, Wu X. Denoise magnitude diffusion magnetic resonance images via variance-stabilizing transformation and optimal singular-value manipulation. NeuroImage. 2020;215:116852.
7. Kellner E, Dhital B, Kiselev VG, Reisert M. Gibbs-ringing artifact removal based on local subvoxel-shifts: Gibbs-Ringing Artifact Removal. Magn Reson Med. 2016;76(5):1574-1581.
8. Andersson JLR, Skare S, Ashburner J. How to correct susceptibility distortions in spin-echo echo-planar images: application to diffusion tensor imaging. NeuroImage. 2003;20(2):870-888.
9. Andersson JLR, Sotiropoulos SN. An integrated approach to correction for off-resonance effects and subject movement in diffusion MR imaging. NeuroImage. 2016;125:1063-1078.
10. Klein S, Staring M, Murphy K, Viergever MA, Pluim JPW. elastix: A Toolbox for Intensity-Based Medical Image Registration. IEEE Trans Med Imaging. 2010;29(1):196-205.
11. Nilsson M, Szczepankiewicz F, Westen D van, Hansson O. Extrapolation-Based References Improve Motion and Eddy-Current Correction of High B-Value DWI Data: Application in Parkinson’s Disease Dementia. PLOS ONE. 2015;10(11):e0141825.
12. Dyrby TB, Lundell H, Burke MW, et al. Interpolation of diffusion weighted imaging datasets. NeuroImage. 2014;103:202-213.
13. Sitek KR, Gulban OF, Calabrese E, et al. Mapping the human subcortical auditory system using histology, postmortem MRI and in vivo MRI at 7T. eLife. 2019;8:e48932.
14. Amunts K, Mohlberg H, Bludau S, Zilles K. Julich-Brain: A 3D probabilistic atlas of the human brain’s cytoarchitecture. Science. 2020;369(6506):988-992.
15. Tournier JD, Smith R, Raffelt D, et al. MRtrix3: A fast, flexible and open software framework for medical image processing and visualisation. NeuroImage. 2019;202:116137.
16. Daducci A, Canales-Rodríguez EJ, Zhang H, Dyrby TB, Alexander DC, Thiran JP. Accelerated Microstructure Imaging via Convex Optimization (AMICO) from diffusion MRI data. NeuroImage. 2015;105:32-44.
17. Nilsson M, Szczepankiewicz F, Lampinen B, Ahlgren A, de Almeida Martins JP, Lasic S, Westin C-F, Topgaard D. An open-source framework for analysis of multidimensional diffusion MRI data implemented in MATLAB. (ISMRM 2018) . https://archive.ismrm.org/2018/5355.html
18. Lasič S, Szczepankiewicz F, Eriksson S, Nilsson M, Topgaard D. Microanisotropy imaging: quantification of microscopic diffusion anisotropy and orientational order parameter by diffusion MRI with magic-angle spinning of the q-vector. Front Phys. 2014;2.
19. Kamiya K, Kamagata K, Ogaki K, et al. Brain White-Matter Degeneration Due to Aging and Parkinson Disease as Revealed by Double Diffusion Encoding. Front Neurosci. 2020;14.
20. Pietrasik W, Cribben I, Olsen F, Huang Y, Malykhin NV. Diffusion tensor imaging of the corpus callosum in healthy aging: Investigating higher order polynomial regression modelling. NeuroImage. 2020;213:116675.
21. Bender AR, Raz N. Normal-appearing cerebral white matter in healthy adults: mean change over 2 years and individual differences in change. Neurobiol Aging. 2015;36(5):1834-1848.
22. Motovylyak A, Vogt NM, Adluru N, et al. Age-related differences in white matter microstructure measured by advanced diffusion MRI in healthy older adults at risk for Alzheimer’s disease. Aging Brain. 2022;2:100030.
23. Maffei C, Jovicich J, De Benedictis A, et al. Topography of the human acoustic radiation as revealed by ex vivo fibers micro-dissection and in vivo diffusion-based tractography. Brain Struct Funct. 2018;223(1):449-459.
Figures
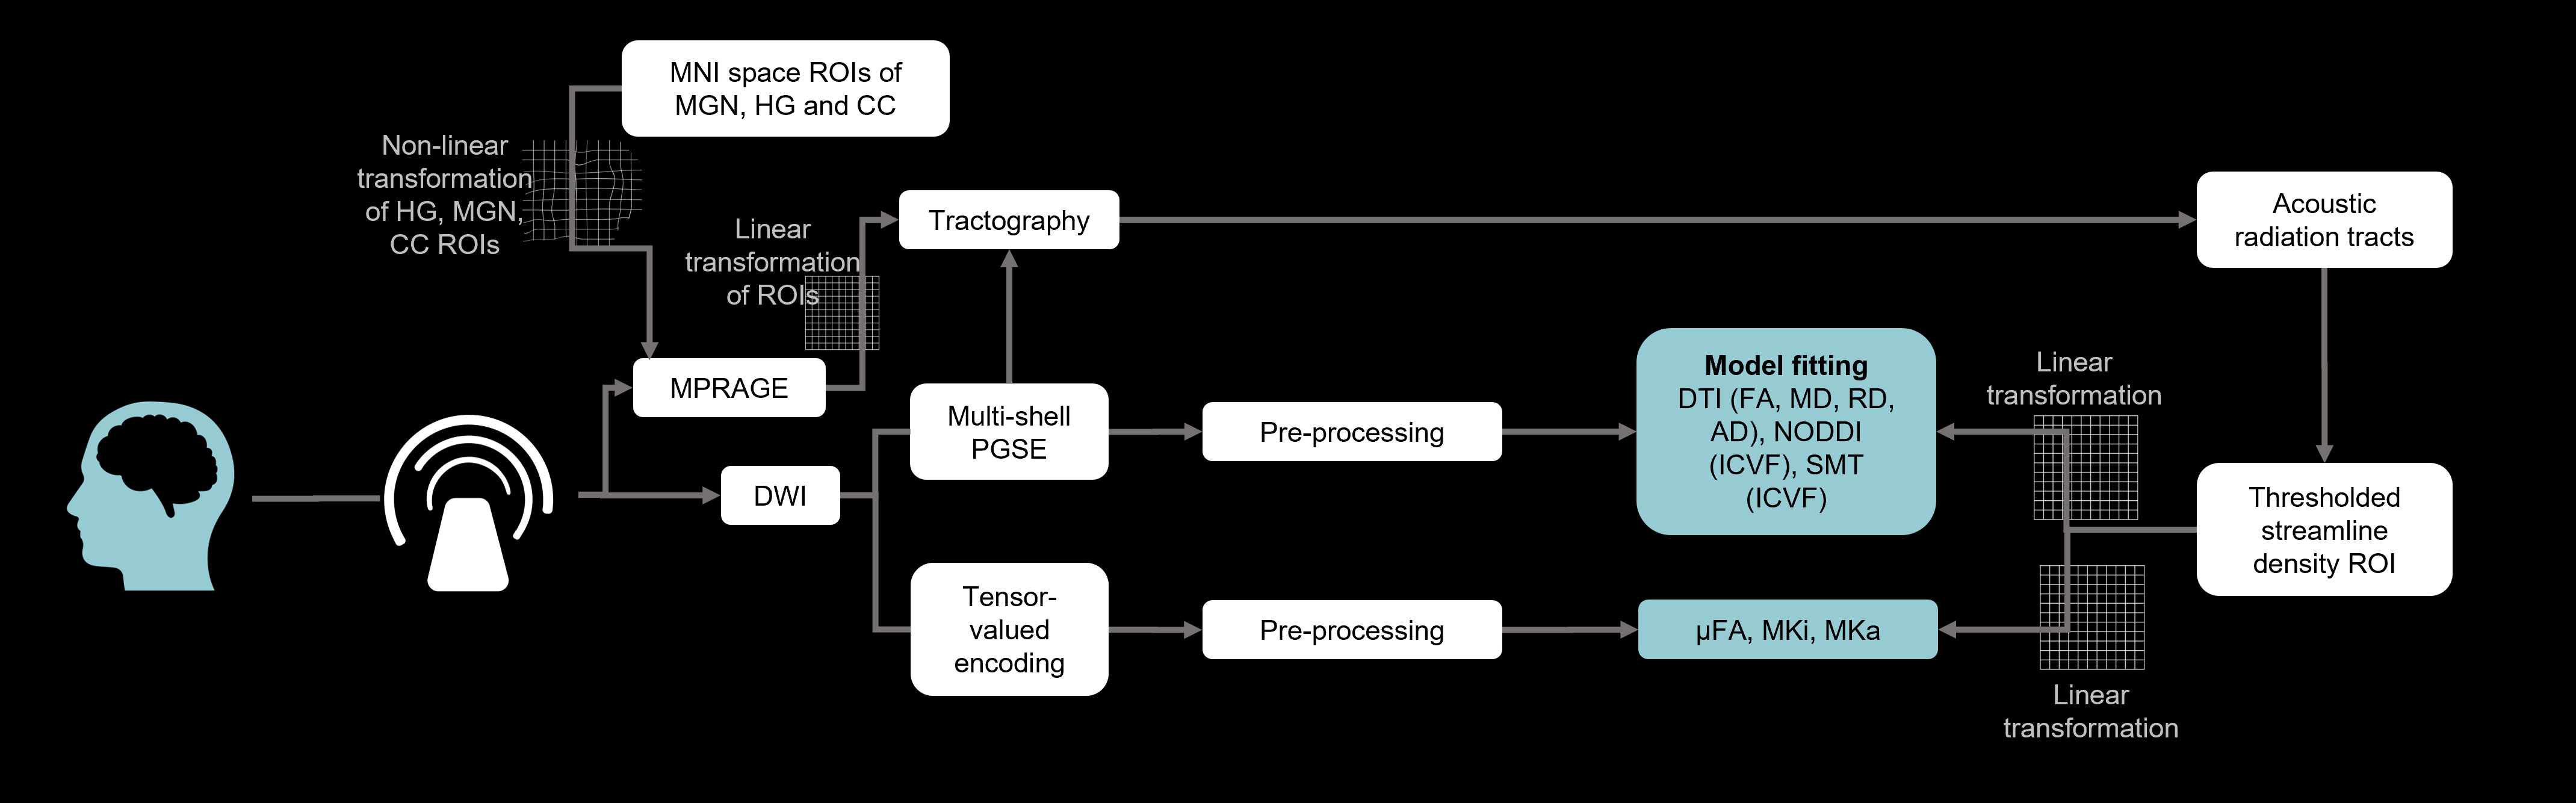
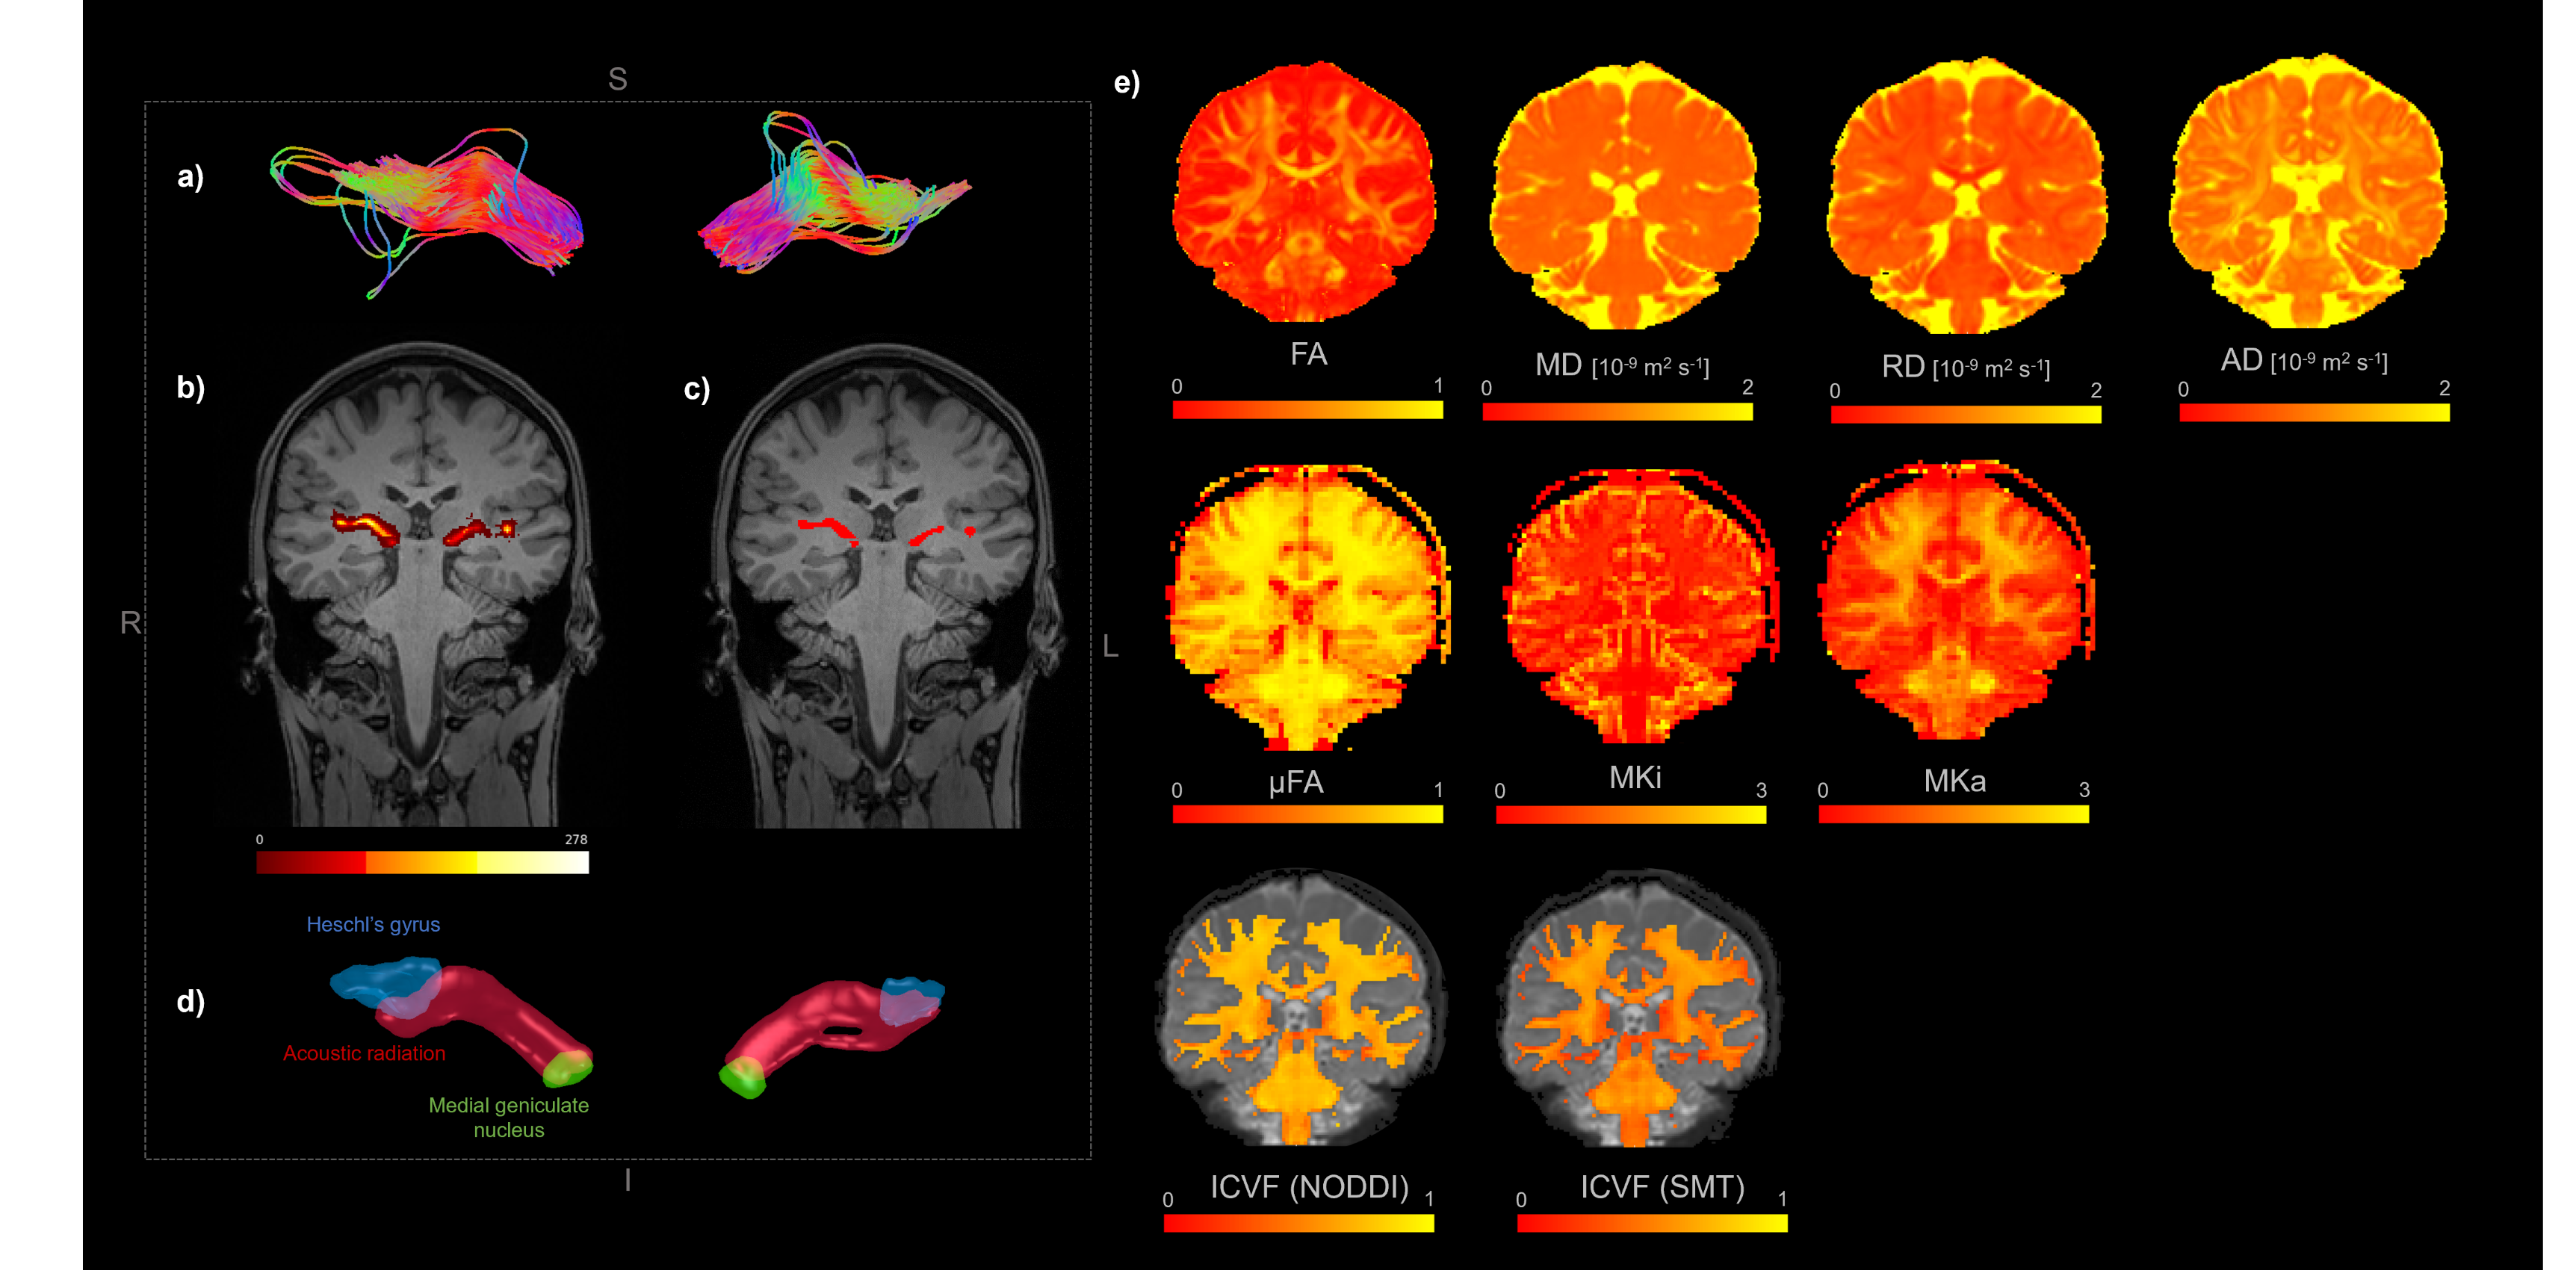
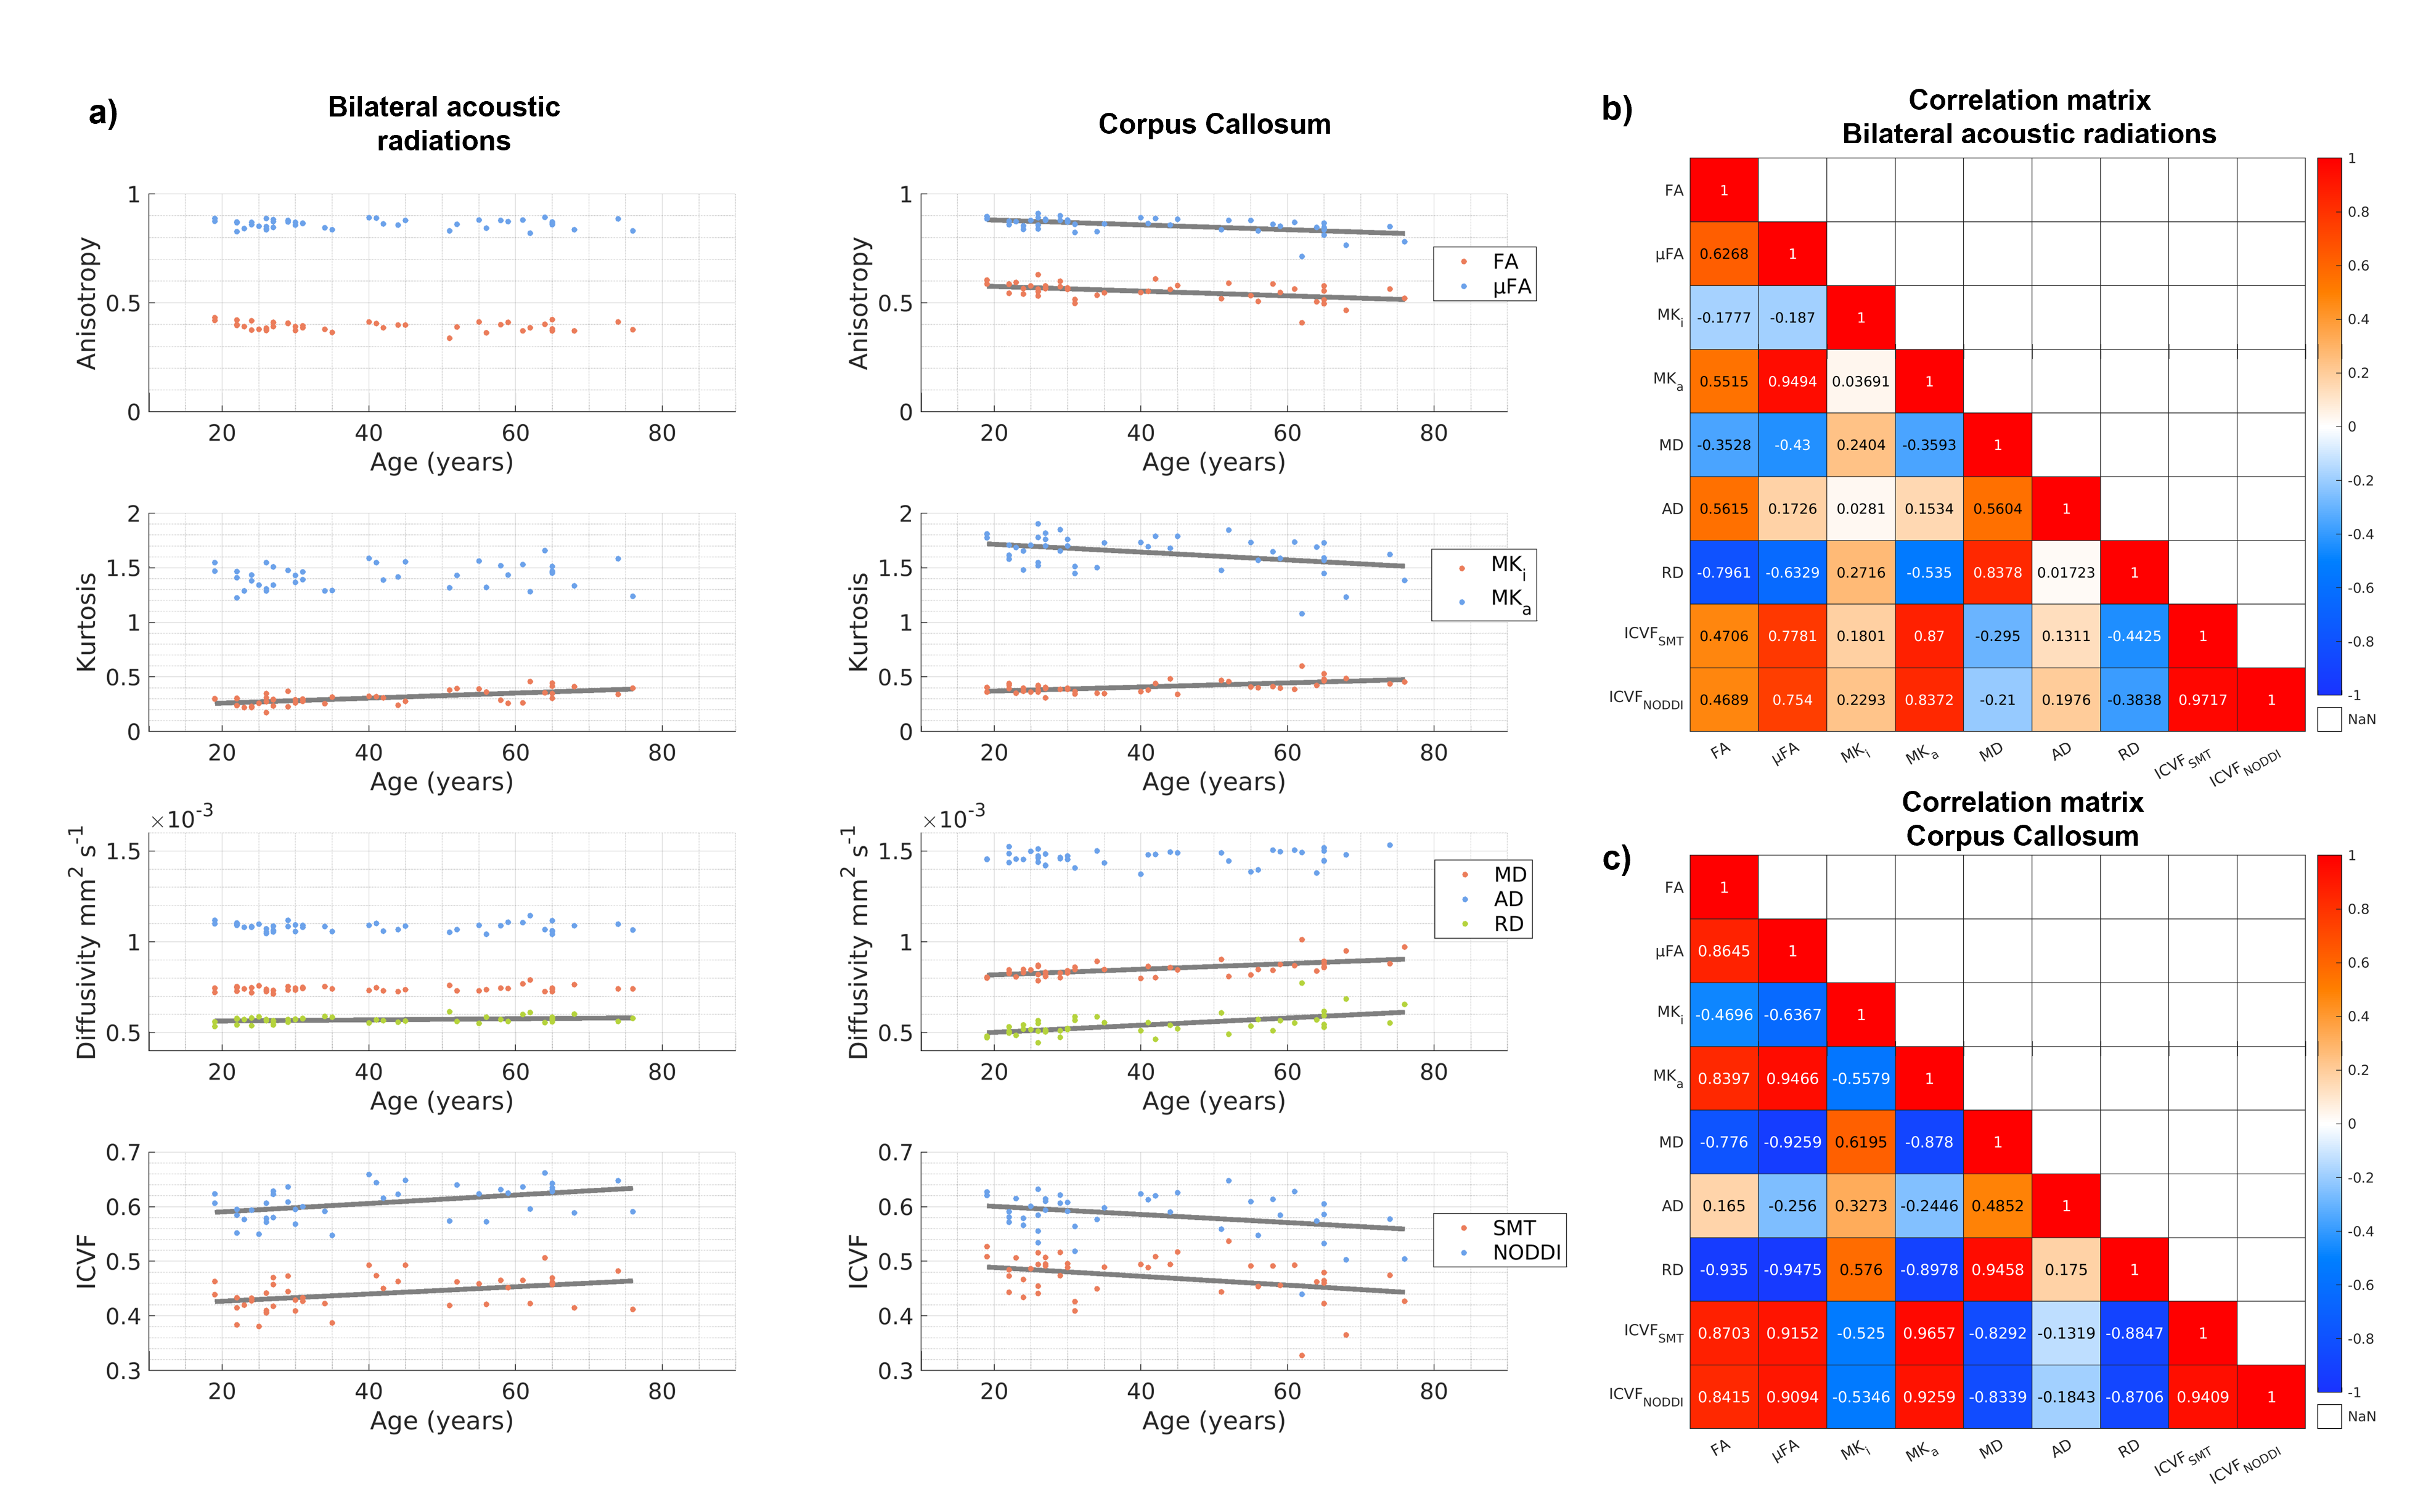
Figure 3. Age-related changes in microstructural dMRI parameters a) Changes in dMRI parameters with age in the bilateral ARs (left) and CC (right), which has been more widely studied in the literature and is included as a reference ROI. Linear correlations (two-tailed t-test p<0.05) are marked with grey lines. As expected, many of the dMRI parameters show strong correlations to each other in b) the ARs and c) the CC. The ICVF estimates with the SMT and NODDI are strongly correlated, for example, despite the different models.