3878
Characterization of Age-dependent regional T1 and T2 Relaxometry in Asymptomatic Volunteers Using Magnetic Resonance Fingerprinting1Department of Radiology, Zhongda Hospital, Southeast University, Nanjing, China, 2Research Collaboration Team, Siemens Healthineers Ltd. Shanghai, China, Shanghai, China
Synopsis
Keywords: Aging, Aging
Motivation: MRF is a promising quantitative tool to acquire T1 and T2 values simultaneously. However, its regional variations with advancing age needs to be better eluciated.
Goal(s): To determine the age-dependent variations in MRF T1 and T2 relaxation maps, and to characterize the quantitative properies of the brain tissue.
Approach: MRF maps were acuiqred in 138 asymptomatic volunteers. Voxel-wise correlation analyses were performed, T1 and T2 values were extracted from various regions to further demonstrate their correlations with age.
Results: Both T1 and T2 values in extensive regions increased with age. But T2 drops in bilateral temporal poles, insular cortices, putamen, and corticospinal tract.
Impact: MRF was introduced as an in vivo quantitation tool for normative brain imaging. It shows great potential in quantifying differences in brain parenchyma related to age variations and precise tissue segmentation that can be applied in radiomics studies.
Introduction
MR fingerprinting (MRF) is a quantitative imaging technique that simultaneously provides T1 and T2 relaxation maps in a single scan (1). It has been demonstrated to have high reproducibility (2) and has been used to explore quantitative atlases of the brain. However, previous studies have been limited by small sample size (3) or limited age range (4). In this study, we present the quantification of regional brain T1 and T2 relaxation times in a larger sample of asymptomatic volunteers with varying age using MRF. We also assess age-dependent variations in regional properties.Methods
Conventional 3D-T1 and 2D-MRF images were acquired using a Siemens 3T Vida scanner with a 32-channel head coil. The in-plane resolution of the MRF images was 1 mm (FOV, 25 cm; matrix size, 256) with a slice thickness of 5 mm. To retrieve quantitative tissue information, a MRF dictionary was generated using Bloch simulations, which included signal evolutions from a wide range of T1 (60-5000 ms) and T2 (10-500 ms) values. To develop normative MRF T1 and T2 atlases, skull stripping was first performed and the MRF T1 maps were then registered to the 3D-T1 images using Advanced Normalization Tools (ANTS). The warping information was applied to the T1 and T2 maps to generate the normalized images. Subsequently, voxel-wise correlation analyses were conducted to explore the correlations between age and MRF-derived maps. Additionally, the brain was segmented into 116 brain regions according to the AAL atlas and 50 WM regions according to the ICBM WM atlas. T1 and T2 values were extracted from each region and correlated with age.Results
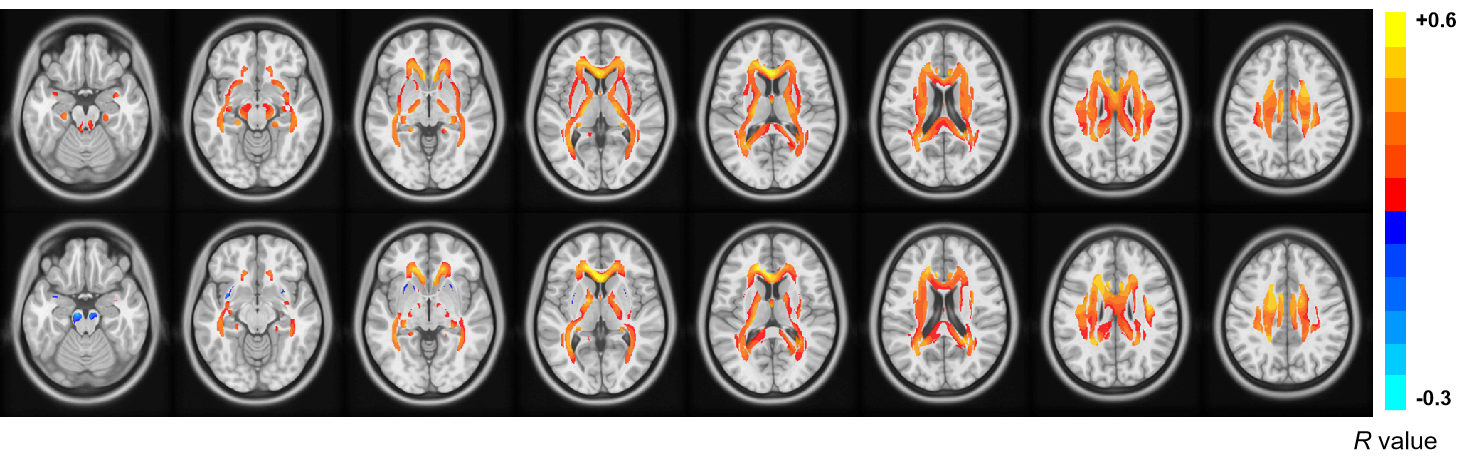
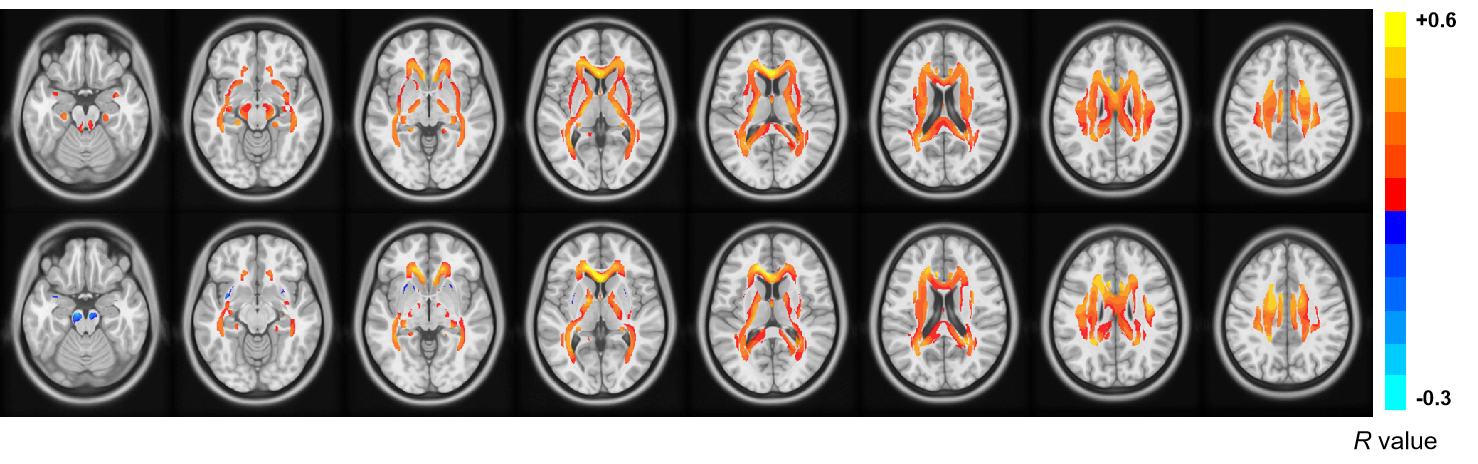
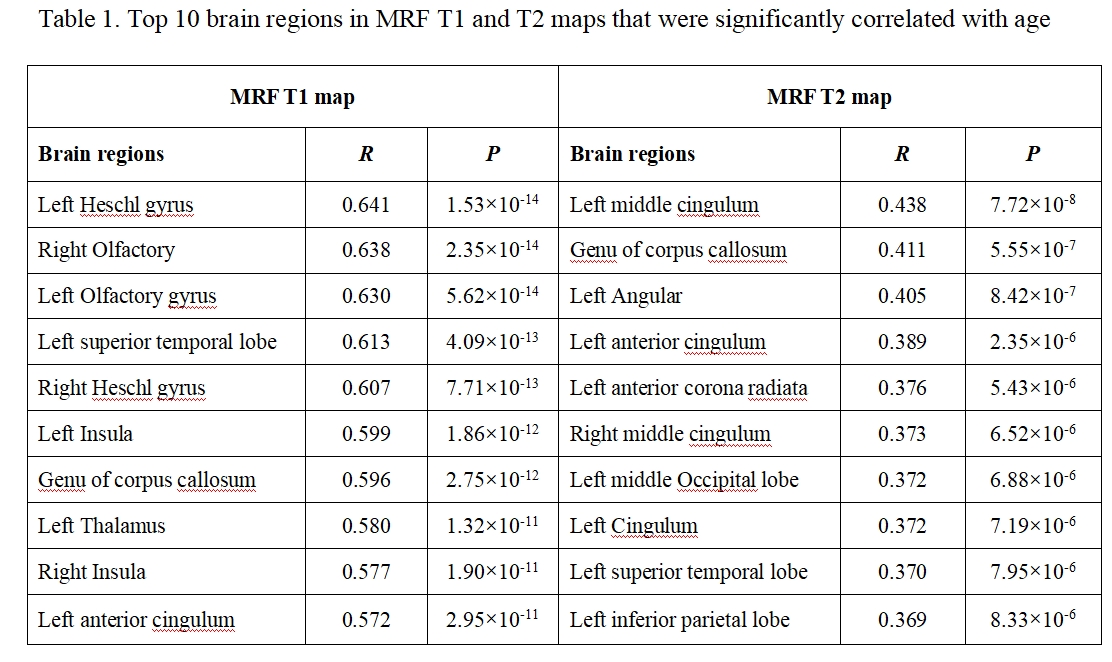
A total of 138 asymptomatic volunteers aged 14-86 years underwent MRF imaging. Of these, 45 were male (aged 14-86 years) and 93 were female (aged 17-84 years), with a median age of 57 years. No participants revealed any overt parenchymal abnormalities in the analyzed regions. Voxel-wise correlation analyses revealed that both T1 and T2 values were positively correlated with age in extensive AAL regions, with T1 maps exhibiting a more extensive pattern and more significant correlations than T2 maps (Figure 1). However, there were several brain regions where T2 maps decreased with advancing age, which was distinct from T1 maps, including temporal poles, insular cortices and putamen in AAL template (figure 1), and corticospinal tract and brain stem in WM template (Figure 2). Table 1 displays the top 10 regions that were most correlated with age (all P values <1×10⁻⁵).Discussion
In this study, we applied the recently developed MRF to characterize tissue properties of multiple brain regions across a wide age range and a larger sample size than previous studies. Our findings of an overall increase in T1 and T2 values in extensive brain regions with increasing age are consistent with existing literature. This increase is thought to be due to gliosis, free water content, loss of myelination, and other aging changes, which have been reported to be related to longer T1 and T2 relaxation times (5). Interestingly, there were several regions showing drops in T2 values, particularly in temporal poles, deep gray nuclei, and WM tracts. This decrease in T2 values may be attributed to increasing mineralization and iron deposition, which are part of the physiological aging process (6). However, these findings should be further validated through pathological evidence or other imaging parameters such as QSM.Conclusion
In this pilot study, we introduced MRF as a rapid multiparametric in vivo quantitation tool for normative brain imaging. We demonstrated its potential in quantifying differences in brain parenchyma related to age variations. This study also provides a foundation for more precise tissue segmentation that can be applied in radiomics studiesAcknowledgements
The study was approved by the local Medical Research Ethics Committee of Zhongda Hospital in accordance with the Helsinki Declaration. None of the included subjects have been previously reported. The Author (Yang Song) from a commercial company, Siemens Healthineers Ltd., was a MR collaboration scientist doing technical support in this study under Siemens collaboration regulation without any payment and personal concern regarding to this study.References
1. Ma D, Gulani V, Seiberlich N, et al. Magnetic resonance fingerprinting. Nature 2013;495(7440):187-192.2. Korzdorfer G, Kirsch R, Liu K, et al.
2. Reproducibility and Repeatability of MR Fingerprinting Relaxometry in the Human Brain. Radiology 2019;292(2):429-437.3.
3. Choi JY, Hu S, Su TY, et al. Normative quantitative relaxation atlases for characterization of cortical regions using magnetic resonance fingerprinting. Cereb Cortex 2023;33(7):3562-3574.4.
4. Chen Y, Chen MH, Baluyot KR, et al. MR fingerprinting enables quantitative measures of brain tissue relaxation times and myelin water fraction in the first five years of life. Neuroimage 2019;186:782-793.5.
5. Spilt A, Geeraedts T, de Craen AJ, Westendorp RG, Blauw GJ, van Buchem MA. Age-related changes in normal-appearing brain tissue and white matter hyperintensities: more of the same or something else? AJNR Am J Neuroradiol 2005;26(4):725-729.6.
6. Hasan KM, Walimuni IS, Kramer LA, Narayana PA. Human brain iron mapping using atlas-based T2 relaxometry. Magn Reson Med 2012;67(3):731-739.
Figures