3873
Normative age-trajectories of higher-order diffusion properties of major brain metabolites in cerebral and cerebellar gray matter using dMRS1Cardiff University Brain Research Imaging Centre (CUBRIC), School of Psychology, Cardiff University, Cardiff, United Kingdom, 2School of Computer Science and Informatics, Cardiff University, Cardiff, United Kingdom, 3Brain and Spine Institute - ICM, Team "Movement Investigations and Therapeutics", Paris, France, 4INSERM U 1127, CNRS UMR 7225, Sorbonne University, Paris, France, 5Center for Magnetic Resonance Research, Department of Radiology,, University of Minnesota, Minneapolis, MN, United States, 6INSERM U 1127, CNRS UMR 7225,, Sorbonne University, Paris, France, 7Paris Brain Institute - ICM, Centre for Neuroimaging Research - CENIR, Paris, France
Synopsis
Keywords: Aging, Aging, dw-mrs, diffusion, brain, microstructure, metabolite
Motivation: Healthy brain aging involves intricate changes in both brain structure and function, including alterations in cellular composition and microstructure across various regions. We focus on microstructural changes by studying normative age-trajectories in cerebral and cerebellar gray matter in human brain.
Goal(s): Investigating microstructural changes in cerebral and cerebellar gray matter in human brain and provide benchmarks for the normative age-trajectories of higher-order metabolite diffusion properties.
Approach: Using DW-MRS and diffusion modelling for characterizing microstructural changes
Results: Our findings provide benchmarks for identifying anomalies in the diffusion properties of major brain metabolites, stemming from pathological mechanisms altering both the brain microstructure and cellular composition
Impact: This work investigates microstructural changes with aging in gray matter cerebral and cerebellar cortex in human brain DW-MRS. Moreover, it offers the first normative age-trajectories of metabolite diffusion characteristics, setting benchmark for detection and characterization of microstructural anomalies.
Introduction
Healthy brain aging involves numerous functional and structural changes in the brain, including alteration of both the cellular composition and microstructure of the different brain regions. Notably, ex-vivo histological measurements1–4 reported a reduction of dendritic spines in the cerebral cortex with aging, while others reported changes in the cellular composition of the cerebellar cortex, e.g., with loss of Purkinje cells and increase of other cell types with aging and in disease5.Water diffusion-weighted MRI (dMRI) cannot unambiguously inform on changes in cellular composition due to the poor cell-type specificity of water molecules. In contrast, metabolite diffusion-weighted MRS (dMRS) provides higher cell-type specificity6–12, offering the opportunity to quantify alteration of both the cellular composition and microstructure with age.
However, besides only a few works investigating brain metabolites changes in concentration13,14 and apparent diffusion coefficient15 in healthy aging, it is still unknown how other informative diffusion properties (e.g. apparent diffusional kurtosis) of brain metabolites change with aging.
This work aims to provide the first normative age-trajectories of higher-order diffusion properties of major metabolites (tNAA, tCr and tCho) in the cerebral and cerebellar gray matter (GM) for the age-range 25-80 yo using dMRS.
Methods
Data acquisition/processing: dMRS data were acquired from 25 healthy participants (age-range 25-80; mean 50.2; std 20.2 yo) on a 3T Siemens Prisma with 64-channel head coil. The localization was applied using a DW-semi-LASER (TE|TR = 125 ms |3 cardiac cycles)16 (Fig.1A) in the cerebellum and the posterior cingulate cortex (PCC), Fig.1-C, D. Metabolite DW-spectra (24 transients per b-value; spectral-bandwidth = 3000 Hz; Npts=2048) were recorded in four directions (tetrahedral encoding) with 6 b-values up to 24 ms/µm2 ($$$\Delta$$$=62.5ms; $$$\delta$$$=26.4 ms). Post-processed spectra averaged (Fig.1B) and then quantified using LCModel17. Signals at each $$$b$$$ were direction-averaged and analyzed.Data analysis: We estimated apparent diffusion coefficient $$$ADC$$$ and kurtosis $$$K$$$ by fitting the kurtosis representation12,18 to the data up to $$$b$$$≤8.7ms/µm2 and the apparent intra-neurite axial diffusivity $$$D_{intra}$$$ by fitting the astro-sticks model12,19 to the data at all b values. In addition, we estimated intra-neurite apparent axial diffusivity $$$D_{intra}$$$ and kurtosis $$$K_{intra}$$$ by fitting to the data at all b-values a modified astro-sticks model that incorporates an effective intra-stick axial diffusivity defined as: $$$D_{eff}(D_{intra},K_{intra},b,\theta)=D_{intra}(1-D_{intra}K_{intra}b\cos^2\theta)$$$11,20–22, where $$$\theta$$$ is the angle between the main axis of a given stick and the applied diffusion gradient. Here, $$$K_{intra}$$$ quantifies non-Gaussian diffusion stemming from the spines and/or other hindering structures20,21. The numerical integration yields direction-averaged diffusion signal:
$$\frac{S}{S_0}=\int^1_0e^{-bD_{eff}\cos^2\theta}d(\cos\theta)$$
Results
Exemplar dMRS-spectra of both regions illustrated in Fig.1B, showing excellent spectral quality and high SNR from LCModel (CEREBELLUM:18±3; PCC:24±4 – non-DW acquisition).Fig.2 reports that lower apparent diffusivities ($$$ADC$$$ & $$$D_{intra}$$$) and higher kurtosis values ($$$K$$$ & $$$K_{intra}$$$) for all results in cerebellum than PCC.
Fig.3 depicts the normative age-trajectories obtained from mono-exponential and astro-stick model fit results and documents similar trends with no significant variation.
Fig.4 showcases the normative age-trajectories of diffusion kurtosis ($$$ADC$$$ & $$$D_{intra}$$$) and modified astro-stick model ($$$D_{intra}$$$ & $$$K_{intra}$$$) reporting similar trends: predominantly neuronal (tNAA) and glial (tCho) metabolites show identical changes with age in apparent diffusivities and kurtosis values, while tCr (less cell-type specific) exhibits opposite variations in cerebellum and PCC.
Fig.5 documents significant decrease of tNAA and tCr in PCC with age in agreement with literature15. Fig.5 also reports small and significant changes in the relative volume fraction of GM within the VOI in cerebellum with age (which become negligible in the age-range 60-80 yo).
Discussion & Conclusion
Estimated metabolite $$$K$$$ values in the PCC agree with literature23–26. Overall higher $$$K$$$ and $$$K_{intra}$$$ for tNAA agree with the expected higher spine density in cerebellum due to Purkinje cells and density packed granule cells27. Higher $$$K$$$ and $$$K_{intra}$$$ values for tCho in cerebellum are possibly due to the presence of highly-arborized Bergmann glia28. Same rationale can explain the observed lower diffusivities in cerebellum compared to PCC.Overall, estimated apparent diffusivities do not present any significant changes with aging, in contrast to estimated mono-exponential $$$ADC$$$s in the literature15, which might originate from different diffusion times and encoding scheme.
The normative age-trajectories of metabolite diffusion properties reported here for the first time showing only significant increase in $$$K_{intra}$$$ of tCho in PCC agree with literature29, (which is not confounded by changes in the tissue composition).
This study offers previously unavailable normative age-trajectories of major brain metabolites diffusion properties in PCC and cerebellar GM. These provide benchmarks for identifying anomalies in the diffusion properties of major brain metabolites, which could be related to pathological mechanisms altering both the brain microstructure and cellular composition.
Acknowledgements
• This work, KS and MP are supported by UKRI Future Leaders Fellowship (MR/T020296/2).
• This project has received funding d from Engineering and Physical Sciences Research Council (EPSRC EP/N018702/1). FB and CG acknowledge support from the programs 'Institut des neurosciences translationnelle' ANR-10-IAIHU-06 and 'Infrastructure d'avenir en Biologie Santé' ANR-11-INBS-0006. The authors would like to thank Dr. Edward J. Auerbach and Dr. Małgorzata Marjańska for providing us the dMRS sequence for the Siemens platform.
References
1. Feldman ML, Dowd C. Loss of dendritic spines in aging cerebral cortex. Anat Embryol (Berl). 1975;148(3):279-301. doi:10.1007/BF00319848/METRICS
2. Benavides-Piccione R, Fernaud-Espinosa I, Robles V, Yuste R, Defelipe J. Age-Based Comparison of Human Dendritic Spine Structure Using Complete Three-Dimensional Reconstructions. Cerebral Cortex. 2013;23(8):1798-1810. doi:10.1093/CERCOR/BHS154
3. Segal M. Dendritic spines and long-term plasticity. Nature Reviews Neuroscience 2005 6:4. 2005;6(4):277-284. doi:10.1038/nrn1649
4. Dickstein DL, Weaver CM, Luebke JI, Hof PR. Dendritic spine changes associated with normal aging. Neuroscience. 2013;251:21-32. doi:10.1016/J.NEUROSCIENCE.2012.09.077
5. Louis RJ, Lee M, Kuo SH, Vonsattel JPG, Louis ED, Faust PL. Cellular density in the cerebellar molecular layer in essential tremor, spinocerebellar ataxia, and controls. Parkinsonism Relat Disord. 2014;20(11):1270-1273. doi:10.1016/J.PARKRELDIS.2014.08.014
6. Ronen I, Valette J. Diffusion-weighted magnetic resonance spectroscopy. eMagRes (eds RK Harris and RL Wasylishen). 2015;4(4):733-750. doi:10.1002/9780470034590.emrstm1471
7. Cao P, Wu EX. In vivo diffusion MRS investigation of non-water molecules in biological tissues. NMR Biomed. 2017;30(3):e3481. doi:10.1002/nbm.3481
8. Palombo M, Shemesh N, Ronen I, Valette J. Insights into brain microstructure from in vivo DW-MRS. Neuroimage. 2018;182:97-116. doi:10.1016/j.neuroimage.2017.11.028
9. Vincent M, Palombo M, Valette J. Revisiting double diffusion encoding MRS in the mouse brain at 11.7T: Which microstructural features are we sensitive to? Neuroimage. 2020;207:116399. doi:10.1016/J.NEUROIMAGE.2019.116399
10. Palombo M, Ligneul C, Najac C, et al. New paradigm to assess brain cell morphology by diffusion-weighted MR spectroscopy in vivo. Proc Natl Acad Sci U S A. 2016;113(24):6671-6676. doi:10.1073/pnas.1504327113
11. Palombo M, Ligneul C, Valette J. Modeling diffusion of intracellular metabolites in the mouse brain up to very high diffusion-weighting: Diffusion in long fibers (almost) accounts for non-monoexponential attenuation. Magn Reson Med. 2017;77(1):343-350. doi:10.1002/MRM.26548
12. Ligneul C, Najac C, Döring A, et al. Diffusion-weighted MR spectroscopy: consensus, recommendations and resources from acquisition to modelling. Published online May 18, 2023. Accessed November 3, 2023. https://arxiv.org/abs/2305.10829v1
13. Haga KK, Khor YP, Farrall A, Wardlaw JM. A systematic review of brain metabolite changes, measured with 1H magnetic resonance spectroscopy, in healthy aging. Neurobiol Aging. 2009;30(3):353-363. doi:10.1016/J.NEUROBIOLAGING.2007.07.005
14. Cleeland C, Pipingas A, Scholey A, White D. Neurochemical changes in the aging brain: A systematic review. Neurosci Biobehav Rev. 2019;98:306-319. doi:10.1016/J.NEUBIOREV.2019.01.003
15. Deelchand DK, McCarten JR, Hemmy LS, Auerbach EJ, Eberly LE, Marjańska M. Changes in the intracellular microenvironment in the aging human brain. Neurobiol Aging. 2020;95:168-175. doi:10.1016/J.NEUROBIOLAGING.2020.07.017
16. Genovese G, Cherif LY, Marjanska M, et al. Reproducibility and clinical feasibility of diffusion-weighted MRS using sLASER and STEAM in the human brain in vivo at 3T. In: Proc. Intl. Soc. Mag. Reson. Med. 26, Paris, France. ; 2018:1064.
17. Provencher SW. Estimation of metabolite concentrations from localized in vivo proton NMR spectra. Magn Reson Med. 1993;30(6):672-679. doi:10.1002/mrm.1910300604
18. Novikov DS, Kiselev VG, Jespersen SN. On modeling. Magn Reson Med. 2018;79(6):3172-3193. doi:10.1002/mrm.27101
19. Panagiotaki E, Schneider T, Siow B, Hall MG, Lythgoe MF, Alexander DC. Compartment models of the diffusion MR signal in brain white matter: A taxonomy and comparison. Neuroimage. 2012;59(3):2241-2254. doi:10.1016/J.NEUROIMAGE.2011.09.081
20. Sukstanskii AL, Yablonskiy DA. In vivo lung morphometry with hyperpolarized 3He diffusion MRI: Theoretical background. Journal of Magnetic Resonance. 2008;190(2):200-210. doi:10.1016/J.JMR.2007.10.015
21. Yablonskiy DA, Sukstanskii AL. Theoretical models of the diffusion weighted MR signal. NMR Biomed. 2010;23(7):661-681. doi:10.1002/NBM.1520
22. Palombo M, Ligneul C, Hernandez-Garzon E, Valette J. Can we detect the effect of spines and leaflets on the diffusion of brain intracellular metabolites? Neuroimage. 2018;182:283-293. doi:10.1016/J.NEUROIMAGE.2017.05.003
23. Ingo C, Brink W, Ercan E, Webb AG, Ronen I. Studying neurons and glia non-invasively via anomalous subdiffusion of intracellular metabolites. Brain Struct Funct. 2018;223(8):3841-3854. doi:10.1007/s00429-018-1719-9
24. Mougel E, Valette J, Palombo M. Investigating exchange, structural disorder and restriction in Gray Matter via water and metabolites diffusivity and kurtosis time-dependence. Joint Annual Meeting ISMRM-ESMRMB ISMRT 31st Annual Meeting. Published online June 29, 2023. doi:10.58530/2022/0255
25. Döring A, Rösler F, Şimşek K, et al. Time dependent diffusion and kurtosis of human brain metabolites. In: Proc. Intl. Soc. Mag. Reson. Med. 31, Toronto, CA. ; 2023:p3355.
26. Genovese G, Marjańska M, Auerbach EJ, et al. In vivo diffusion-weighted MRS using semi-LASER in the human brain at 3 T: Methodological aspects and clinical feasibility. NMR Biomed. 2021;34(5):e4206. doi:10.1002/nbm.4206
27. Santamaria F, Wils S, De Schutter E, Augustine GJ. Anomalous diffusion in Purkinje cell dendrites caused by spines. Neuron. 2006;52(4):635-648. doi:10.1016/J.NEURON.2006.10.025
28. Sild M, Ruthazer ES. Radial glia: progenitor, pathway, and partner. Neuroscientist. 2011;17(3):288-302. doi:10.1177/1073858410385870
29. Mitoma H, Buffo A, Gelfo F, et al. Consensus Paper. Cerebellar Reserve: From Cerebellar Physiology to Cerebellar Disorders. Cerebellum. 2020;19(1):131-153. doi:10.1007/S12311-019-01091-9
Figures
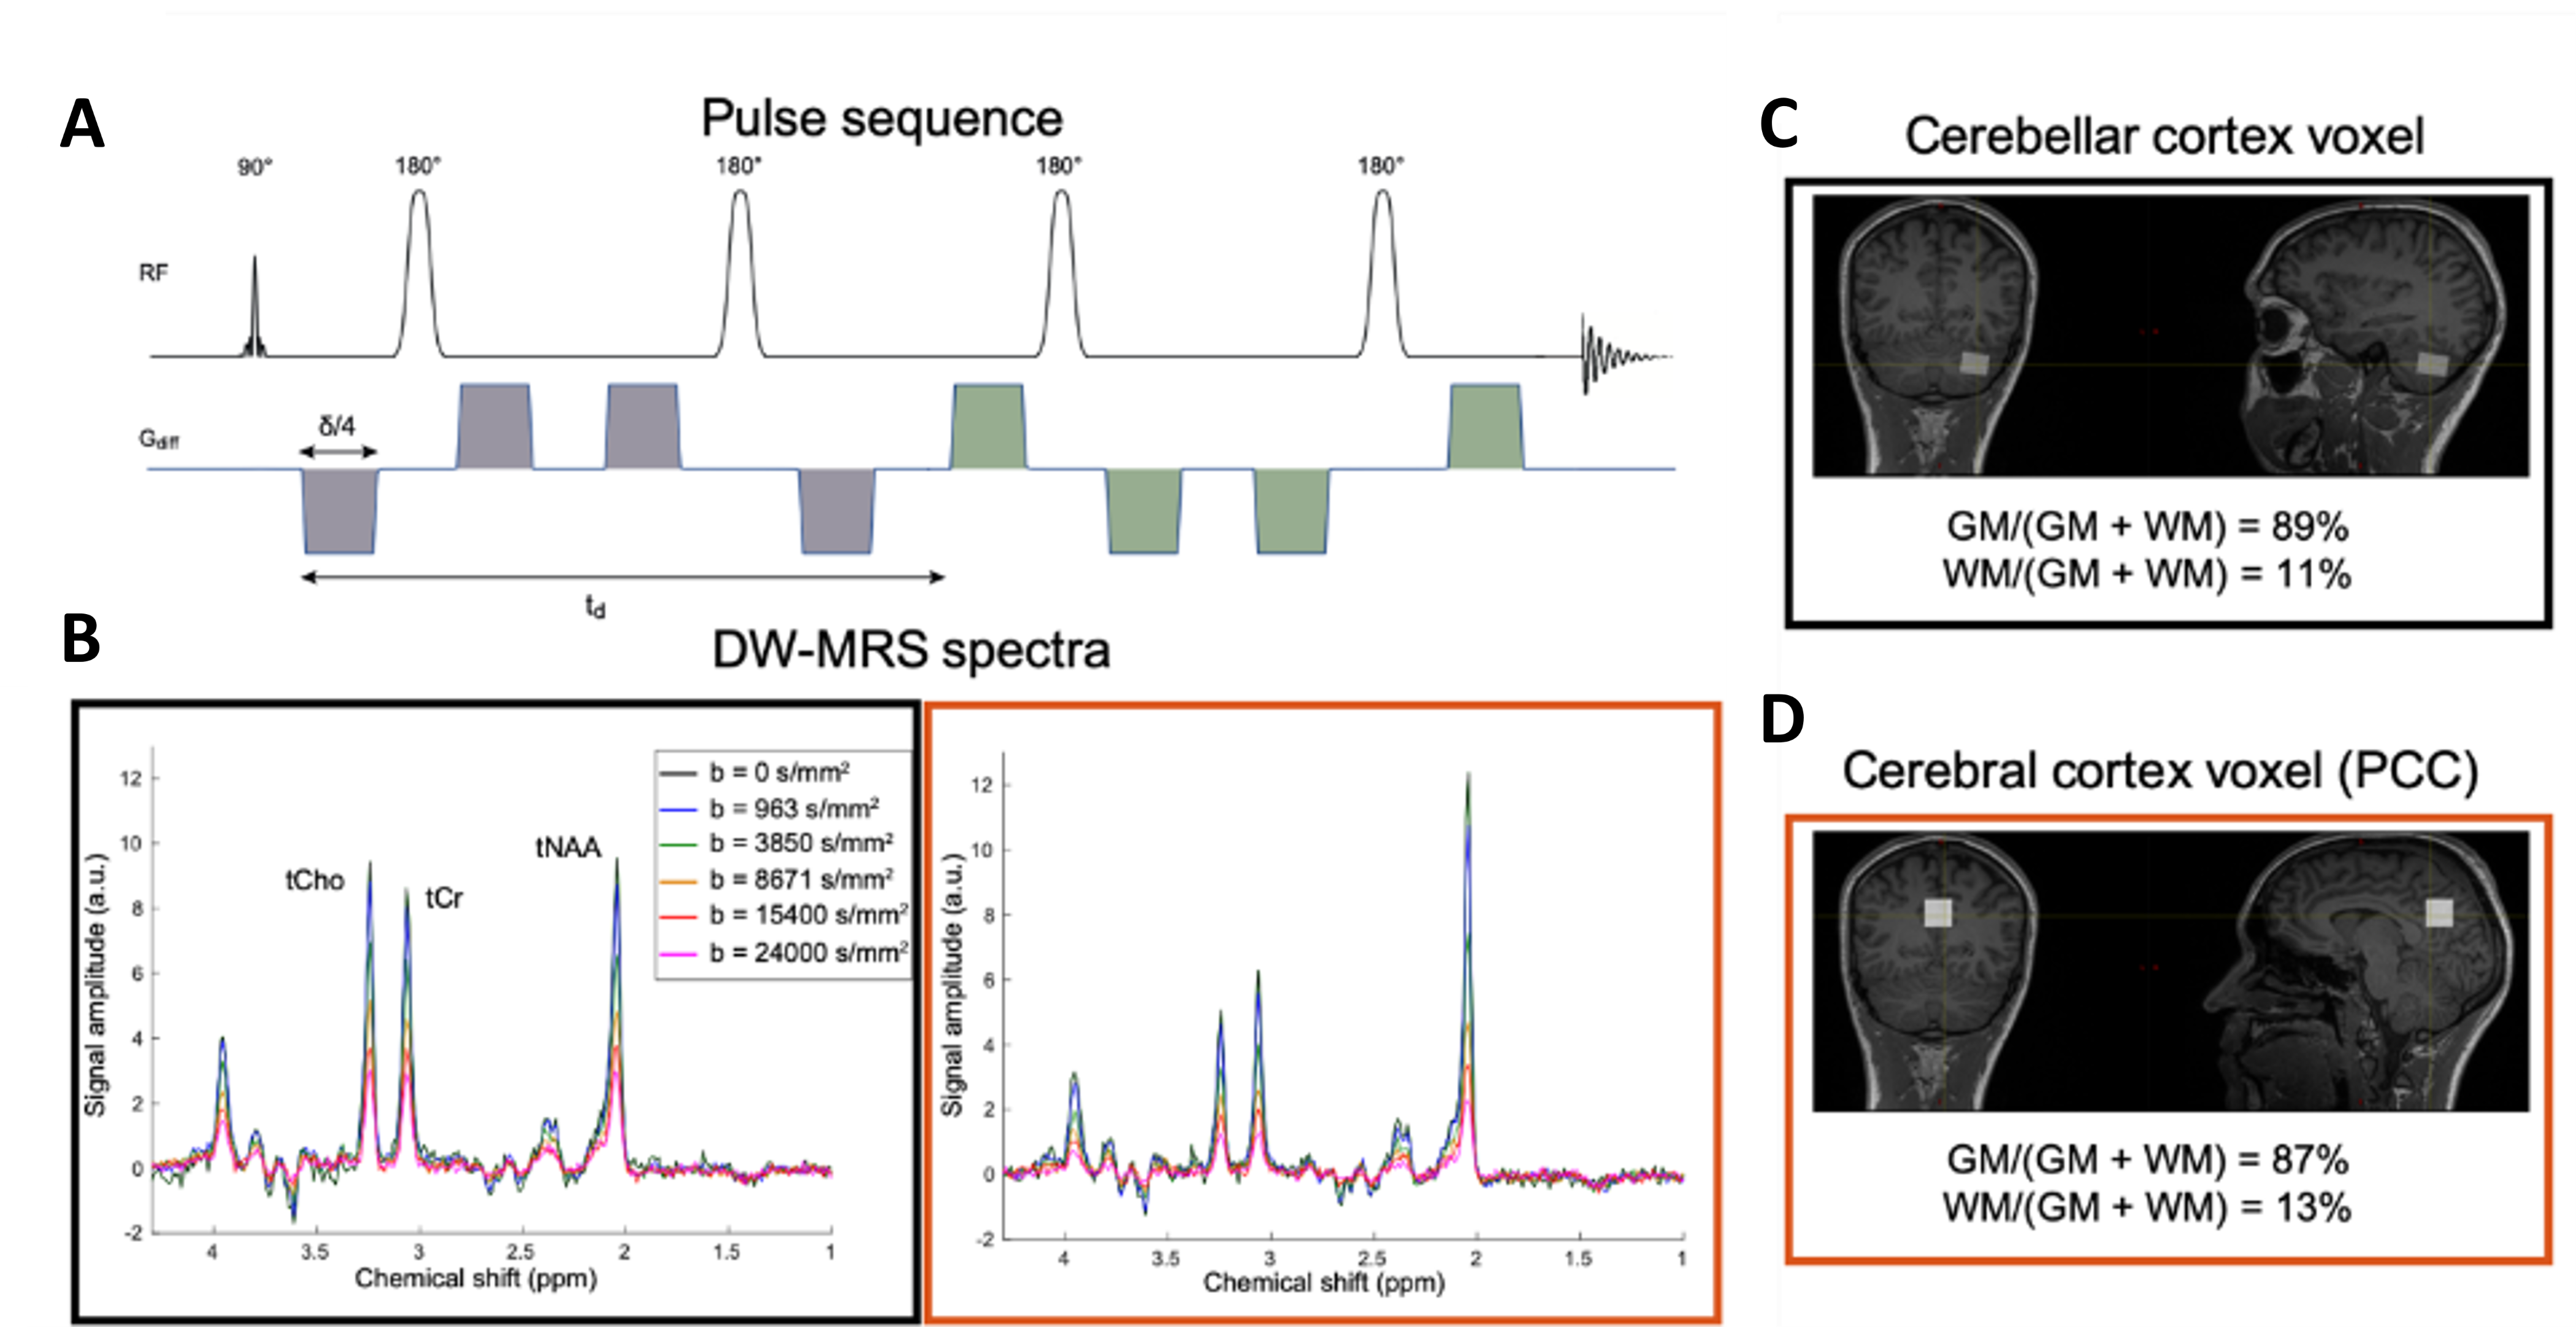
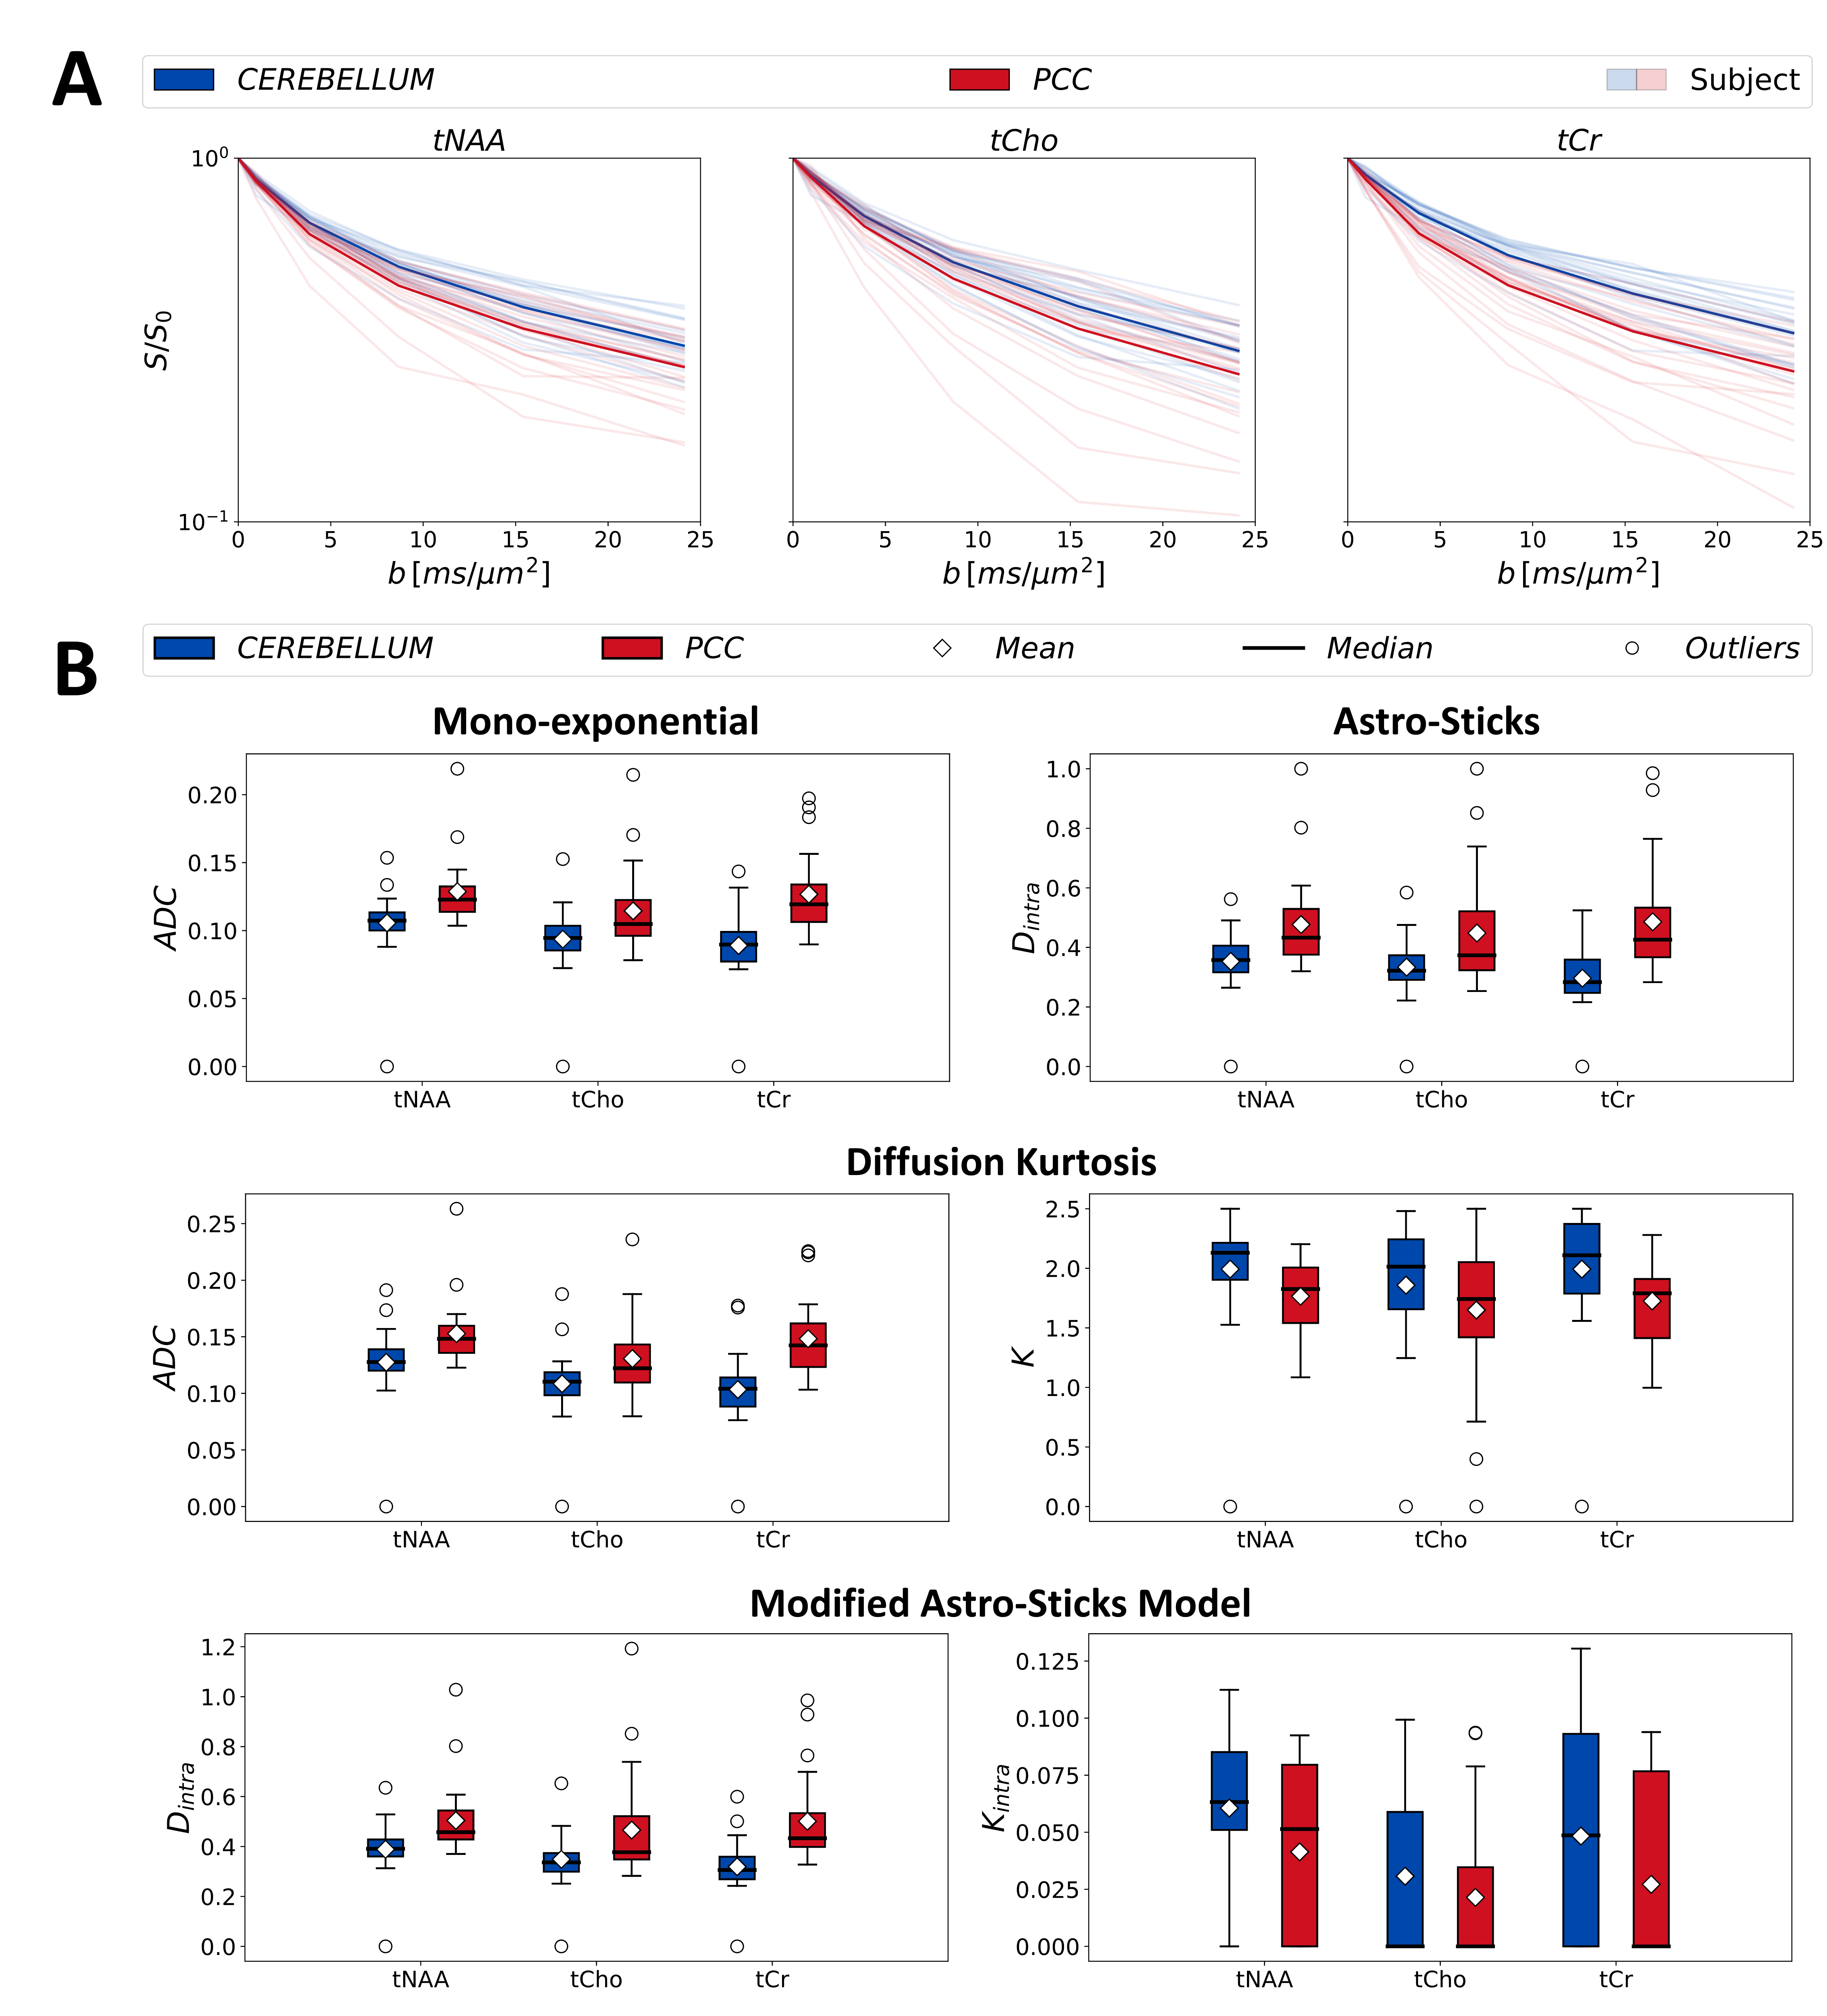
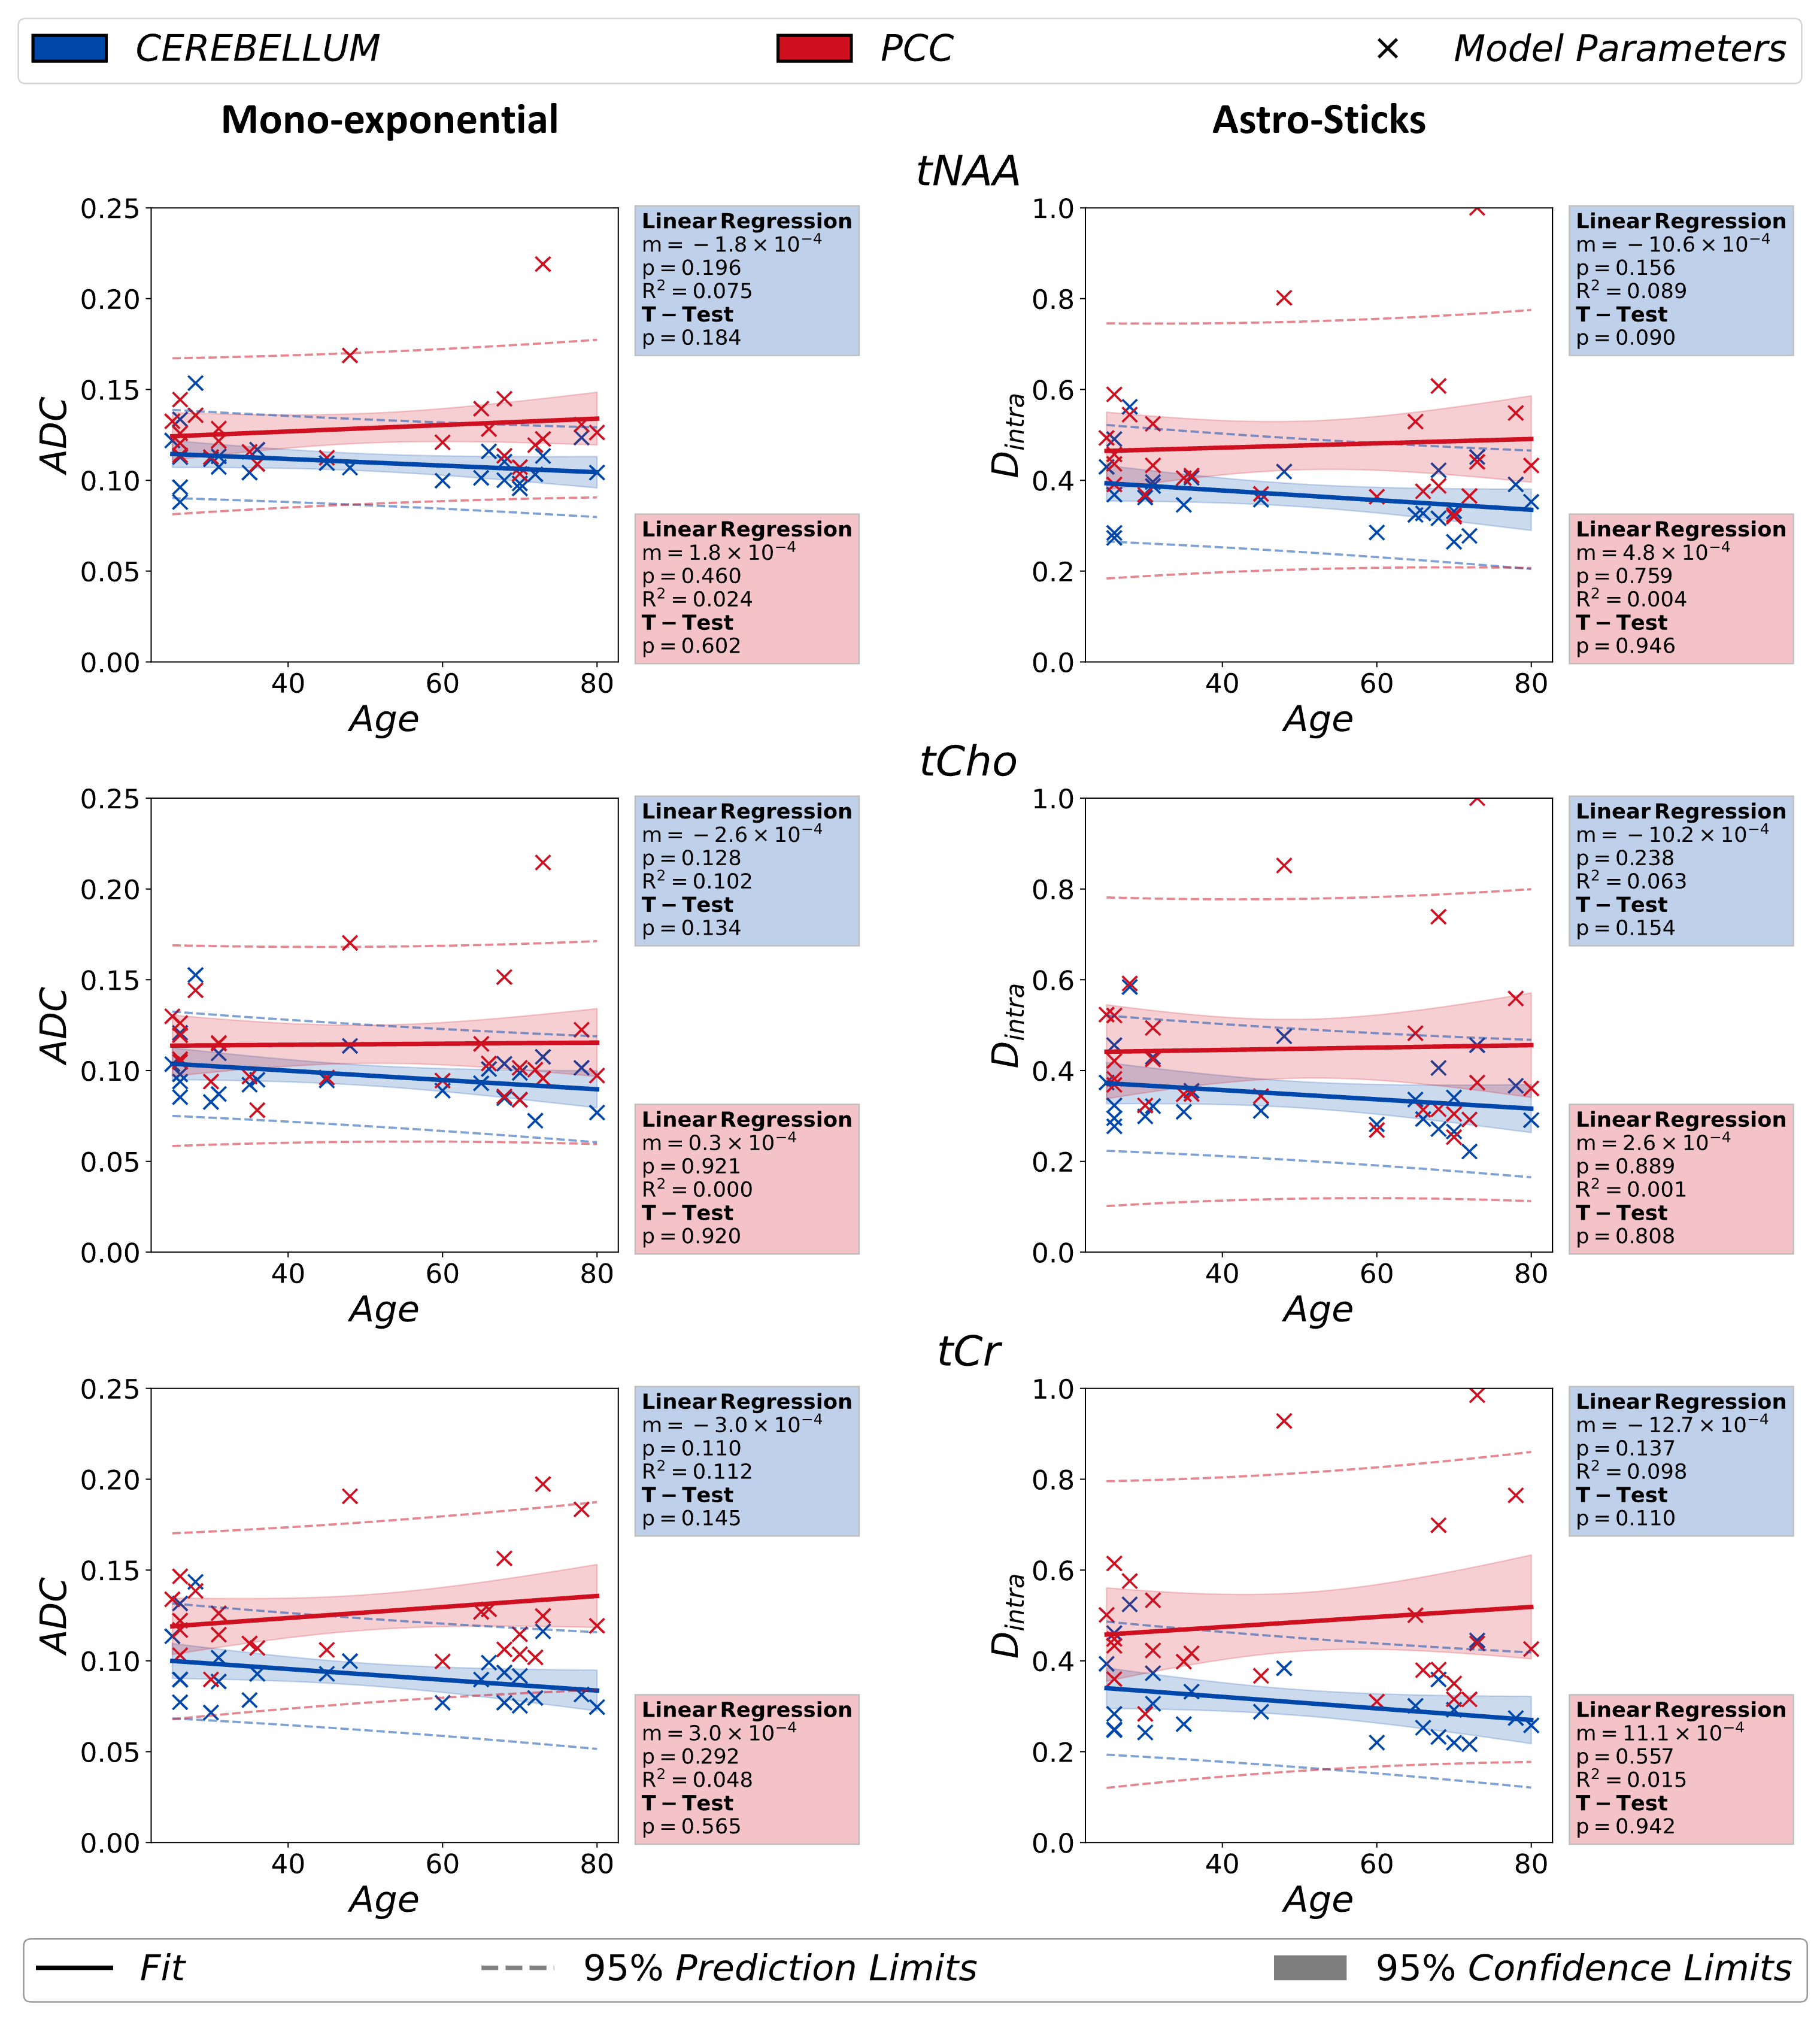
Figure 3: The results obtained mono-exponential signal analysis ($$$b$$$<5ms/μm2), ($$$ADC$$$) and astro-stick model ($$$D_{intra}$$$) are documented in the figure. The independent T-test analysis performed between two groups [age < 50 and age ≥ 50] do not report any statistically significant change in these parameters with aging. The p-value in linear regression is a measure for how significant the estimated slope is in the analysis.
(p*<0.00833 indicates statistical significance for the T-test)
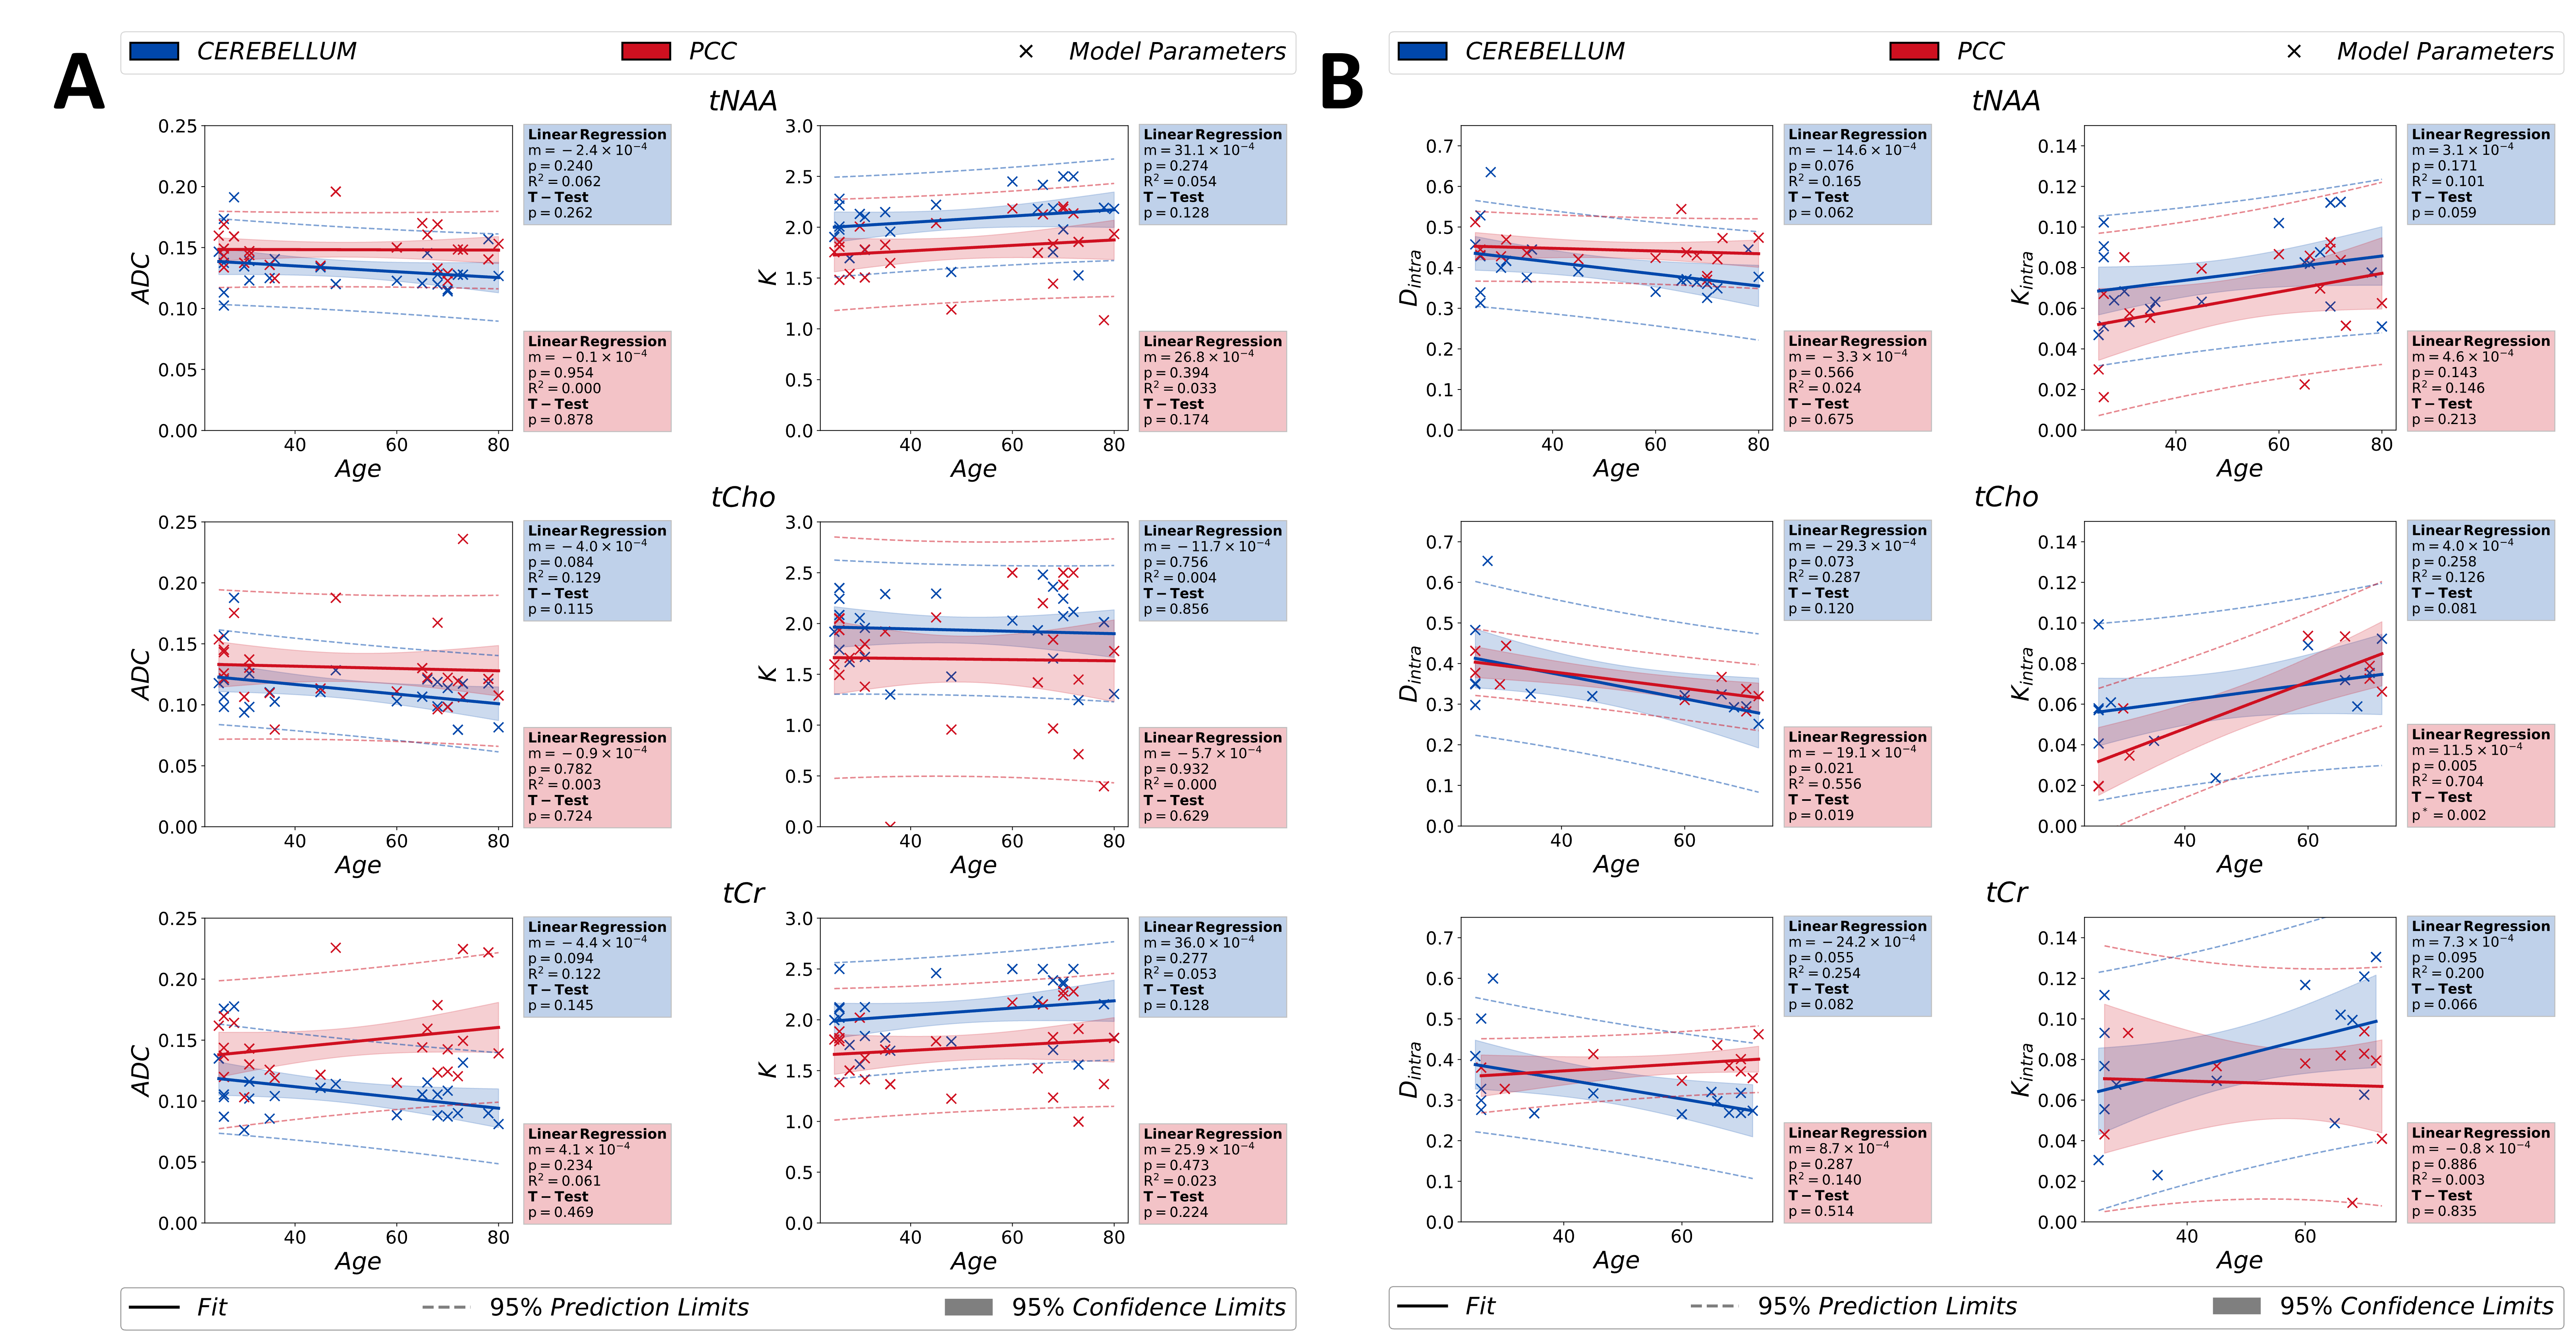
Figure 4: Age dependences of the estimated model parameters for kurtosis ($$$ADC$$$ & $$$K$$$) in (A) and modified astro-stick model ($$$D_{intra}$$$& $$$K_{intra}$$$) in (B), obtained from studied metabolite signals, are depicted in the figure. Statistical analyses are performed between two groups [age < 50 and age ≥ 50] to analyse statistical significance in the age-related variations of estimated parameters. For statistical tests, the confidence and prediction limits are also depicted in the figure.
(p*<0.00833 indicates statistical significance for the T-test)
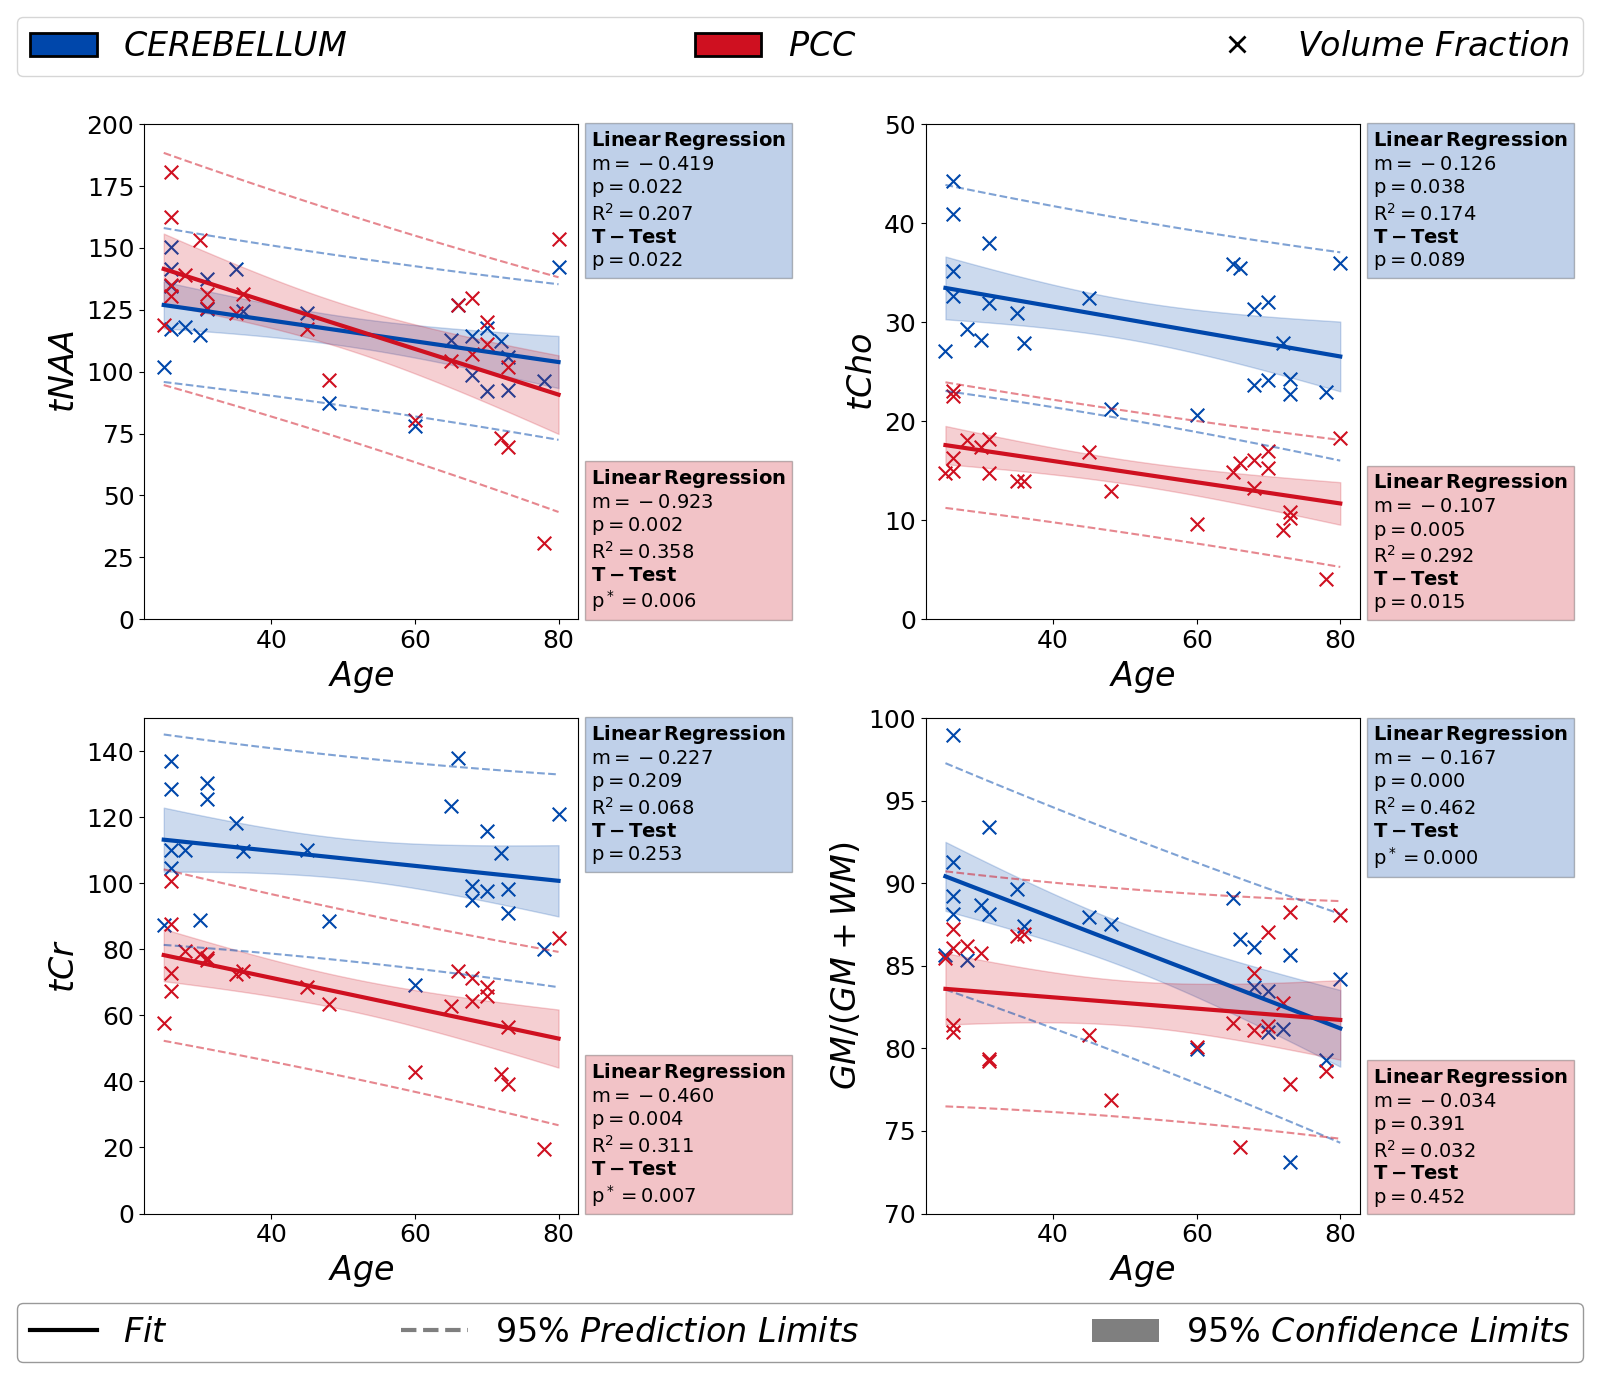
Figure 5: Metabolite areas and the GM volume fraction are analyzed for possible variations with age in both regions of interest (red: PCC and blue: Cerebellum). Metabolite areas are obtained from LCModel fit results of non-DW spectra. The results of the independent T-test between two groups [age < 50 and age ≥ 50] are also reported in the figure. In PCC, the decrease in metabolite areas is significant, except tCho. Additionally, a statistically significant decrease in relative GM volume fraction is reported in the figure.
(p*<0.00833 indicates statistical significance for the T-test)