3870
Multi-scale cortical morphometry reveals pronounced regional and scale-dependent variations across the lifespan1Newcastle University, Newcastle upon Tyne, United Kingdom
Synopsis
Keywords: Aging, Quantitative Imaging, multi-scale, cortical morphometry, normative modelling
Motivation: Brains are fractal-like objects, with shape information distributed across length scales. Accurate and comprehensive descriptions of healthy ageing effects are needed to study and compare other processes such as neurological disorders.
Goal(s): We utilise fractal properties and multi-scale information to give a more thorough and accurate description of morphological changes due to healthy ageing.
Approach: We compute shape metrics as scale-dependent variables and infer ageing trajectories across the lifespan, contrasting scale-dependent and regional differences.
Results: Different length scales highlight different aspects of ageing effects, and regional differences in ageing trajectories are more pronounced at coarser scales.
Impact: Our multi-scale description of lifespan healthy ageing effects on cortical morphology reveals complementary information contained in different spatial scales and can be used as a normative model in future. Viewing morphometrics as functions of length scale reconceptualises quantitative morphometry.
Using MRI from subjects aged 6-88 years from NKI (n=833) and CamCAN (n=641), we computed several morphology metrics at spatial scales ranging from 0.32 mm to 3 mm. These were obtained at both the cortical hemisphere and lobe level. We used generalised additive mixed models (GAMMs) to account for site differences before extracting age trajectories.
On the level of whole cortical hemispheres, lifespan trajectories show diverging and even opposing trends at different spatial scales, in contrast to the monotonic decreases of volume and thickness described so far. Pronounced regional differences between lobes also became apparent in scales over 0.7 mm. In a proof-of-principle application, we compared brain age estimations based on a single metric (pial surface area) computed at a single scale vs. multiple scales. Using two complementary scales improved brain age estimates in RMSE by about 5 years.
Our study provides a comprehensive description of lifespan effects on cortical morphology in an age range from 6-88 years. In future, this can be used as a normative model to compare individuals or cohorts, hence identifying morphological abnormalities. Our results reveal the complementary information contained in different spatial scales, demanding that morphometrics should not be considered as mere numbers, but as functions of length scale.
Acknowledgements
No acknowledgement found.References
No reference found.Figures
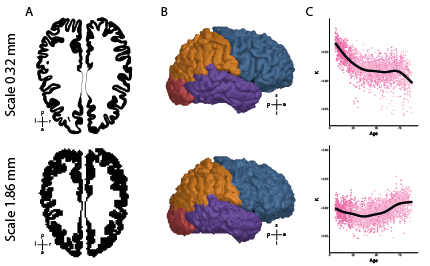
Computation of lifespan trajectories in scale-dependent morphometrics in cortical regions.
Algorithm is shown for two example scales, 0.32 mm (top row) and 1.86 mm (bottom row). The algorithm was repeated for scales between 0.32 mm and 3 mm. A) Coarse-grained grey matter and white matter volumes. B) Reconstructed grey matter surfaces, with lobes labelled using the nearest point on the original FreeSurfer reconstruction. C) Harmonisation across sites and inference of lifespan trajectories of tension K with GAMM models.
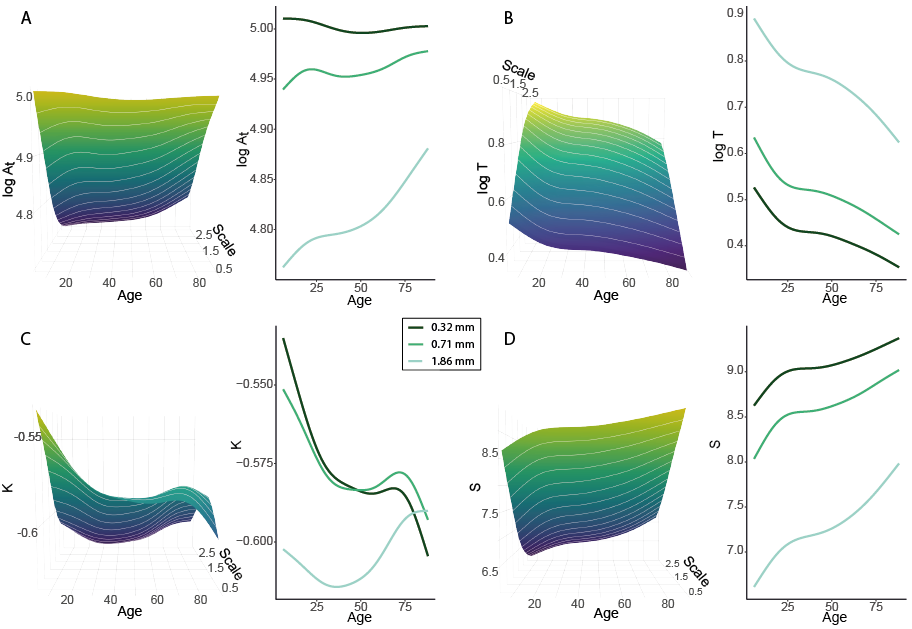
Lifespan effects on cortical hemispheres measured in scale-dependent morphometrics.
A) Pial surface area log(At/mm^2). B) Average cortical thickness log(T/mm). C) Dimensionless metric K. D) Dimensionless metric S.
Sheets (left) show trajectories as functions of scales between 0.32 mm and 3 mm. Line graphs show trajectories for three scales 0.32 mm, 0.71 mm, and 1.86 mm, where lighter colour indicates a larger scale used for the coarse-graining procedure.
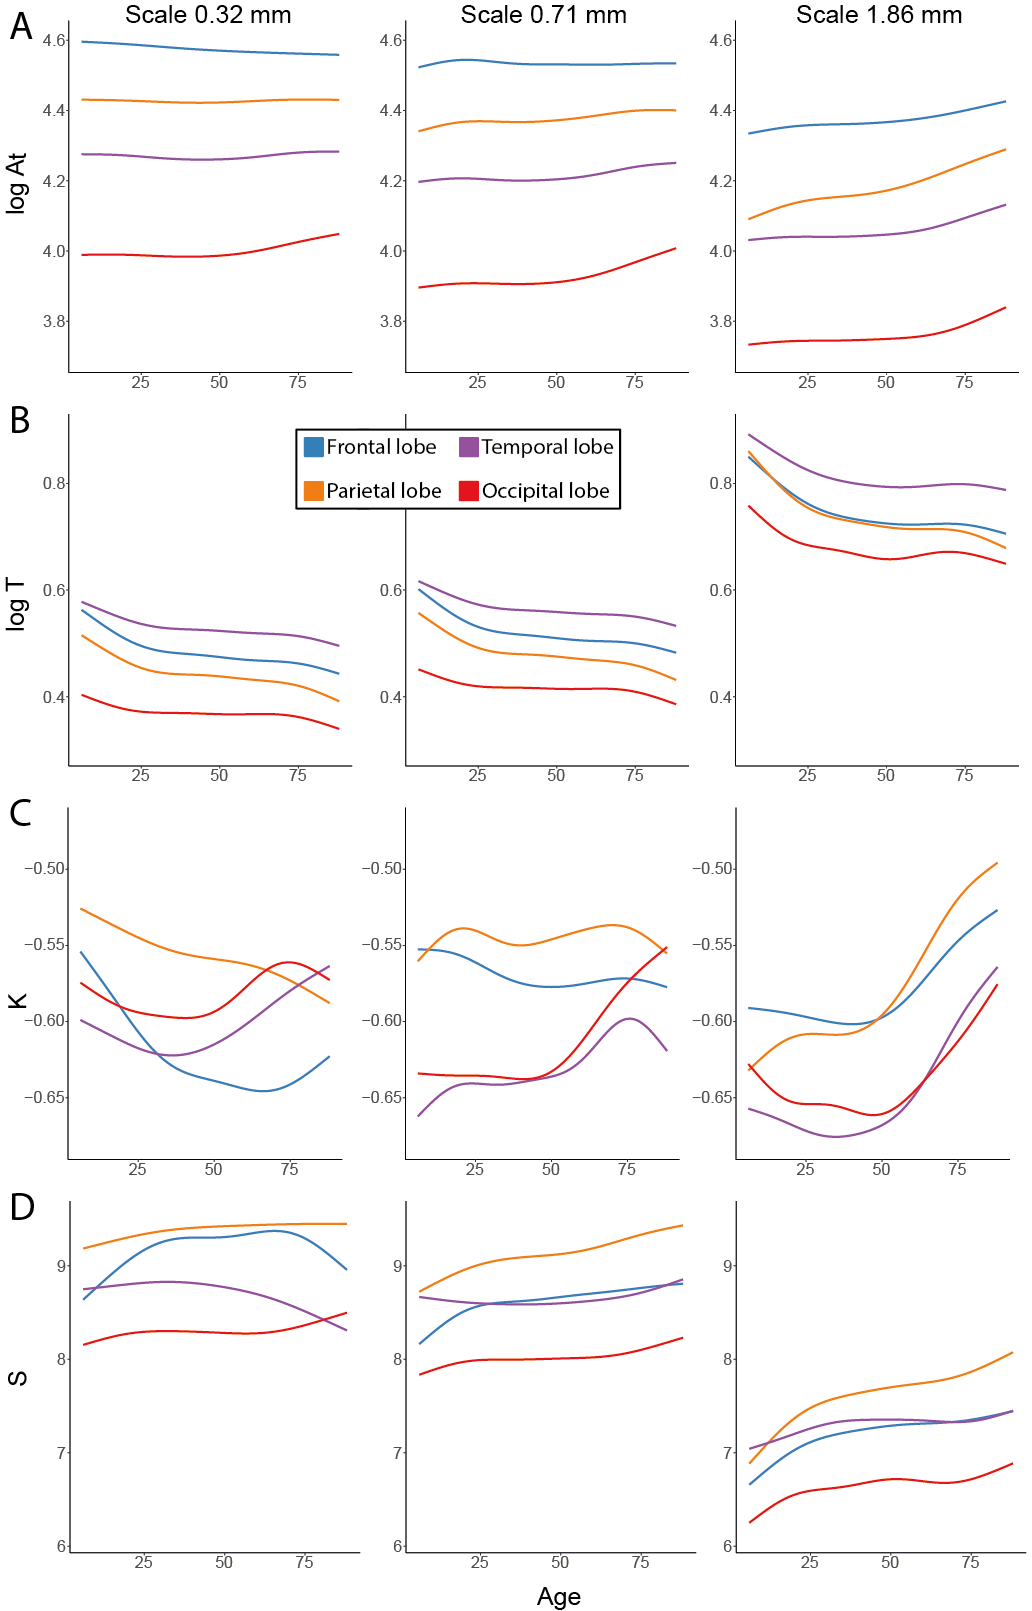
Lifespan effects in main lobes measured in scale-dependent metrics.
Columns show trajectories in spatial scales 0.32 mm, 0.71 mm, and 1.86 mm. A) Pial surface area log(A_t/mm^2). B) Average cortical thickness log(T/mm). C) Dimensionless metric K. D) Dimensionless metric S.
Colours indicate individual trajectories of cortical lobes.