3869
Anatomical subcortical estimates are highly consistent over time but significantly different for midlife adults compared to older adults1Department of Medical Biophysics, University of Toronto, Toronto, ON, Canada, 2Hurvitz Brain Science Research Program, Sunnybrook Research Institute, Toronto, ON, Canada, 3Department of pharmacology and toxicology, University of Toronto, Toronto, ON, Canada, 4Department of Education, ICT and Learning, Østfold University College, Halden, Norway, 5Department of Medicine, University of Toronto, Toronto, ON, Canada
Synopsis
Keywords: Aging, Aging, Longitudinal MRI
Motivation: Longitudinal MRI is used to quantify brain atrophy over time, yet more work is needed to understand factors that contribute these trajectories.
Goal(s): To use repeat anatomical MRI to predict subcortical volume changes at follow-up and test whether these data are more consistent in midlife adults than older adults.
Approach: We estimated subcortical MRI volumes in 100 midlife and 132 older adults and compared consistency between the two groups.
Results: We found strong associations between initial and repeat MRI. The midlife group showed higher consistency in subcortical volume estimates than the older group.
Impact: We demonstrated that we could use baseline MRI estimates to predict subcortical anatomical change over 2.3 years within UK Biobank midlife and older populations, while the older adults showed lower consistency in MRI anatomical estimates than midlife adults.
Introduction
Our world is experiencing a growth of the older population, from 700 million in 2019 to an estimated 1.5 billion in 2050.1 The availability of longitudinal neuroimaging, automatic segmentation tools, and large sample sizes each help to reveal brain changes that part of aging. Although subcortical volume estimates are robust, sources of variability can influence the reliability of the repeated measure. 2 Our study aims to predict the trajectory of subcortical volumes and examine the effect of age subgroups. We developed a metric of data consistency between baseline and follow-up. Four subcortical regions were selected: hippocampus, thalamus, amygdala, and the caudate nucleus. We hypothesize that data consistency over time will be higher in the midlife group compared to the older group.Method
We accessed the T1w MRI data from participants who completed two UK Biobank imaging sessions in 2.25±0.12 years. Subgroups were created by randomly selecting 100 midlife adults between 50 and 55 (52.2±1.8 years) and 132 older adults between 60 and 65 (62.0±1.4 years). We reviewed the medical records and excluded participants diagnosed with mild cognitive impairments, dementia, and traumatic brain injury. Both initial and repeat T1w images were acquired on a Siemens Magnetom Skyra 3T scanner using a 5-minute 3D MPRAGE EPI pulse sequence (TR/TE/IR = 2000ms/2.01ms/880ms, iPAT=2, flip angle = 8°, FOV=208x256x256 mm). We estimated the hippocampus, thalamus, amygdala, and caudate nucleus volume using the FIRST toolbox from FMRIB’s software library. We used a multivariable linear model (Model 1) to predict the repeat brain volume estimates using initial estimates. We then investigated the consistency of MRI scans using the same linear model to show the association between the initial and the repeat MRI estimates within midlife and older groups. We calculated the standardized beta (B) from the beta weights (β) of the initial volume estimates in Model 1 using Equation 1.- Repeat volume estimates = β · Initial volume estimates + Sex + Brain volume (Model 1)
- B = SD(Initial estimate) / SD(Repeat estimate) · β (Equation 1)
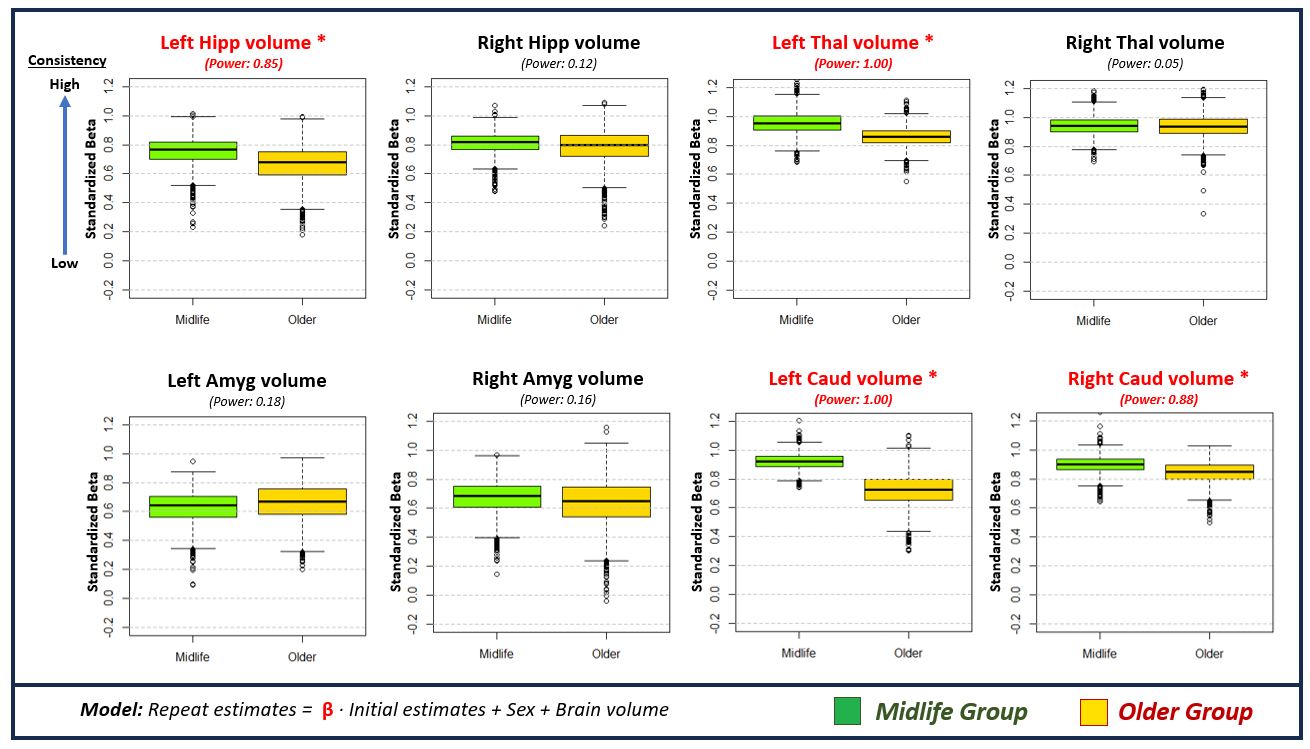
To generate a consistency metric within each group, we used a bootstrap method (subsample = 30, 30 repeats) that produces a distribution of standardized beta per group. A Wilcoxon rank-sum statistic was tested for group differences. The bootstrap process was repeated 100 times, yielding a Wilcoxon test result each time. The primary hypothesis was significant if the statistical power reached 0.80.
Results
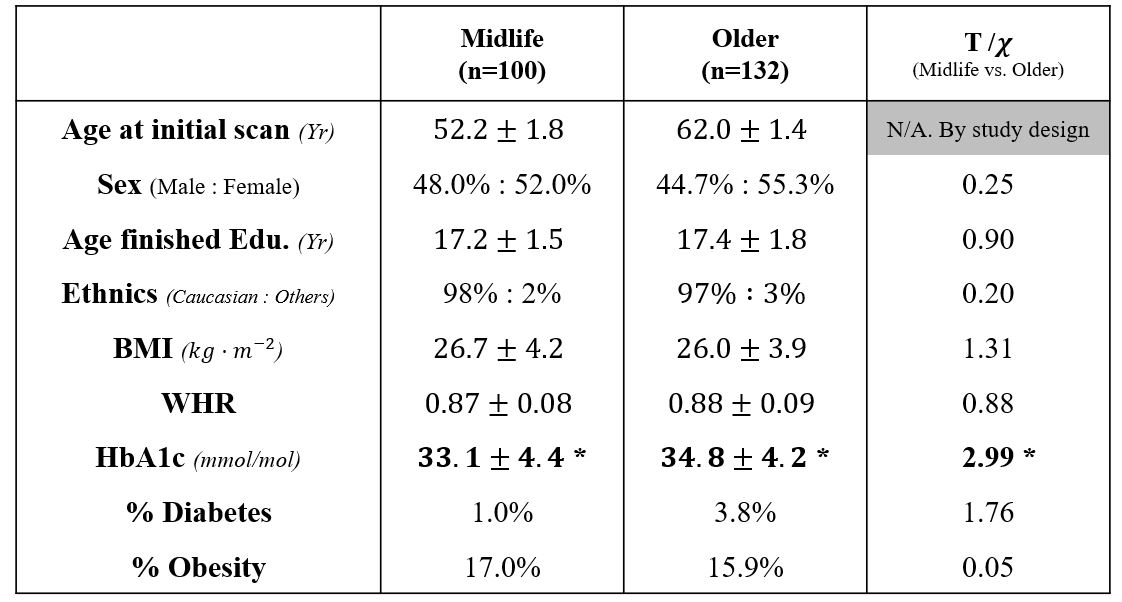
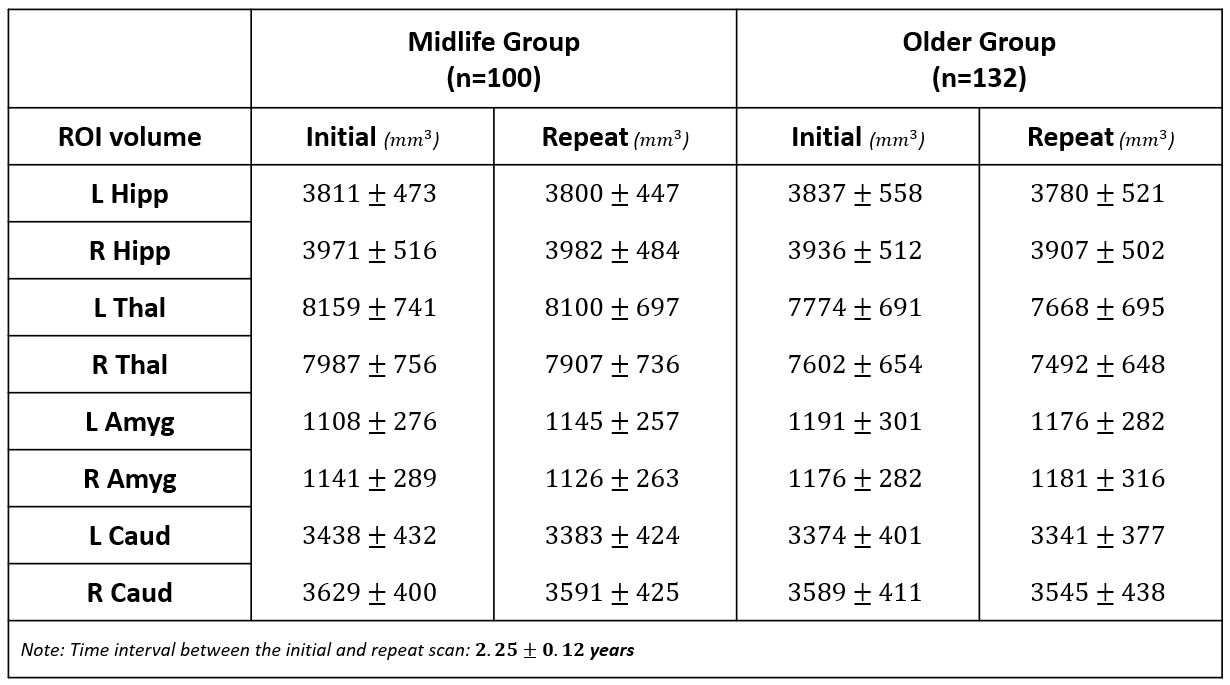
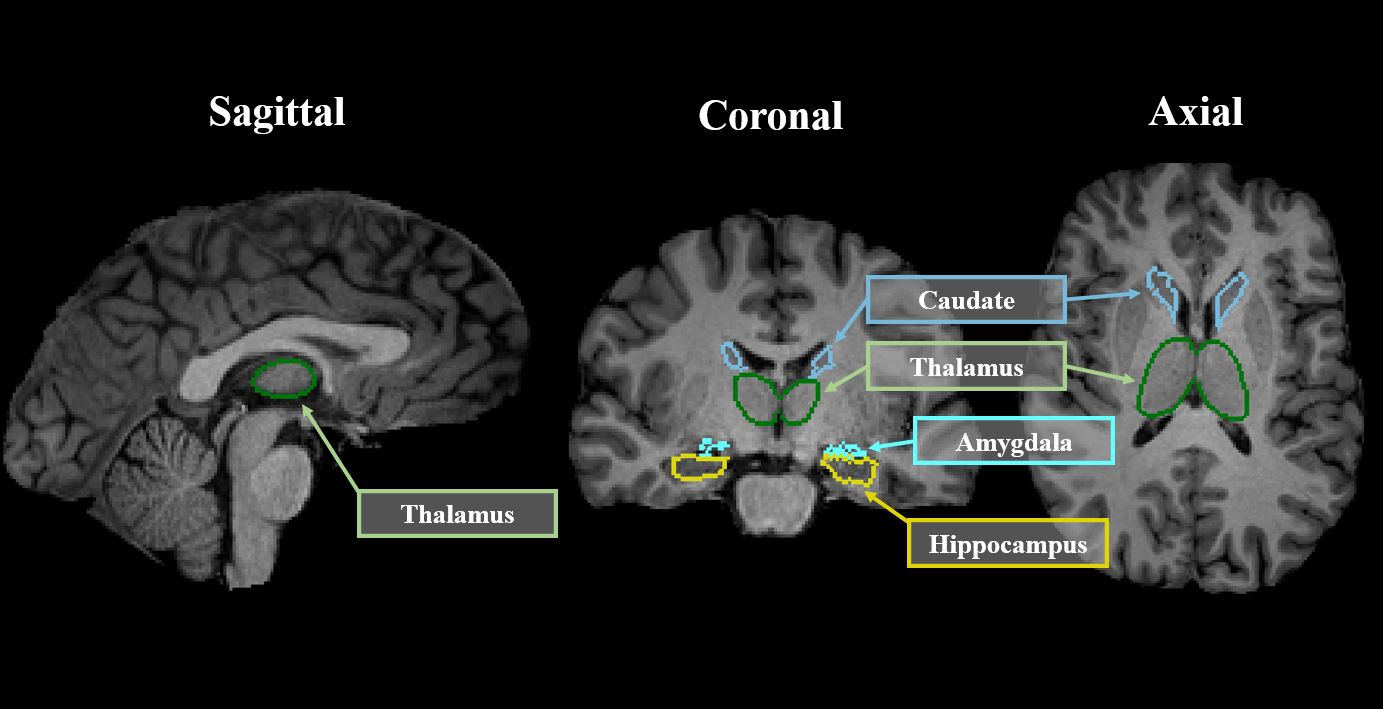
Table 1 summarizes the demographic details for the two groups. There were no group differences in sex, education, ethnic groups, and obesity-related measures, while the older group had higher HbA1c than the midlife group (P<0.05). Table 2 summarizes brain volume estimates from two MRI sessions. Figure 1 shows subcortical segmentations for a representative participant. Figure 2 shows the results of the consistency analysis, where the distributions of standardized beta from Model 1 are provided for each group. The older group showed lower consistency than the midlife group in the left hippocampus, left thalamus, and bilateral caudate volume estimates, but not in the amygdala.Discussions
We found strong positive associations between the initial and repeat anatomical estimates, as reflected in high overall model R2 values, indicating the value of repeat anatomical studies that use T1w MRI-derived estimates. Namely, it is feasible to predict the trajectory of subcortical volumes using repeat T1w anatomical MRI. The caveat to this finding is that older adults showed lower consistency in all subcortical brain regions we investigated, except for the bilateral amygdala. One source of variations could be due to the choice of the automatic segmentation tool, and future work is warranted.3 The older adults showed lower consistency of MRI anatomical estimates within the three left hemisphere ROIs and one right hemisphere ROI. These asymmetrical consistency findings align with past neuroscience literature that shows the association among cognitive impairments, left thalamic atrophy, and left hippocampal atrophy. 4-5 In future studies, we will further explore the trajectory of MRI anatomical estimates within the aging population and investigate improvements in automatic segmentation scripts for higher consistency.Acknowledgements
We acknowledge the funding from Canadian Institutes of Health Research.References
[1] Estebsari F, Dastoorpoor M, Khalifehkandi ZR, et al. The Concept of Successful Aging: A Review Article. Curr Aging Sci. 2020;13(1):4-10. doi:10.2174/1874609812666191023130117
[2] Maclaren J, Han Z, Vos SB, Fischbein N, Bammer R. Reliability of brain volume measurements: a test-retest dataset. Sci Data. 2014;1:140037. Published 2014 Oct 14. doi:10.1038/sdata.2014.37
[3] Schoemaker D, Buss C, Head K, et al. Hippocampus and amygdala volumes from magnetic resonance images in children: Assessing accuracy of FreeSurfer and FSL against manual segmentation [published correction appears in Neuroimage. 2018 Feb 21;173:1-2]. Neuroimage. 2016;129:1-14. doi:10.1016/j.neuroimage.2016.01.038
[4] Low A, Mak E, Malpetti M, et al. Asymmetrical atrophy of thalamic subnuclei in Alzheimer's disease and amyloid-positive mild cognitive impairment is associated with key clinical features. Alzheimers Dement (Amst). 2019;11:690-699. Published 2019 Oct 1. doi:10.1016/j.dadm.2019.08.001
[5] Kilpatrick C, Murrie V, Cook M, Andrewes D, Desmond P, Hopper J. Degree of left hippocampal atrophy correlates with severity of neuropsychological deficits. Seizure. 1997;6(3):213-218. doi:10.1016/s1059-1311(97)80008-8
Figures