3868
Brain asymmetries from midlife to old adulthood and hemispheric brain age1Department of Health and Functioning, Western Norway University of Applied Sciences, Bergen, Norway, 2NORMENT Centre for Psychosis Research, Division of Mental Health and Addiction, University of Oslo and Oslo University Hospital, Oslo, Norway, 3Mohn Medical Imaging and Visualization Centre (MMIV), Bergen, Norway, 4Faculty of Health, Medicine and Life Sciences, Maastricht University, Maastricht, Netherlands, 5Department of Psychiatric Research, Diakonhjemmet Hospital, Oslo, Norway, 6Department of Psychology, University of Oslo, Oslo, Norway, 7LREN, Centre for Research in Neurosciences - Department of Clinical Neurosciences, CHUV and University of Lausanne, Lausanne, Switzerland, 8Department of Psychiatry, Oxford University, Oxford, United Kingdom, 9Department of Radiology, Haukeland University Hospital, Bergen, Norway, 10Department of Biomedicine, University of Bergen, Bergen, Norway, 11KG Jebsen Centre for Neurodevelopmental Disorders, University of Oslo, Oslo, Norway
Synopsis
Keywords: Aging, Aging, Asymmetry
Motivation: The human brain demonstrates structural and functional asymmetries which have implications for ageing and the development of mental and neurological diseases. Age-relationships
of these asymmetries are largely unknown.
Goal(s): We aimed to map brain asymmetries from midlife to older ages and develop hemispheric
brain age (HBA) models, which consider apparent hemispheric differences.
Approach: We used structural and diffusion magnetic resonance imaging metrics (N=48,040, UK Biobank) to evaluate the age-relationship of brain asymmetry.
Results: Most metrics indicated asymmetry, which appears lower at higher age in white matter and
higher in grey matter. HBA reflects other brain ages and unique information of each hemisphere.
Impact: We present for the first time comprehensive analyses of brain asymmetries throughout midlife and older ages and establish a new conceptualisation of BrainAge. This ”hemispheric” BrainAge can serve as a marker of asymmetry by comparing left to right hemisphere-derived BrainAges.
Background
The brain demonstrates various age-sensitive asymmetries. Additionally, there are several differences in brain asymmetry between healthy controls and disease groups, including neurodegenerative diseases such as Alzheimer’s disease and Parkinson’s disease, and psychiatric disease such as obsessive–compulsive disorder. This outlines the clinical utility of assessments of brain asymmetry. Yet, a systematic mapping of grey and white matter asymmetries (i.e., across metrics) from midlife to old adulthood during healthy ageing is still missing1. Hence, we set out to map brain asymmetries throughout midlife to older ages and the relationship of such asymmetries with age. Furthermore, we extended the concept of brain age, the estimation of chronological age from sets of neuroimaging features, by differentiating between left and right brain ages estimated from diffusion-weighted, T1-weighted, and multimodal magnetic resonance imaging (MRI). Such extension was investigated in order to provide brain age estimates which not only reflect brain asymmetries but also allow for proxies of these asymmetries by comparing left to right brain ages.Methods
After applying a quality control pipeline2 (including corrections for noise, Gibbs-ringing, susceptibility-induced and motion distortions, and eddy current artefacts), and isotopic smoothing, we estimated conventional and advanced diffusion approaches. The diffusion approaches included Diffusion Tensor Imaging3, Diffusion Kurtosis Imaging4, the Spherical Mean Technique5 and its multi-compartment extension6, the Bayesian Rotationally Invariant Approach7, and White Matter Tract Imaging8. Tract-based spatial statistics in FSL9 were applied to estimate region and tract level averages across both the John Hopkins University tract and region atlases of multiple diffusion approaches10. For T1-weighted images, we select the Desikan-Killiany atlas11 as a parcellation scheme after using the standardized Freesurfer12 cortical reconstruction (recon-all) pipeline, which estimates metrics for volume, surface area and cortical thickness. From these estimated regional features, we select regions specific to either left and right hemisphere (discarding regions and tracts which cross hemispheres). We presented brain asymmetries from multimodal magnetic resonance imaging (MRI) UK Biobank13 (N > 39,500) data using the laterality index14 for region-averaged and global grey and white matter microstructure metrics. We furthermore showed how to leverage brain asymmetries by estimating hemispheric brain age from the left and right hemisphere separately instead of from the whole brain. Finally, we assessed whether the laterality index of hemispheric brain age is similarly age-associated as the laterality index of brain features.Results
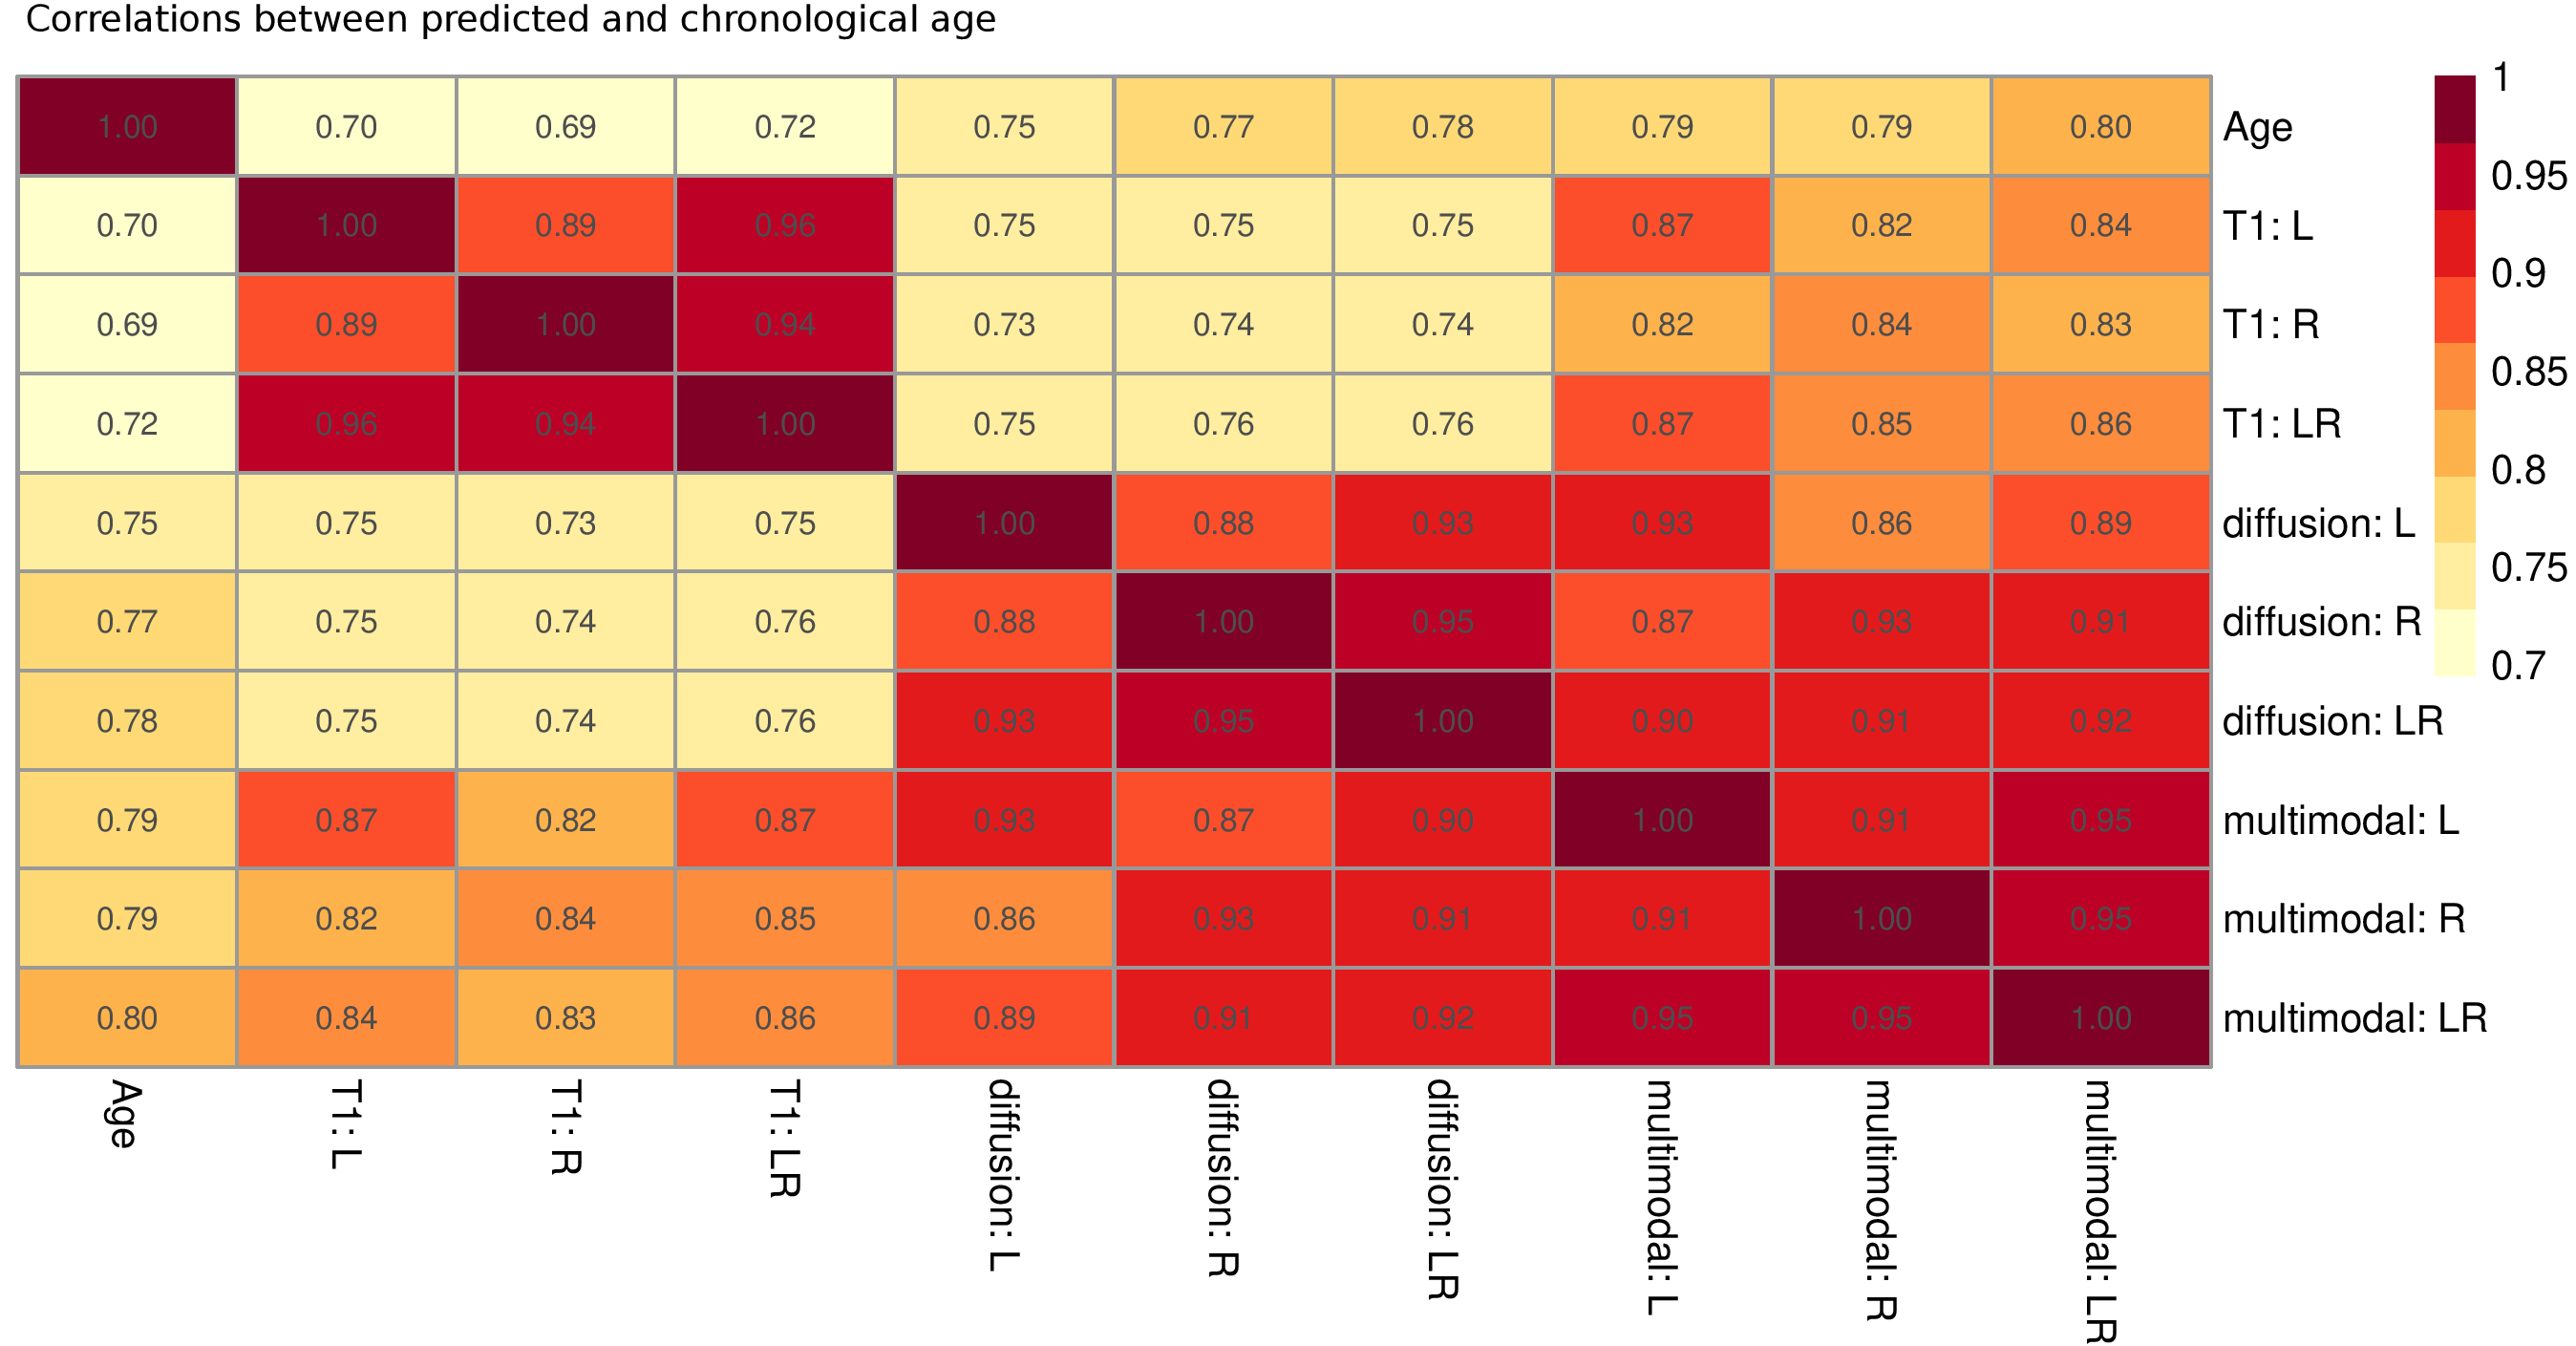
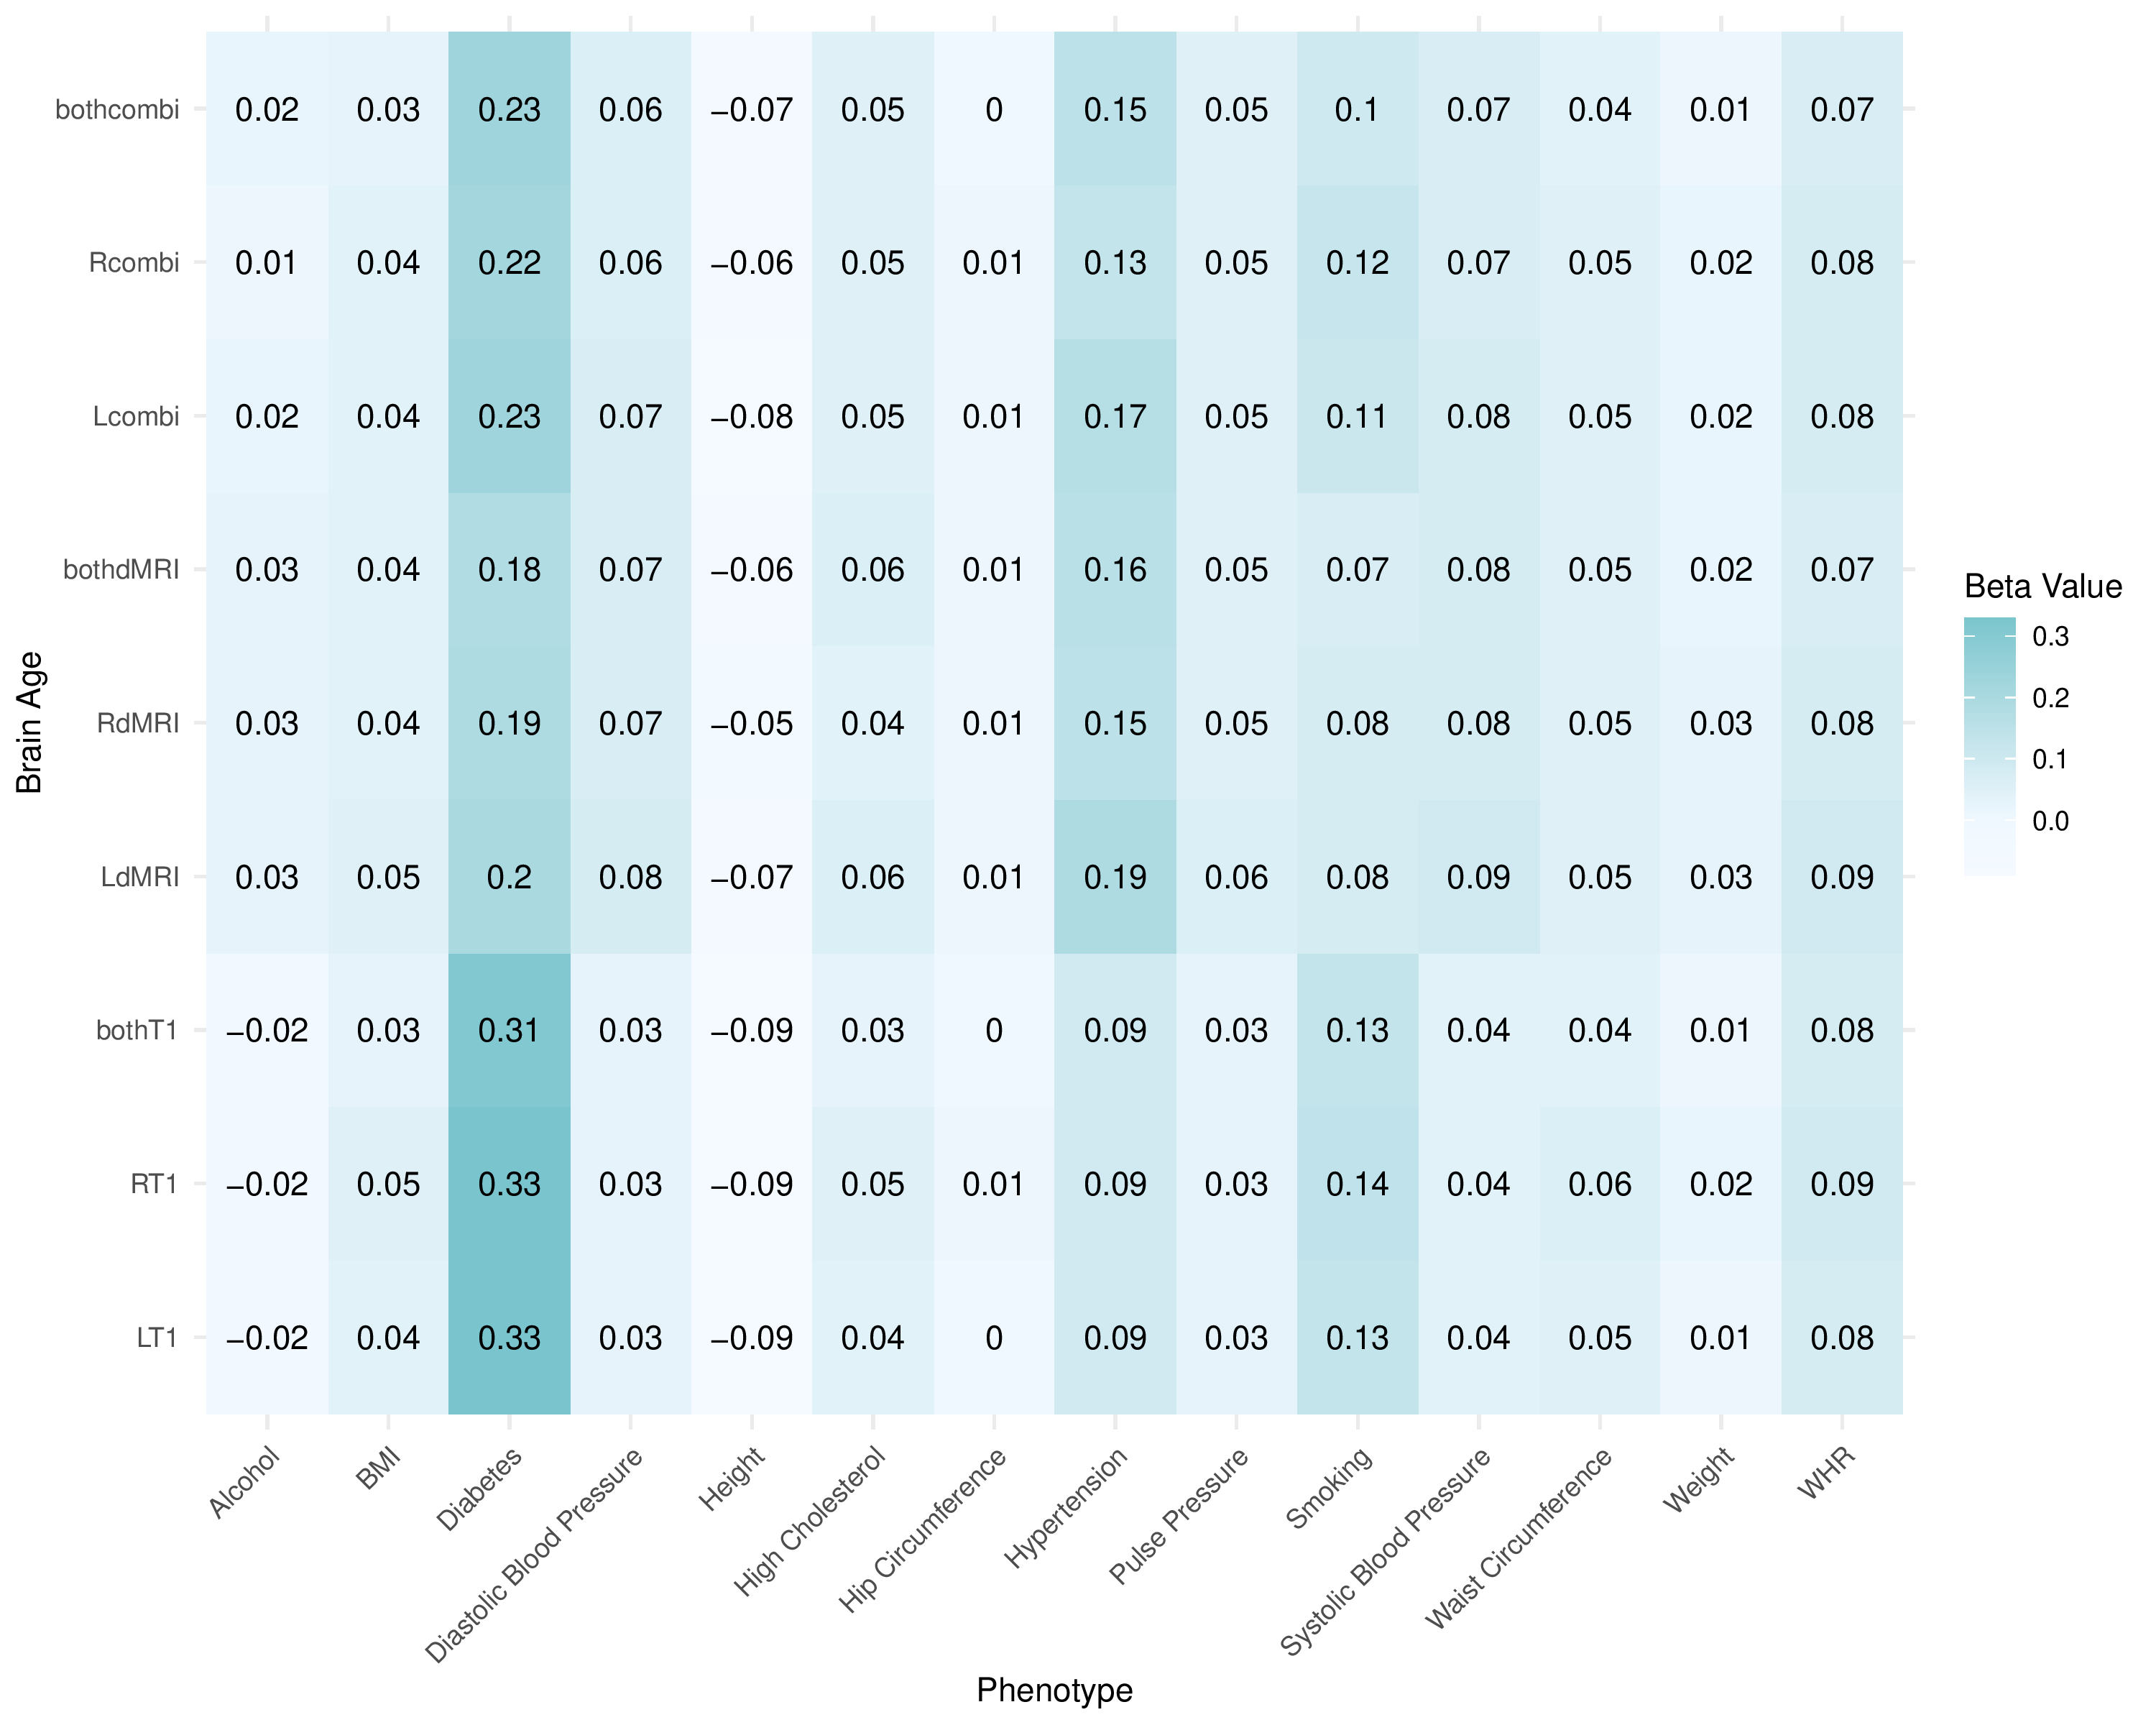
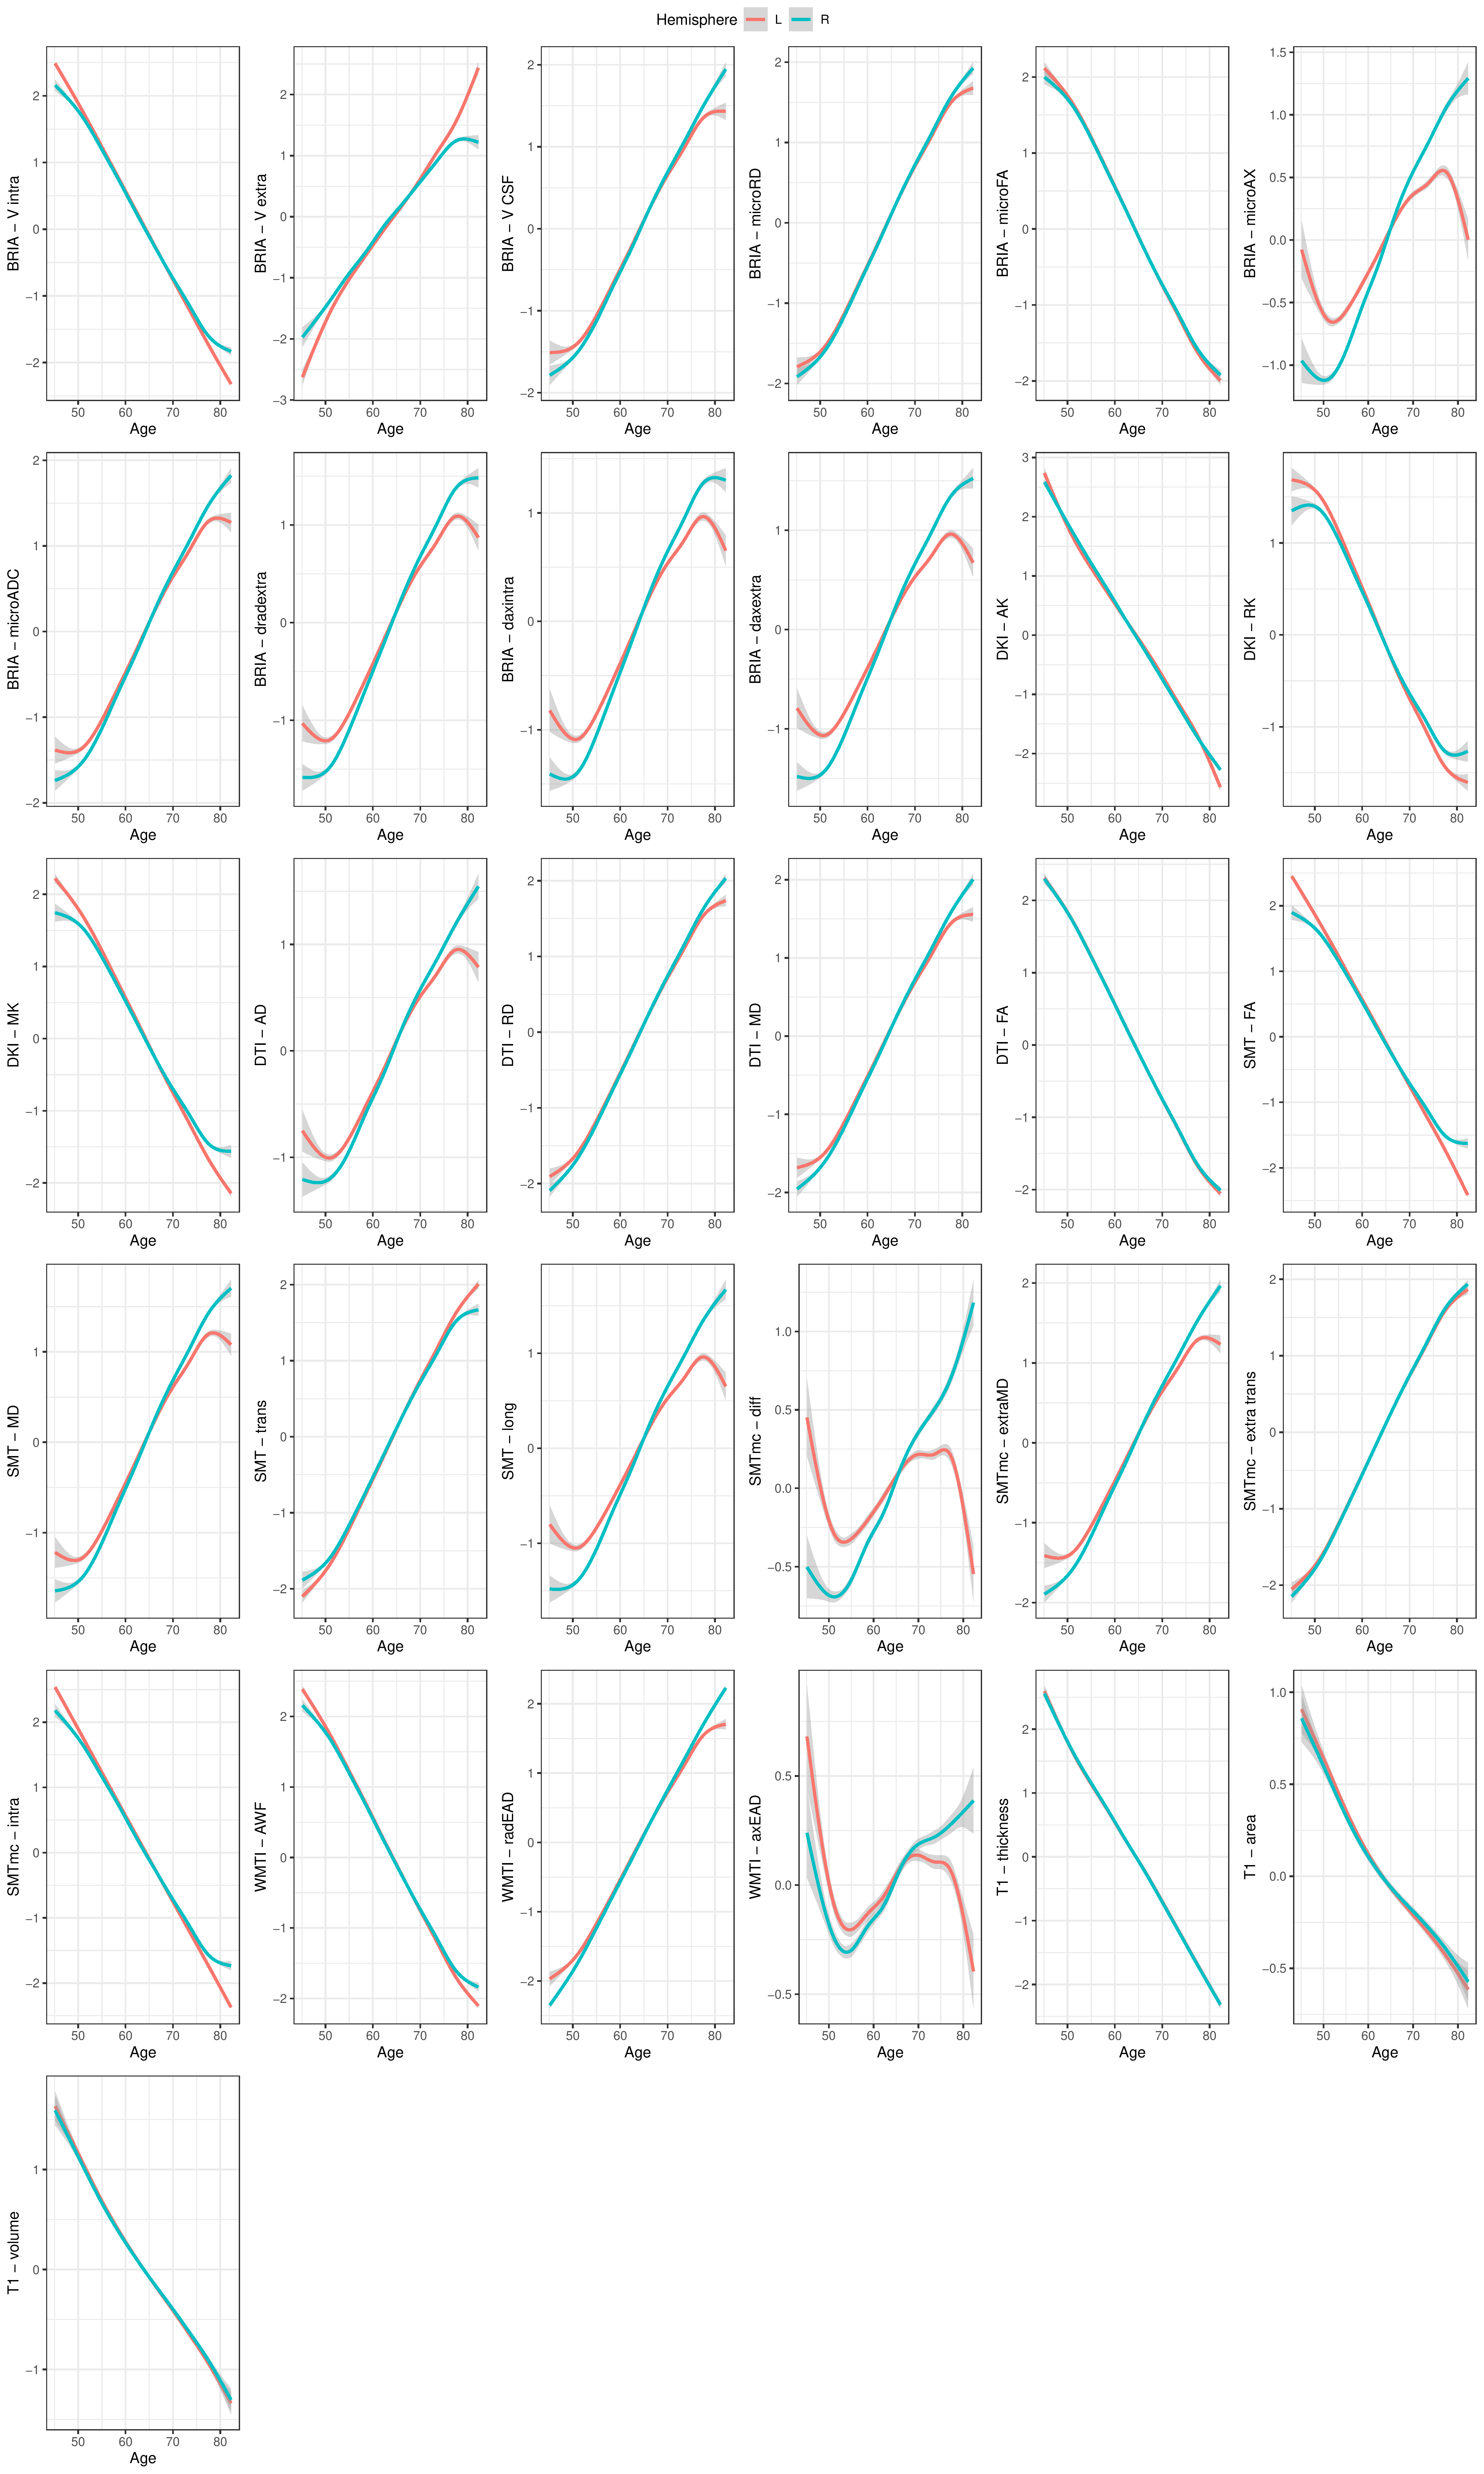
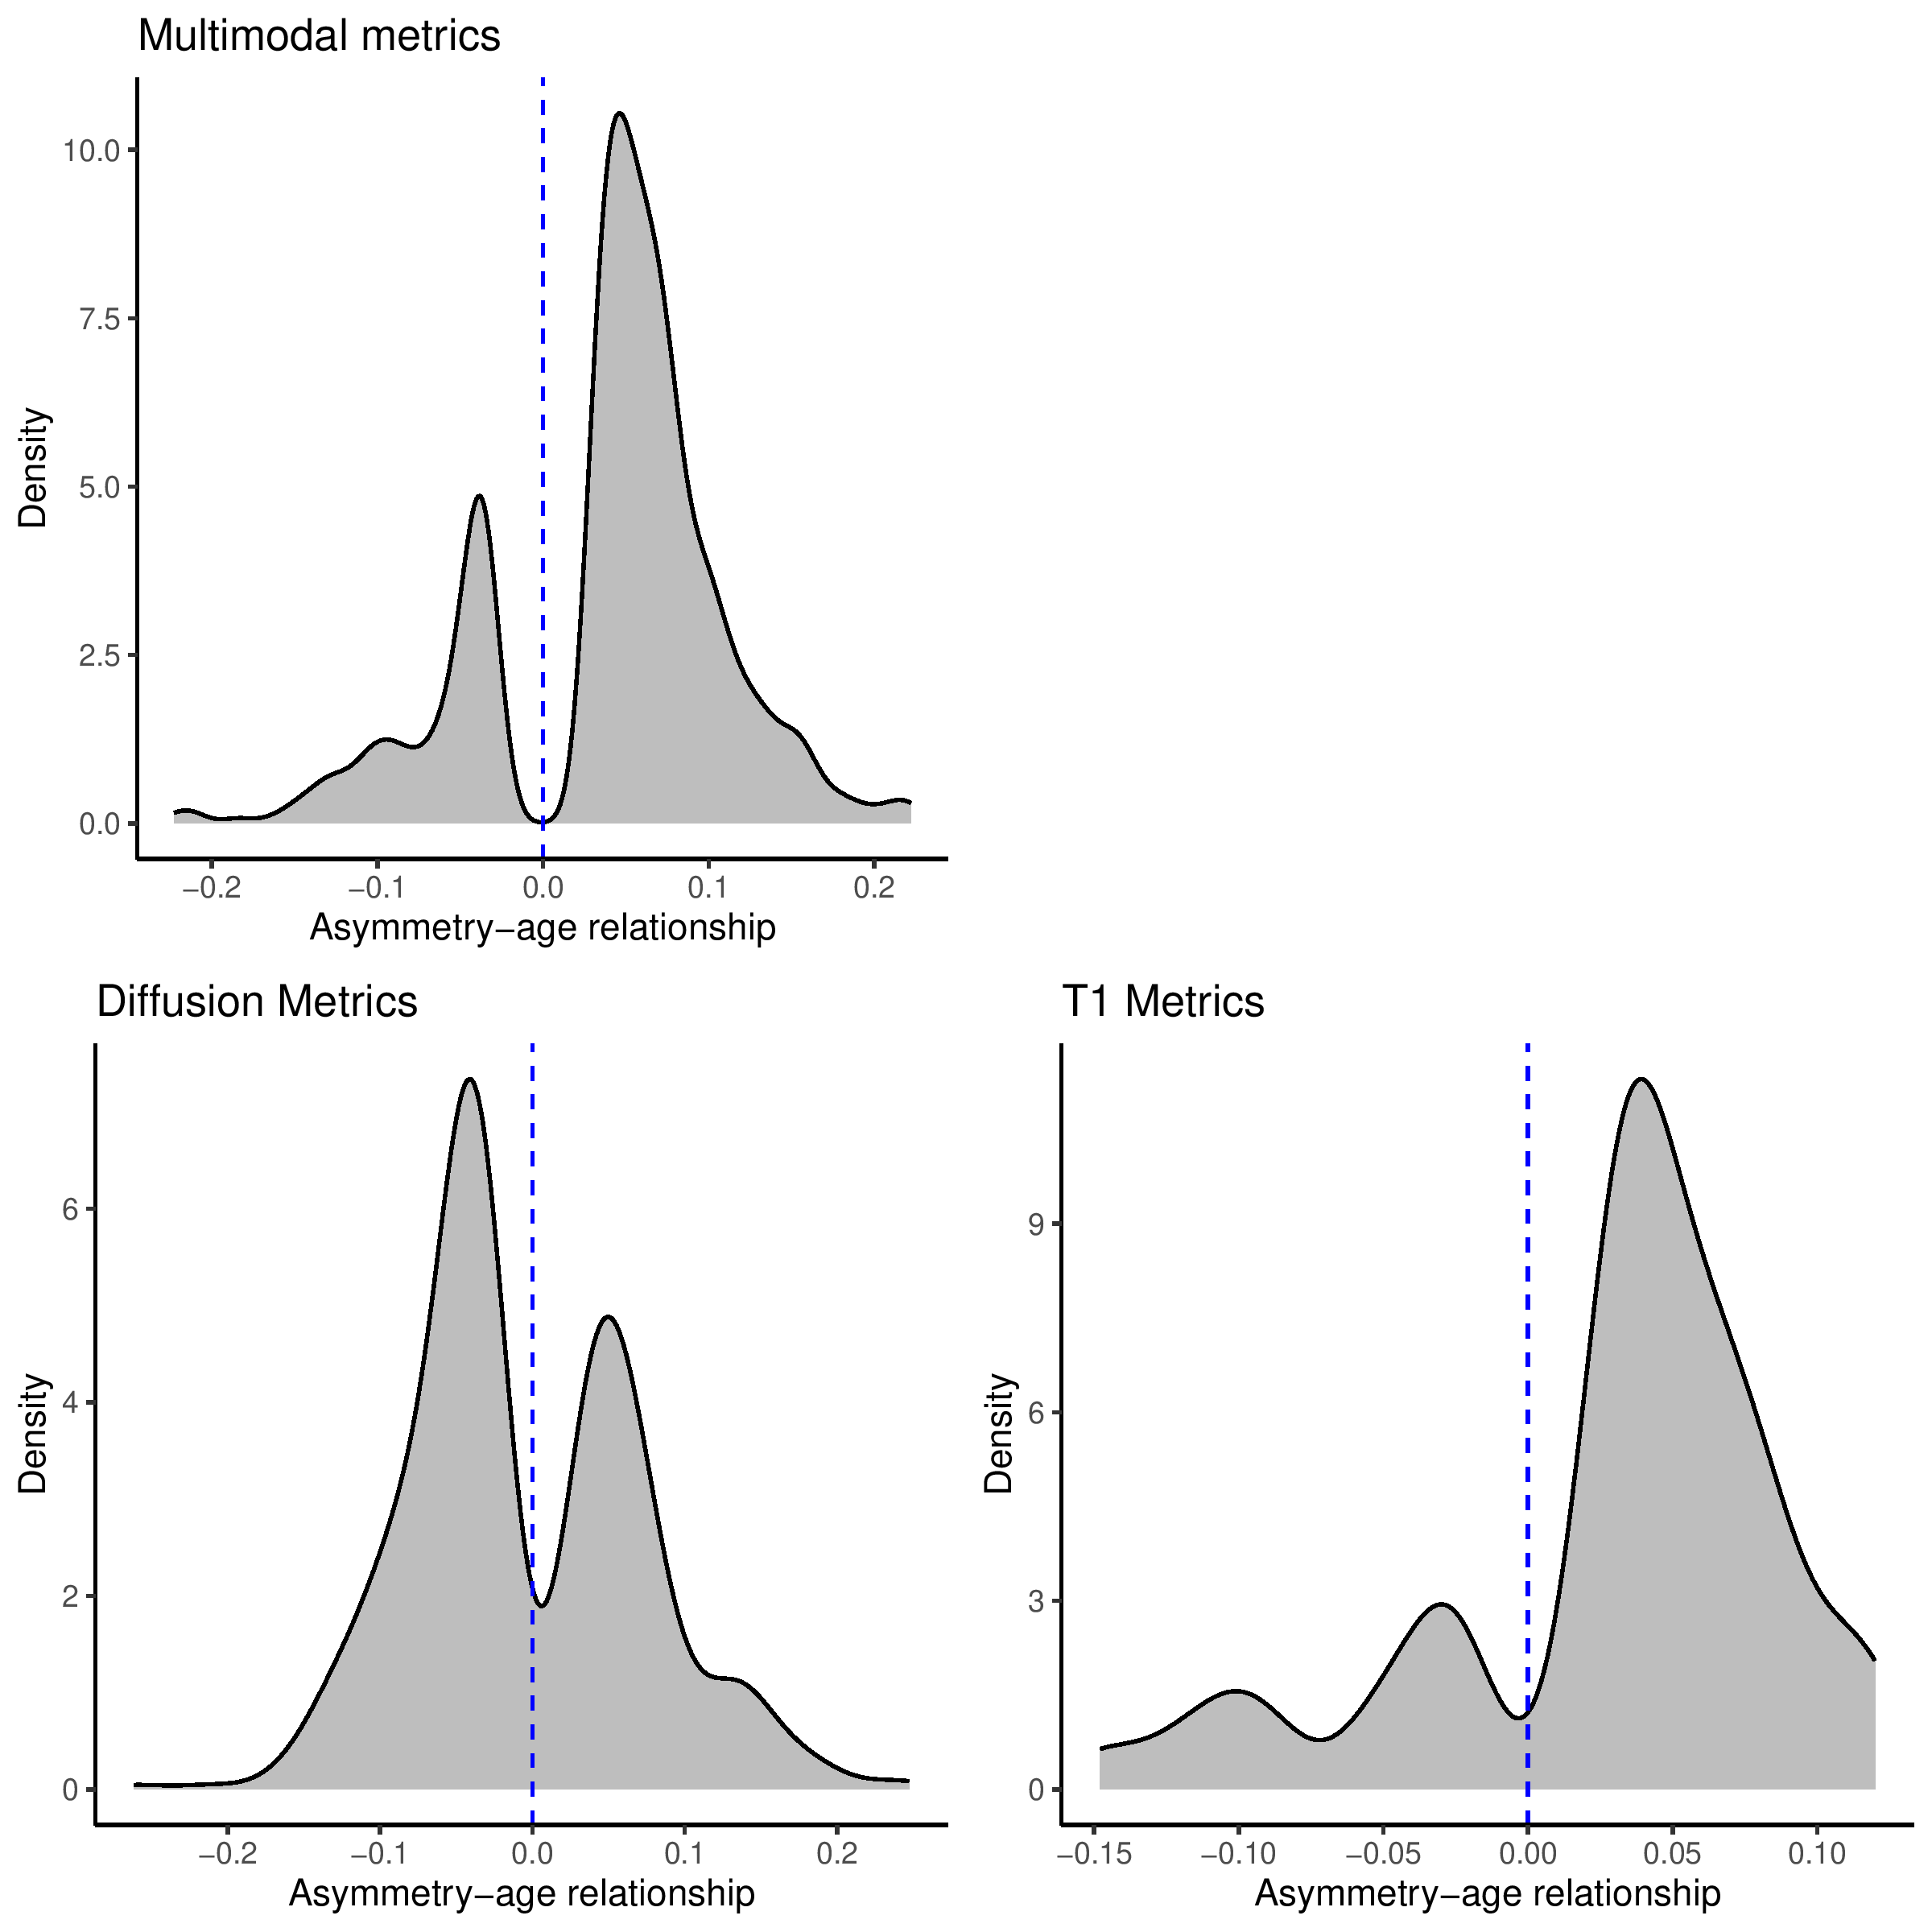
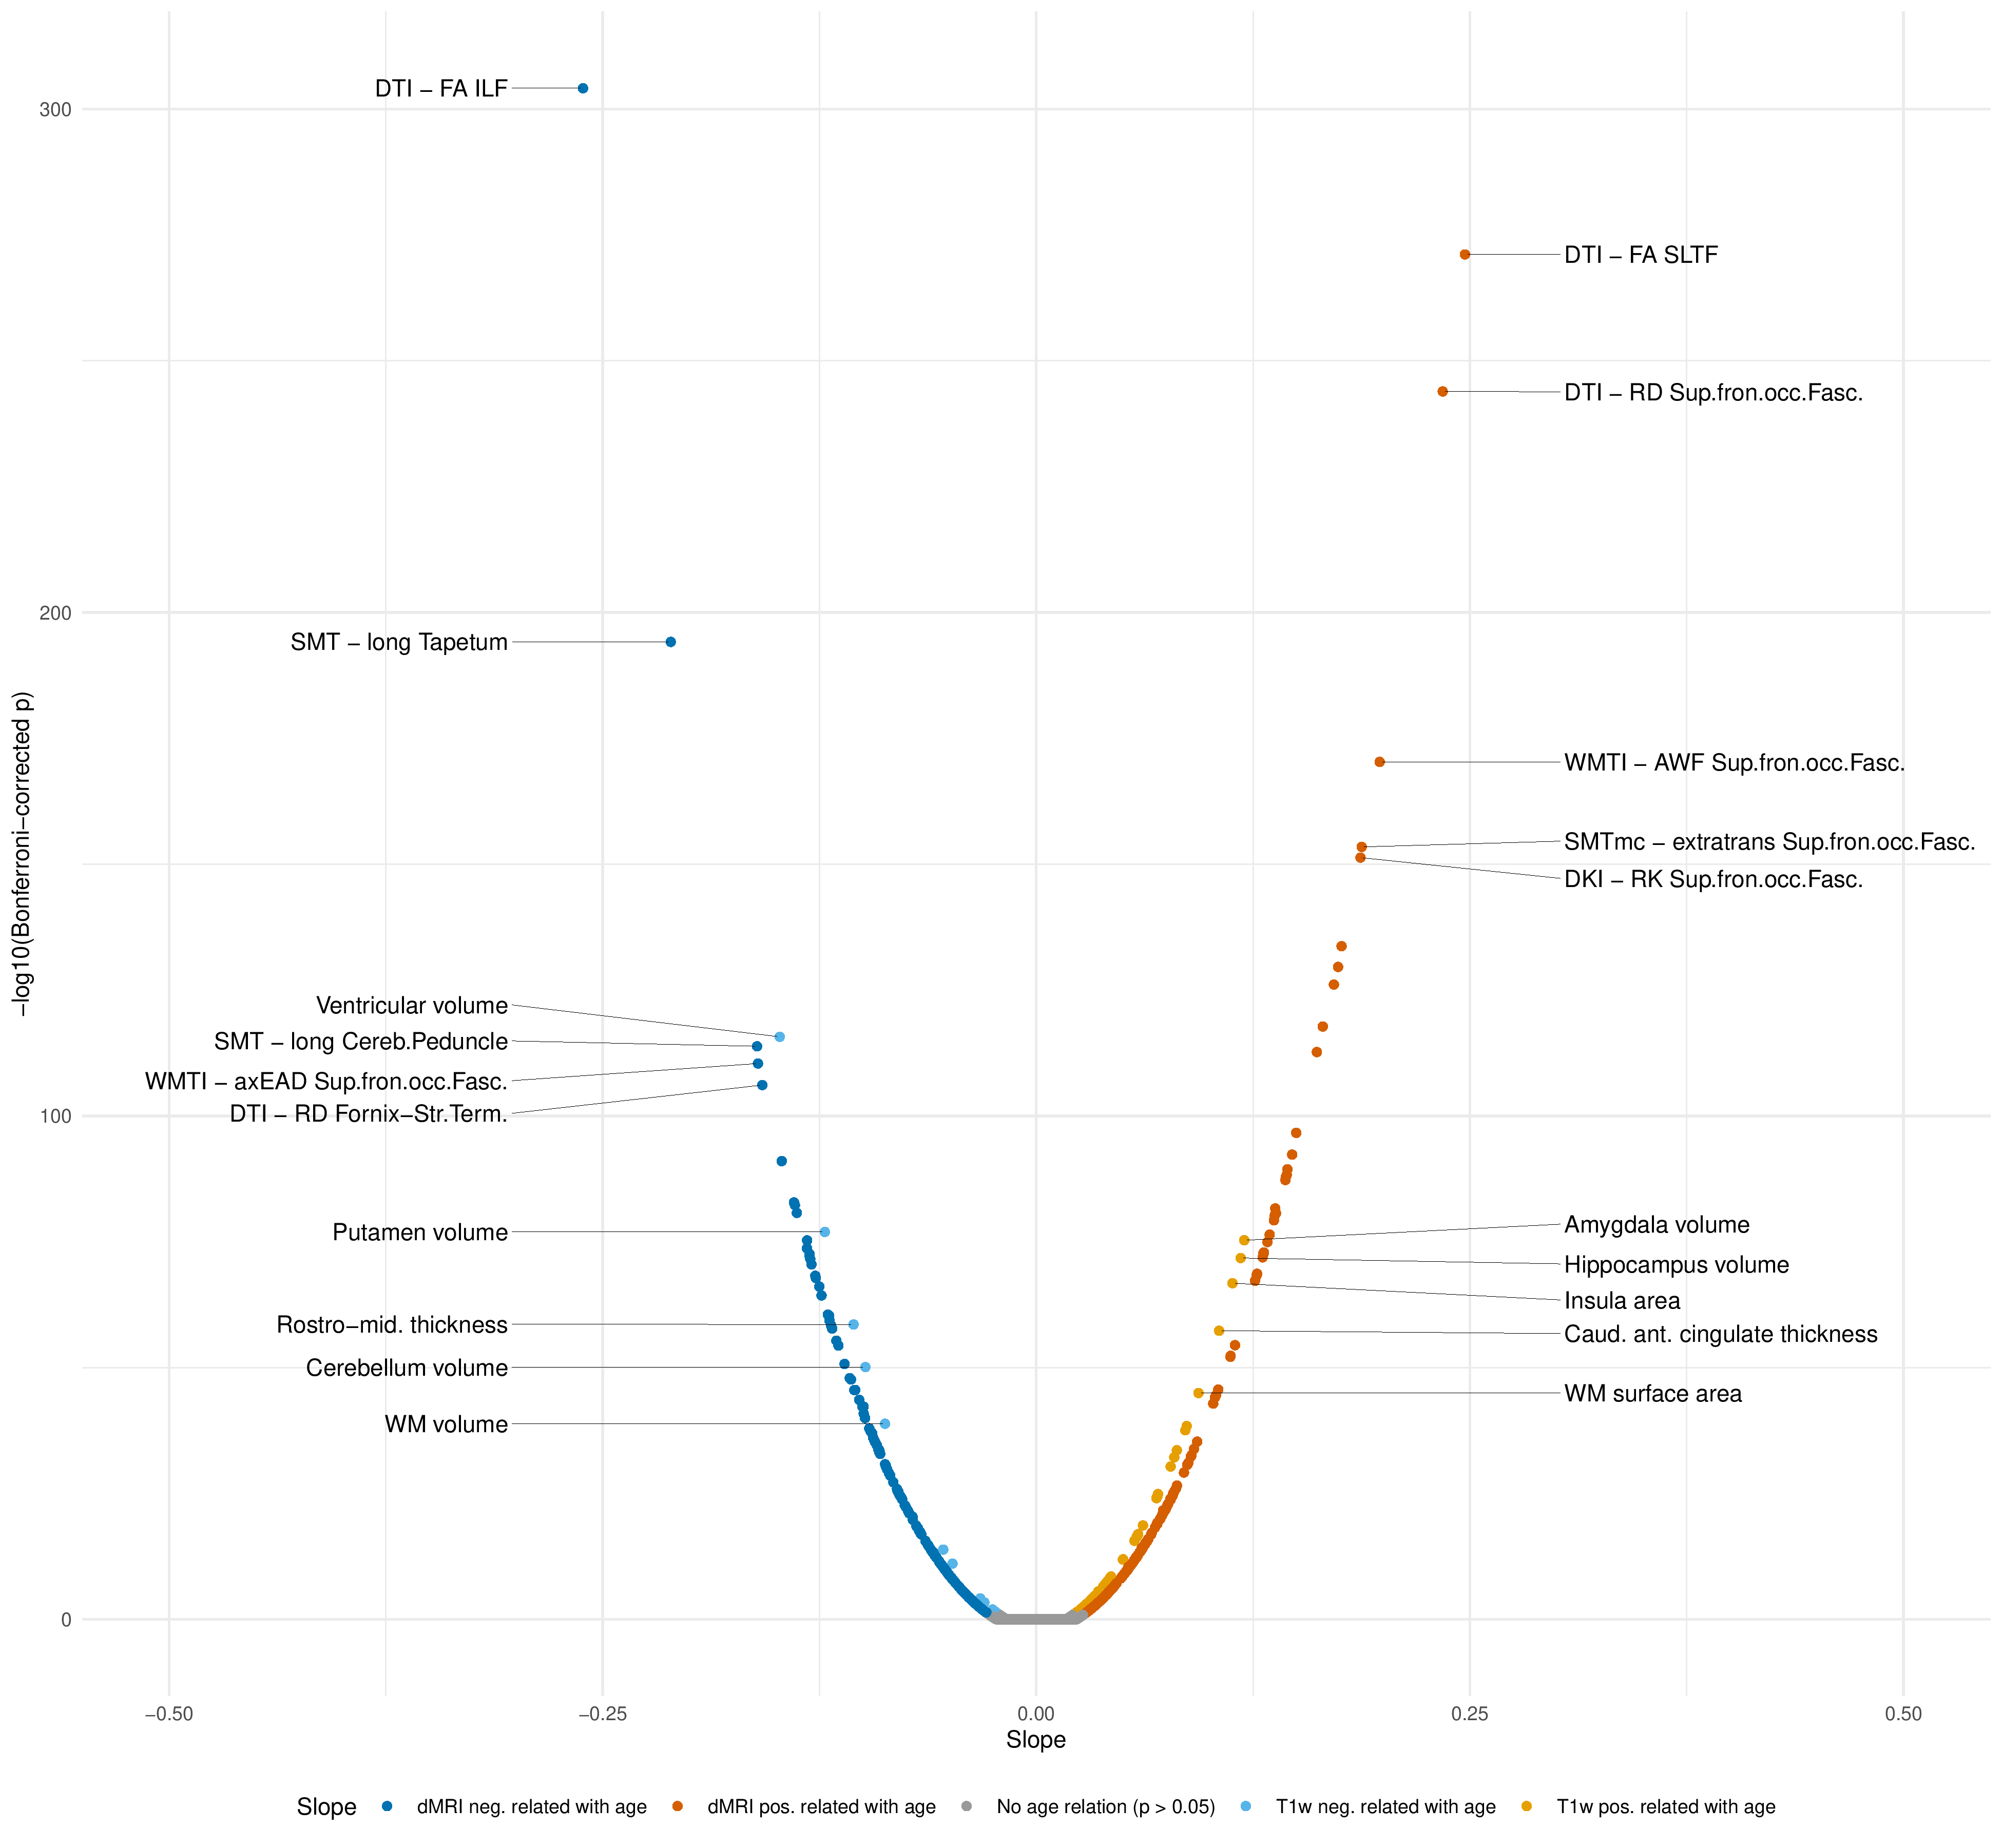
Left, right, and whole-brain age predictions are strongly correlated across modalities and show similar prediction errors (Figure 1). We found no significant influence of hemisphere, modality or handedness on hemispheric brain age, but age-sensitivity of the hemispheric brain age asymmetry. Moreover, we showed that various cardiometabolic risk factors concordantly related to hemispheric brain age (Figure 2). Most grey and white matter features were asymmetric, with these regional asymmetries presenting themselves with moderate to high effect sizes. Interestingly, asymmetries could even be observed when observing hemisphere-wide averages by comparing age-curves for the examined multimodal MRI metrics between left and right hemispheres (Figure 3). The presented regional metrics were also age-sensitive, yet only around 50% of these features' asymmetries were age-sensitive. The regional asymmetries presented a pattern of larger asymmetry at a higher age across T1-weighted (mainly grey matter) features and lower asymmetry in diffusion (white matter) features (Figure 4). Our findings highlighted several brain regions' asymmetry as particularly age-sensitive (Figure 5). These include the asymmetries in inferior and superior longitudinal fasciculi which were strongest on their age-associations, and the superior fronto-occipital fasciculus metrics' asymmetries which were consistently strongly associated with age. For T1-weighted metrics, largest negative age-associations were observed for asymmetries in the lateral ventricles, putamen, hemispheric white matter, and cerebellum volumes, as well as rostro-middle thickness. Largest positive associations with asymmetries included amygdala and hippocampus volumes, insula and WM surface area, as well as caudal anterior cingulate thickness.Conclusions
Our findings emphasise the presence of brain asymmetries in both grey and white matter. These metrics and their asymmetries are largely age-dependent, with WM asymmetries appearing lower and GM asymmetries higher at larger ages. These benchmarks can inform further research both investigating fundamental as well as clinical questions. Hemispheric brain age can be used to assess brain health specific to a single hemisphere, and asymmetries in hemispheric brain age capture the general trend of decreasing asymmetry in white matter.Acknowledgements
This study has been conducted using UKB data under Application 27412. UKB has received ethics approval from the National Health Service National Research Ethics Service (ref 11/NW/0382). The work was performed on the Service for Sensitive Data (TSD) platform, owned by the University of Oslo, operated and developed by the TSD service group at the University of Oslo IT-Department (USIT). Computations were performed using resources provided by UNINETT Sigma2 – the National Infrastructure for High Performance Computing and Data Storage in Norway. Finally, we want to thank all UKB participants and facilitators who made this research possible.
This research was funded by the Research Council of Norway (#223273, #300767); the South-Eastern Norway Regional Health Authority (#2022080, #2019101); and the European Union's Horizon2020 Research and Innovation Programme (#847776, #802998).
References
1. Korbmacher, M., van der Meer, D., Beck, D., de Lange, A. M. G., Eikefjord, E., Lundervold, A., ... & Maximov, I. I. (2023). Brain asymmetries from midlife to old adulthood and hemispheric brain age. bioRxiv, 2023-08. doi: https://doi.org/10.1101/2023.08.21.554103
2. Maximov, I. I., van Der Meer, D., de Lange, A. M. G., Kaufmann, T., Shadrin, A., Frei, O., ... & Westlye, L. T. (2021). Fast qualitY conTrol meThod foR derIved diffUsion Metrics (YTTRIUM) in big data analysis: UK Biobank 18,608 example. Human brain mapping, 42(10), 3141-3155. https://doi.org/10.1002/hbm.25424
3. Basser, P. J., Mattiello, J., & LeBihan, D. (1994). MR diffusion tensor spectroscopy and imaging. Biophysical journal, 66(1), 259-267.
4. Jensen, J. H., Helpern, J. A., Ramani, A., Lu, H., & Kaczynski, K. (2005). Diffusional kurtosis imaging: the quantification of non‐gaussian water diffusion by means of magnetic resonance imaging. Magnetic Resonance in Medicine: An Official Journal of the International Society for Magnetic Resonance in Medicine, 53(6), 1432-1440. https://doi.org/10.1002/mrm.20508
5. Kaden, E., Kruggel, F., & Alexander, D. C. (2016). Quantitative mapping of the per‐axon diffusion coefficients in brain white matter. Magnetic resonance in medicine, 75(4), 1752-1763. https://doi.org/10.1002/mrm.25734
6. Kaden, E., Kelm, N. D., Carson, R. P., Does, M. D., & Alexander, D. C. (2016). Multi-compartment microscopic diffusion imaging. NeuroImage, 139, 346-359. https://doi.org/10.1016/j.neuroimage.2016.06.002
7. Reisert, M., Kellner, E., Dhital, B., Hennig, J., & Kiselev, V. G. (2017). Disentangling micro from mesostructure by diffusion MRI: a Bayesian approach. NeuroImage, 147, 964-975. https://doi.org/10.1016/j.neuroimage.2016.09.058
8. Fieremans, E., Jensen, J. H., & Helpern, J. A. (2011). White matter characterization with diffusional kurtosis imaging. Neuroimage, 58(1), 177-188. https://doi.org/10.1016/j.neuroimage.2011.06.006
9. Smith, S. M., Jenkinson, M., Johansen-Berg, H., Rueckert, D., Nichols, T. E., Mackay, C. E., ... & Behrens, T. E. (2006). Tract-based spatial statistics: voxelwise analysis of multi-subject diffusion data. Neuroimage, 31(4), 1487-1505. https://doi.org/10.1016/j.neuroimage.2006.02.024
10. Hua, K., Zhang, J., Wakana, S., Jiang, H., Li, X., Reich, D. S., ... & Mori, S. (2008). Tract probability maps in stereotaxic spaces: analyses of white matter anatomy and tract-specific quantification. Neuroimage, 39(1), 336-347. https://doi.org/10.1016/j.neuroimage.2007.07.053
11. Desikan, R. S., Ségonne, F., Fischl, B., Quinn, B. T., Dickerson, B. C., Blacker, D., ... & Killiany, R. J. (2006). An automated labeling system for subdividing the human cerebral cortex on MRI scans into gyral based regions of interest. Neuroimage, 31(3), 968-980. https://doi.org/10.1016/j.neuroimage.2006.01.021
12. Fischl, B. (2012). FreeSurfer. Neuroimage, 62(2), 774-781. https://doi.org/10.1016/j.neuroimage.2012.01.021
13. Matthews, P. M., & Sudlow, C. (2015). The UK biobank. Brain, 138(12), 3463-3465. https://doi.org/10.1093/brain/awv335
14. Benson, R. R., FitzGerald, D. B.,
LeSueur, L. L., Kennedy, D. N., Kwong, K. K., Buchbinder, B. R., ...
& Rosen, B. R. (1999). Language dominance determined by whole brain
functional MRI in patients with brain lesions. Neurology, 52(4), 798-798. https://doi.org/10.1212/WNL.52.4.798
Figures