3864
Prediction of MGMT promotor methylation status in glioblastoma by contrast-enhanced T1-weighted intensity image1Neurosurgery, Asahikawa Medical University, Asahikawa, Japan, 2Neurosurgery, Osaka International Cancer Institute, Osaka, Japan, 3Neurological Surgery, Wakayama Medical University School of Medicine, Wakawayma, Japan, 4Neurosurgery, Wakayama Rosai Hospital, Wakayama, Japan, 5Neurosurgery, Osaka General Medical Center, Osaka, Japan, 6Neurosurgery, Japanese Red Cross Kitami Hospital, Kitami, Japan, 7Neurosurgery, Osaka University Graduate School of Medicine, Osaka, Japan, 8Neurosurgery, National Hospital Organization Osaka National Hospital, Osaka, Japan, 9Neurosurgery, Kansai Medical University, Hirakata, Japan, 10Neurosurgery, Osaka Metropolitan University Graduate School of Medicine, Osaka, Japan, 11Neurosurgery, Yao Municipal Hospital, Yao, Japan, 12Neurosurgery, Osaka City General Hospital, Osaka, Japan, 13Neurosurgery, Toyonaka Municipal Hospital, Toyonaka, Japan, 14Neurosurgery, Tazuke Kofukai Foundation, Medical Research Institute, Kitano Hospital, Osaka, Japan, 15Biomedical Research and Innovation, Institute for Clinical Research, National Hospital Organization Osaka National Hospital, Osaka, Japan, 16Diagnostic Pathology, Asahikawa Medical University Hospital, Asahikawa, Japan, 17Diagnostic Pathology and Cytology, Osaka International Cancer Institute, Osaka, Japan, 18Central Laboratory and Surgical Pathology, National Hospital Organization Osaka National Hospital, Osaka, Japan
Synopsis
Keywords: Tumors (Pre-Treatment), Tumor, Glioma, Glioblastoma
Motivation: Non-invasive prediction of GBM’s pMGMT methylation status is still challenging despite recent advancements of image analysis.
Goal(s): This study explored a clinically feasible imaging biomarker that represents GBM’s pMGMT methylation status with external validation.
Approach: Two qualitative imaging features, namely the “Thickened structure” and the “Methylated contrast phenotype,” were identified as valuable to this means.
Results: GBMs presenting both imaging features exhibited a significantly high odds ratio, favoring pMGMT methylation in the exploratory and validation cohorts with a sensitivity and specificity of approximately 0.3-0.4 and 0.8. The easy clinical application of the proposed imaging features is expected to facilitate better preoperative GBM characterization.
Impact: GBMs presenting both imaging features, namely the “Thickened structure” and the “Methylated contrast phenotype,” exhibited a significantly high odds ratio, favoring pMGMT methylation in the exploratory and validation cohorts with a sensitivity and specificity of approximately 0.3-0.4 and 0.8.
INTRODUCTION
Methylation of the gene’s promoter region encoding the O-6- methylguanine-DNA methyltransferase (MGMT) is a predictive and prognostic factor in glioblastoma (GBM) patients1. Non-invasive prediction of the methylation status of the promoter region of MGMT (pMGMT) in GBM is still a challenging research topic despite recent technological advancements in image analysis. Thus, this study explored a clinically feasible imaging biomarker that represents GBM’s pMGMT methylation status with external validation.METHODS
Two hundred two histologically and molecularly confirmed GBMs at the Kansai Network for Molecular Diagnosis of Central Nervous Tumors (KANSAI) were used as an exploratory cohort. One hundred four patients from the Cancer Imaging Archive (TCIA) / Cancer Genome Atlas (TCGA) were used as validation cohorts.“Thickened structure” was defined as the solid tumor component presenting circumferential extension or occupying >50% of the tumor volume. “Methylated contrast phenotype” was defined as indistinct enhancing circumferential border, heterogenous enhancement, or nodular enhancement. Detailed information is provided in Fig. 1.
Inter-rater agreement was assessed by Fleiss’s kappa coefficient, followed by an investigation of the relationship between radiological findings and pMGMT methylation status by the Fisher exact test or multiple logistic regression analysis. A p-value of less than 0.05 was considered significant.
RESULTS
Inter-rater reliability of the “Thickened structure” and the “Methylated contrast phenotype”Inter-rater reliability of three evaluators assessing the “Thickened structure” was 0.68 for the KANSAI and 0.56 for the TCIA / TCGA cohorts, suggesting substantial and moderate agreements by Fleiss’s kappa coefficient2, respectively. Regarding “Methylated contrast phenotype”, Fleiss’s kappa coefficients were 0.32 for the KANSAI and 0.35 for the TCIA / TCGA cohorts, both of which implied fair agreement2.
Correlation of qualitative image phenotypes and pMGMT methylation both for the exploratory and validation cohorts
Fig. 2 shows the presence or absence of qualitative image phenotypes and molecular status of the two cohorts. A multiple logistic analysis for the exploratory cohort (KANSAI) revealed that pMGMT methylation was predicted by the following equation: MGMT (unmethy:0, methy:1) ~ -0.48 + 0.16 x “Thickened structure (absent:0, present:1)” + 0.86 x “Methylation contrast phenotype (absent:0, present:1)” While the “Thickened structure” did not significantly contribute to the model construction (p = 0.32, Fig. 3A), “Methylation contrast phenotype” was considered significant (p = 0.003, Fig. 3B). This trend was also consistently observed in the validation cohort (TCIA / TCGA) (Fig. 3C and D). Further analysis revealed that the presence of both the “Thickened structure” and “Methylated contrast phenotype” was highly predictive of pMGMT-met GBM both for the KANSAI exploratory (Fig. 4A; p = 0.003, odds ratio = 2.26, 95% confidence interval [CI] = 1.34 – 4.00) and TCIA / TCGA validation cohorts (Fig. 4B; p = 0.03, odds ratio = 2.57, 95% CI = 1.12 – 6.61). The sensitivities and specificities of the “Thickened structure” and “Methylated contrast phenotype” double positive for correctly predicting pMGMT-met GBM were 0.42 and 0.81 for the KANSAI exploratory and 0.31 and 0.84 for the TCIA / TCGA validation cohort.
The presence of the “Methylation contrast phenotype” significantly correlates to GBM’s pMGMT methylation only under the presence of the “Thickened structure”
Further investigating the correlation of the two qualitative image features to GBM’s pMGMT methylation status, a significant correlation between the “Methylation contrast phenotype” and pMGMT methylation was observed when the “Thickened structure” was present (KANSAI exploratory cohort (Fig. 5B): p < 0.001, TCIA / TCGA validation cohort (Fig. 5E): p = 0.009). On the other hand, the presence or absence of the “Thickened structure” did not correlate with GBM’s pMGMT methylation status when first stratified by the presence or absence of the “Methylation contrast phenotype”.
DISCUSSION
Previous studies reported that ill-defined tumor margin was seen more frequently in high-grade gliomas with pMGMT methylation3 and that ring enhancement in pMGMT-unmet GBM4,5. However, there are incongruent studies that showed no correlation between these findings and the pMGMT methylation status of the tumors3,6. The present study demonstrated that the newly defined “Methylated contrast phenotype” highly correlated with pMGMT-met GBM in a large number of patients in two independent cohorts. Moreover, we revealed that the odds ratio for pMGMT-met GBM significantly increased by combining the “Thickened structure” feature. Considering the interrater agreements of both qualitative assessments, the proposed qualitative visual assessment can be easily applied in daily clinical practice.CONCLUSION
The present study showed that qualitative assessment of contrast-enhanced T1-weighted intensity images is useful to predict GBM’s pMGMT methylation status, and the proposed “Thickened structure” and “Methylated contrast phenotype” are valuable image biomarkers to better understand the GBM’s pMGMT methylation status in a preoperative setting.Acknowledgements
This research was approved by the local ethics committees/institutional review boards of the following institutions: Wakayama Rosai Hospital, Wakayama Medical University, Osaka International Cancer Institute, Osaka University Graduate School of Medicine, Osaka National Hospital, Kansai Medical University, Osaka City University Graduate School of Medicine, Kindai University Faculty of Medicine, Kansai Rosai Hospital, Osaka City General Hospital, Toyonaka Municipal Hospital, Tazuke Kofukai Foundation, Medical Research Institute, Kitano Hospital. No natural language processing tool was used to prepare this manuscript.References
1. Chinot OL, Barrié M, Fuentes S, et al. Correlation Between O6-Methylguanine-DNA Methyltransferase and Survival in Inoperable Newly Diagnosed Glioblastoma Patients Treated With Neoadjuvant Temozolomide. J Clin Oncol. 2007;25(12):1470-1475.
2. Landis JR, Koch GG. The measurement of observer agreement for categorical data. Biometrics. 1977;33(1):159-174.
3. Moon WJ, Choi JW, Roh HG, Lim SD, Koh YC. Imaging parameters of high grade gliomas in relation to the MGMT promoter methylation status: the CT, diffusion tensor imaging, and perfusion MR imaging. Neuroradiology. 2012;54(6):555-563.
4. Eoli M, Menghi F, Bruzzone MG, et al. Methylation of O6-Methylguanine DNA Methyltransferase and Loss of Heterozygosity on 19q and/or 17p Are Overlapping Features of Secondary Glioblastomas with Prolonged Survival. Clin Cancer Res. 2007;13(9):2606-2613.
5. Drabycz S, Roldán G, Robles P de, et al. An analysis of image texture, tumor location, and MGMT promoter methylation in glioblastoma using magnetic resonance imaging. Neuroimage. 2010;49(2):1398-1405.
6. Gupta A, Omuro AMP, Shah AD, et al. Continuing the search for MR imaging biomarkers for MGMT promoter methylation status: conventional and perfusion MRI revisited. Neuroradiology. 2012;54(6):641-643.
Figures
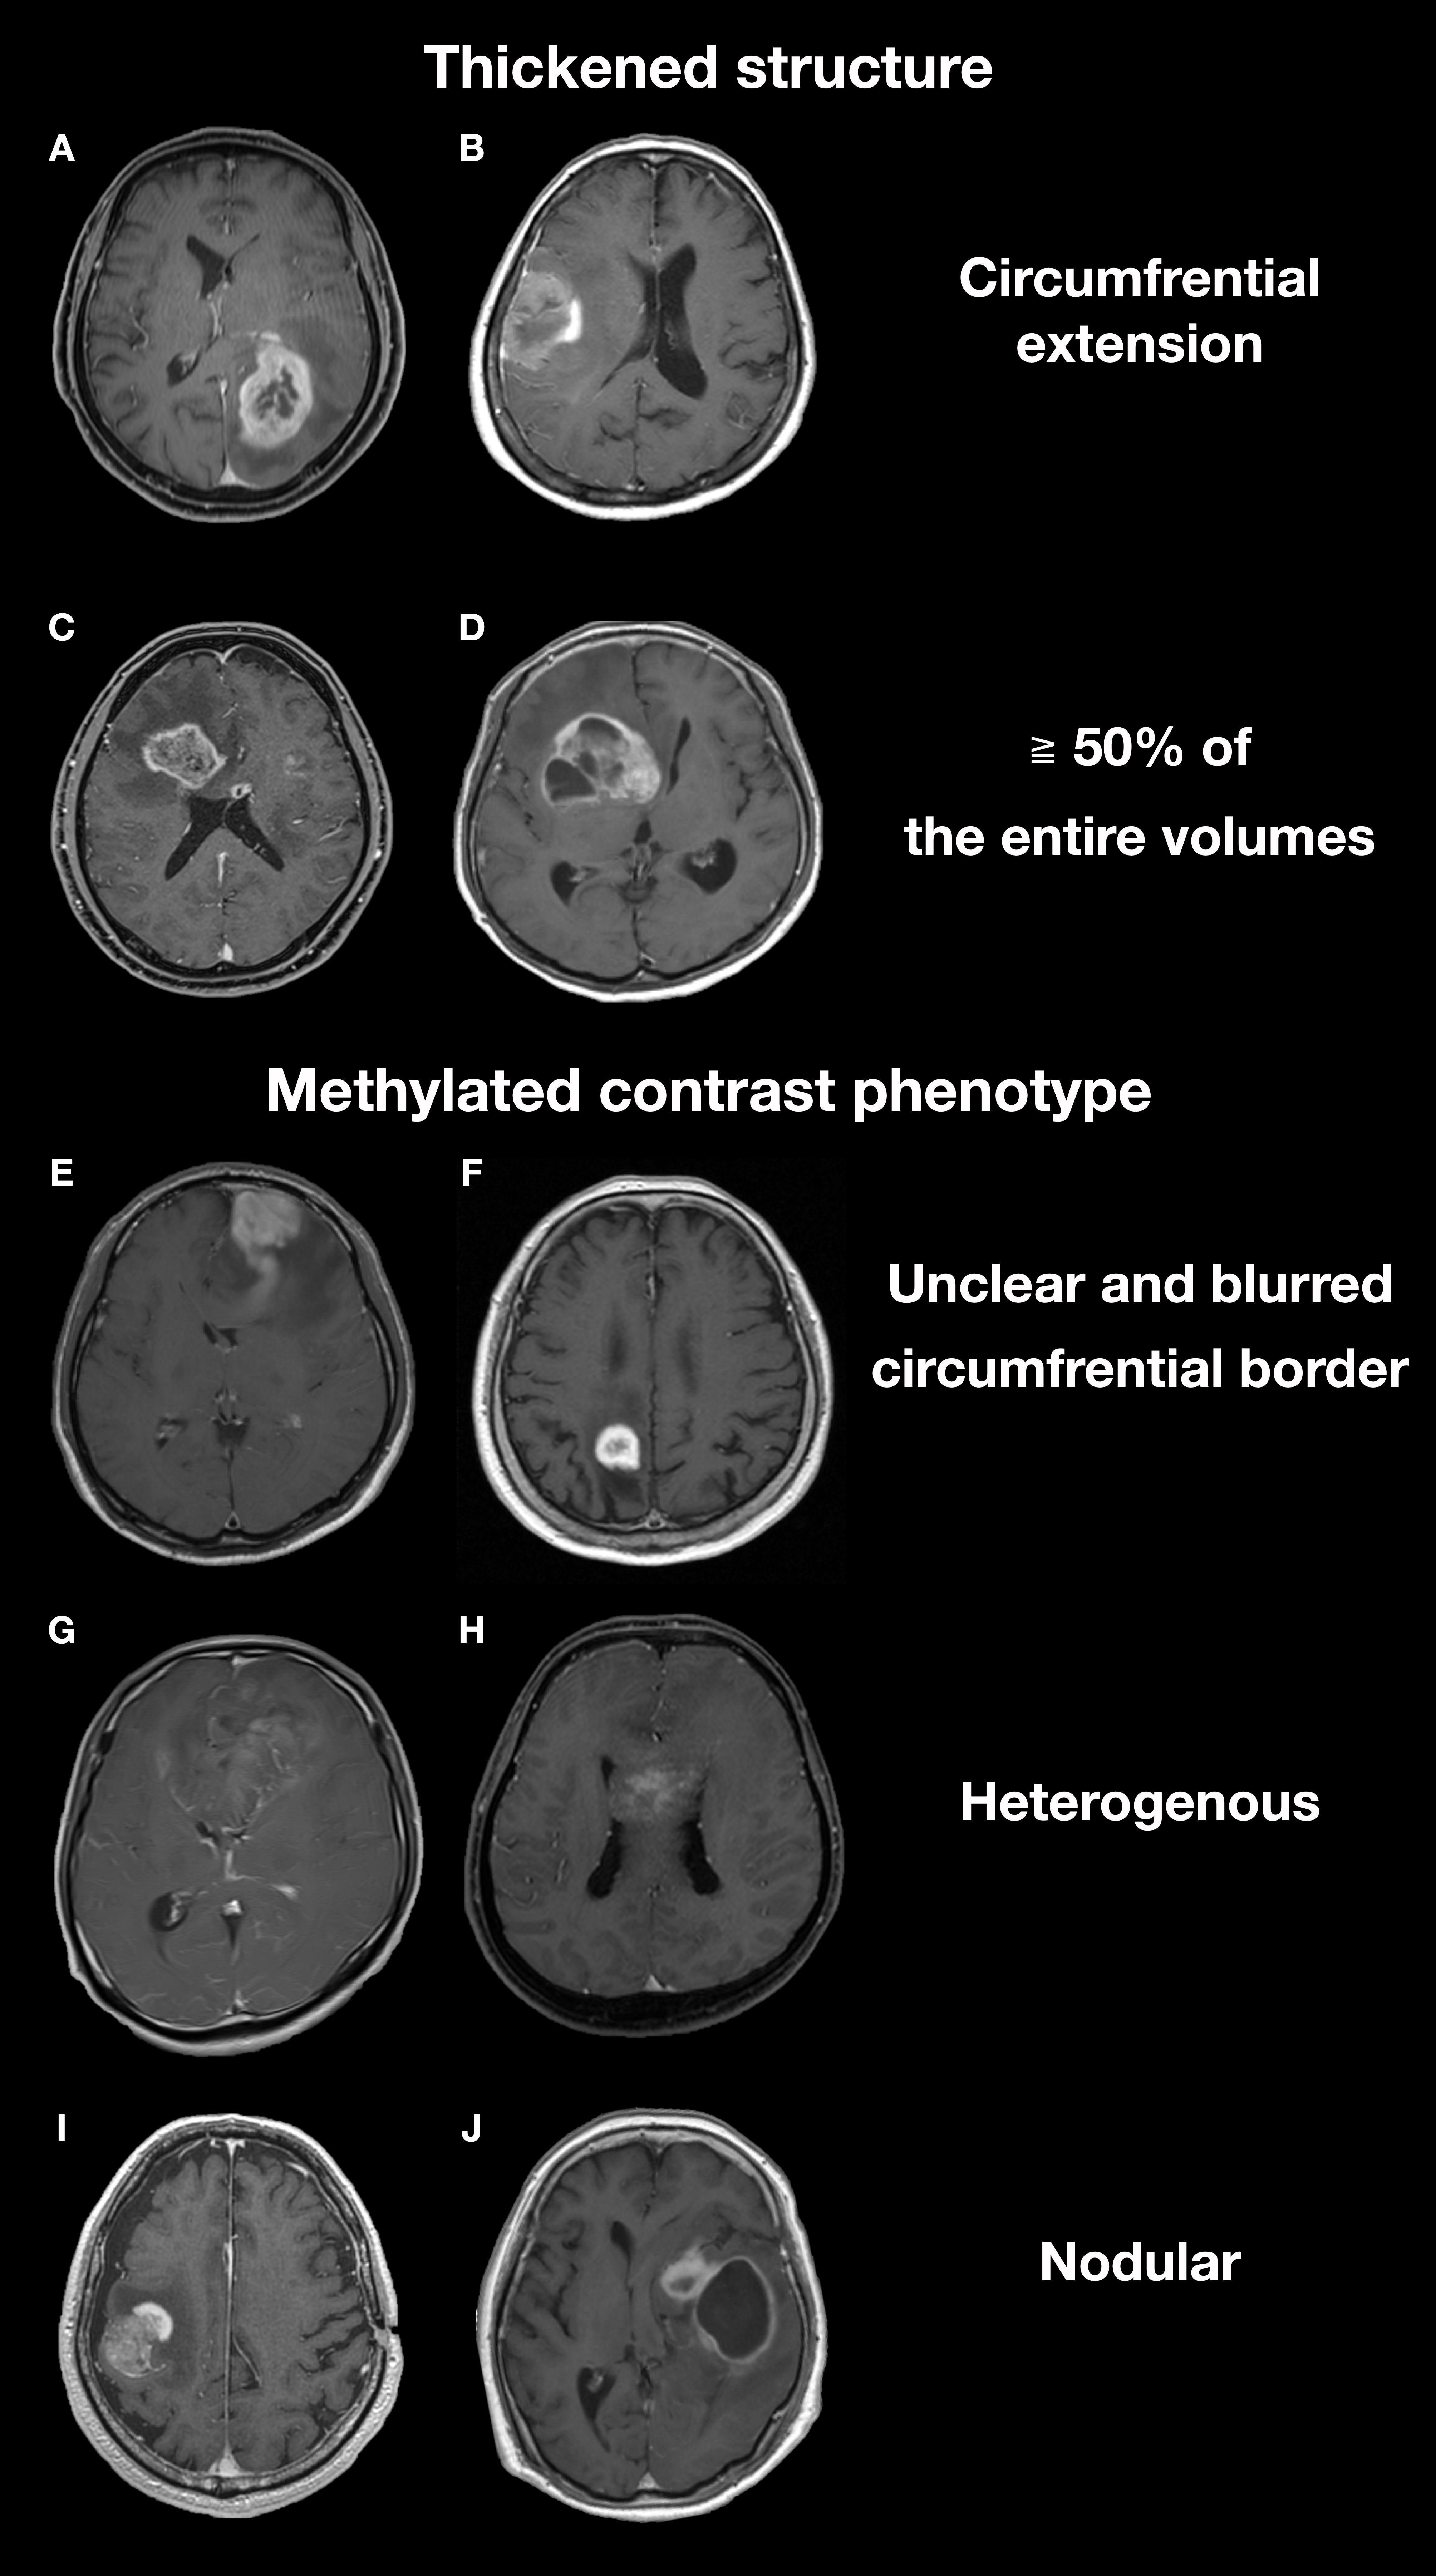
The “Thickened structure” was defined based on the presence of any of the two criteria: a solid circumferential component with central necrosis (A, B) or a solid component occupying more than 50% of the entire volume of the tumor (C, D). Methylated contrast phenotype” was defined by imaging findings with one of the three definitions: the entire enhancing circumferential border is unclear and blurred in relation to the surrounding brain (E, F), the enhancement is heterogenous (G, H), or the enhancement is nodular (I, J).

Figure 2.
Overall study cohort. The study was conducted in two stages, an exploratory cohort study followed by a validation cohort study, to investigate the relationship between the imaging characteristics and the pMGMT-methylation status of histologically confirmed GBM. KANSAI, Kansai Molecular Diagnosis Network; TCIA/TCGA, Cancer Imaging Archive / Cancer Genome Atlas.
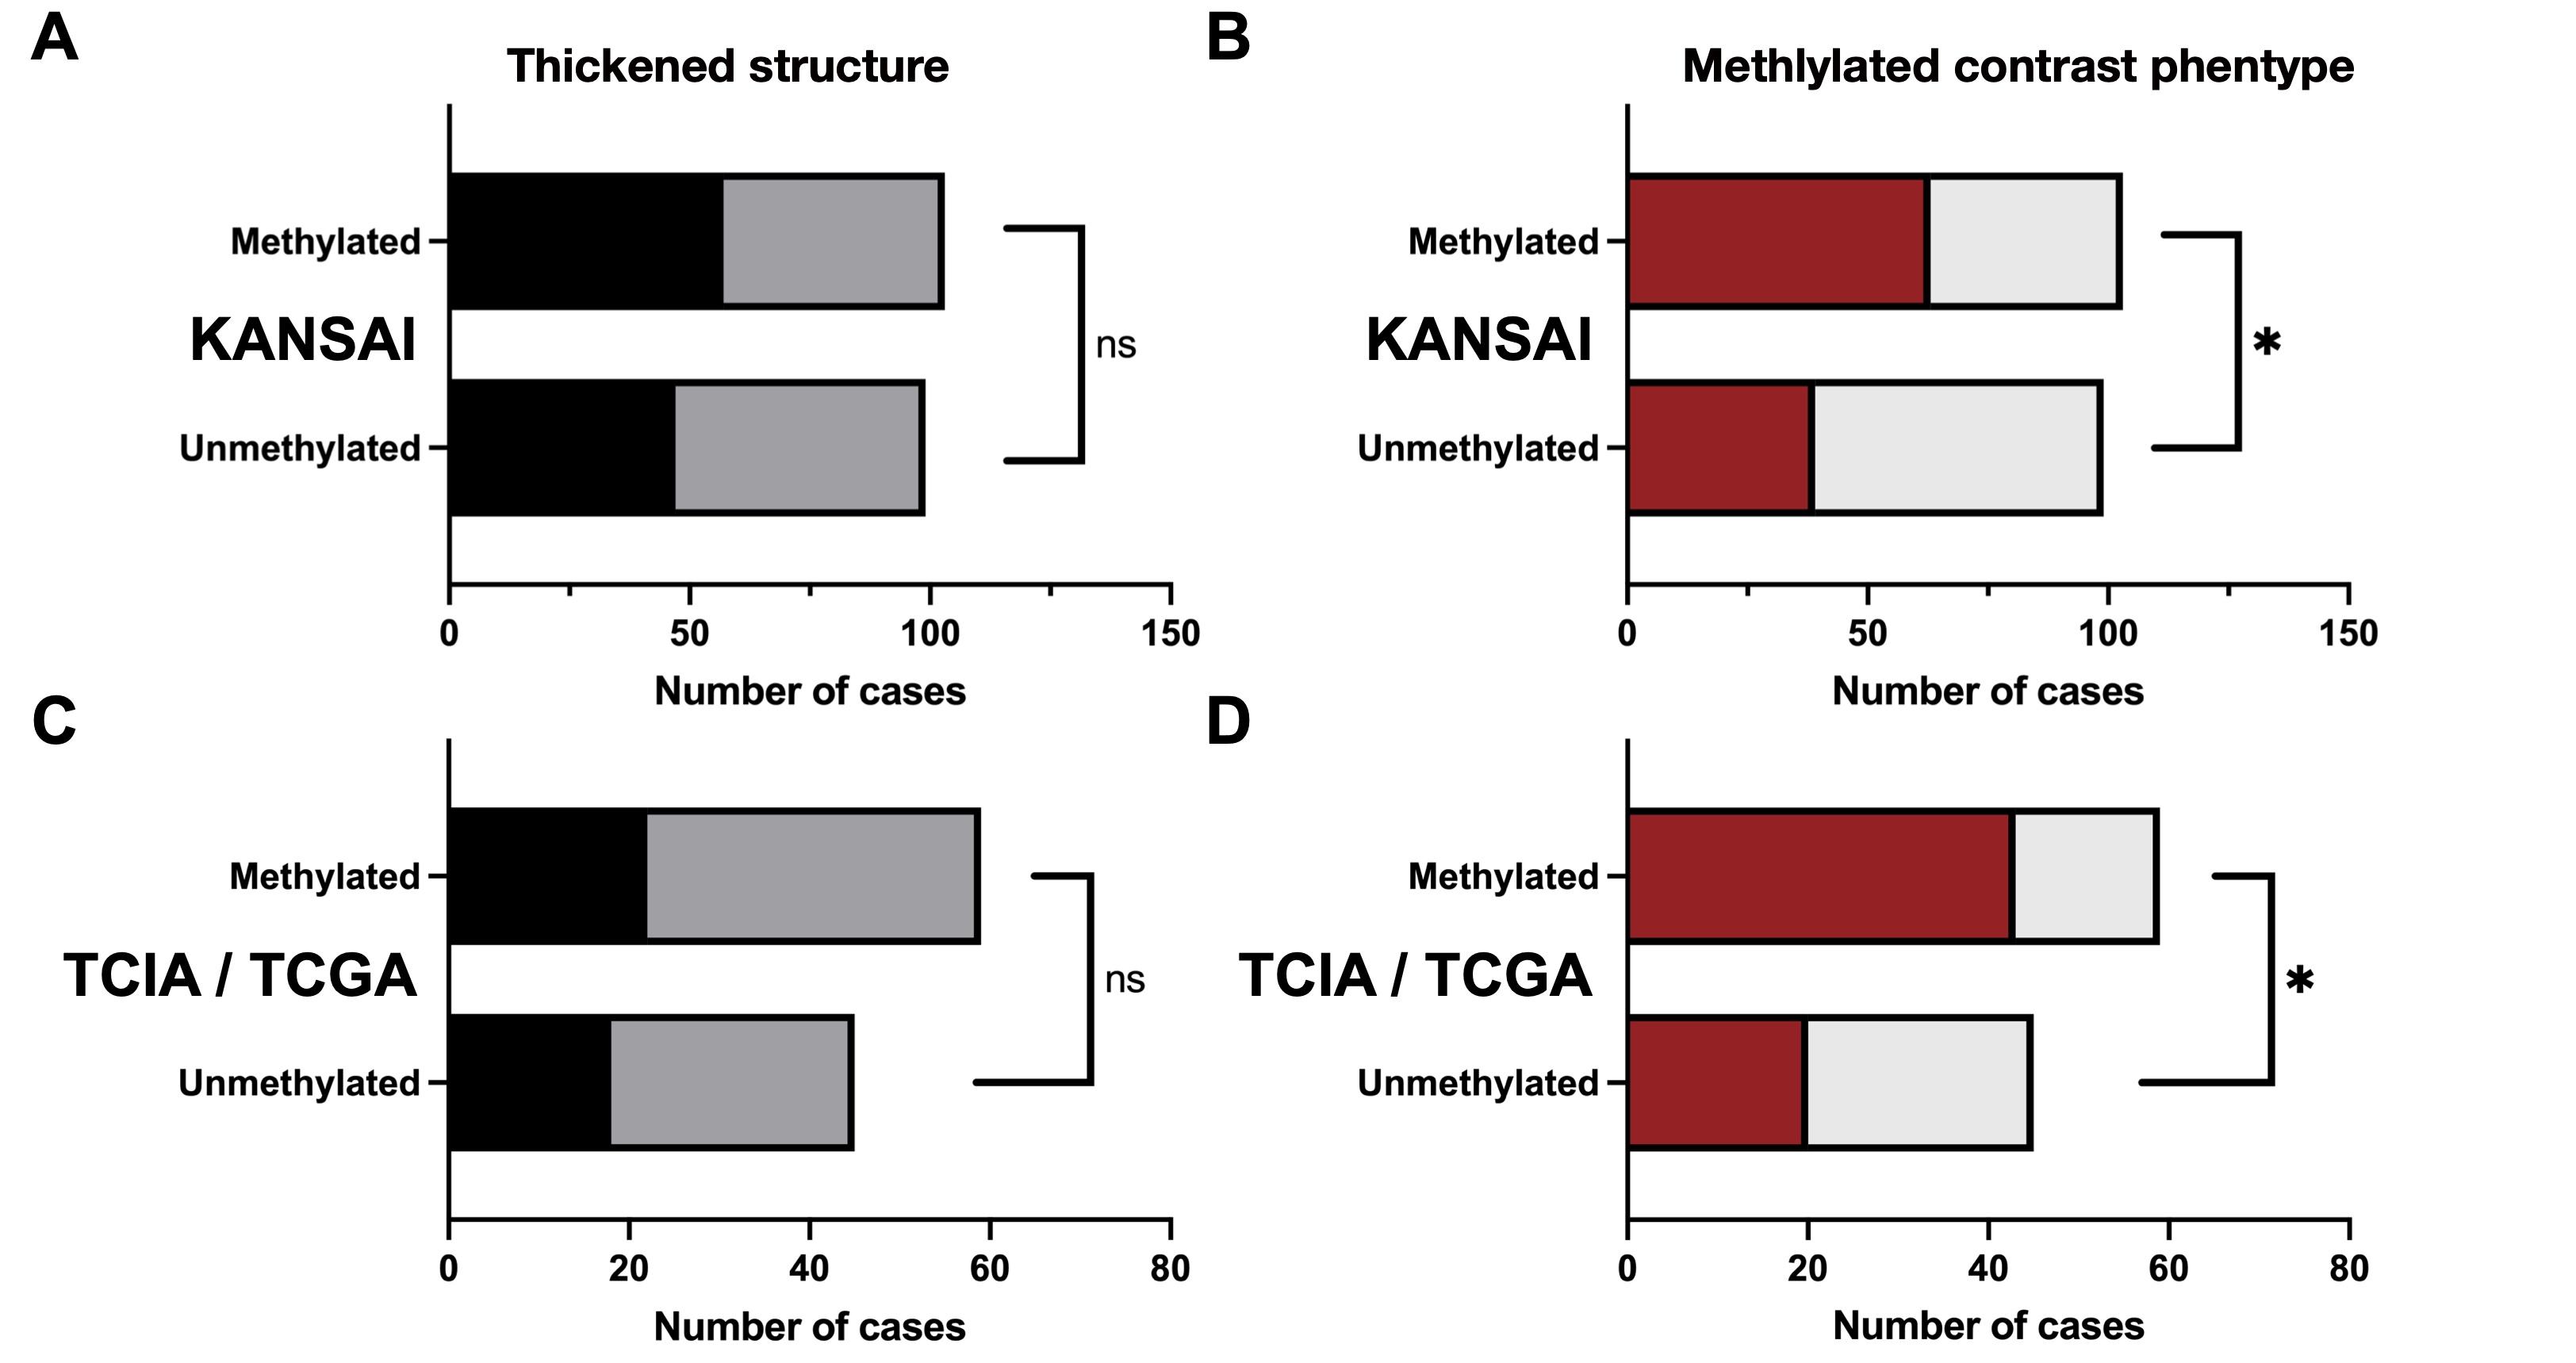
Figure 3.
Exploration of the relationship between the imaging characteristics and the pMGMT- methylation status of GBMs. “Thickened structure” was not significantly associated with pMGMT-met GBMs (KANSAI cohort (A), p = 0.32 and TCIA / TCGA cohort (C), p = 0.84). “Methylated contrast phenotype” was significantly associated with pMGMT-met of GBMs (KANSAI cohort (B), p = 0.003 and TCIA / TCGA cohort (D), p = 0.004)
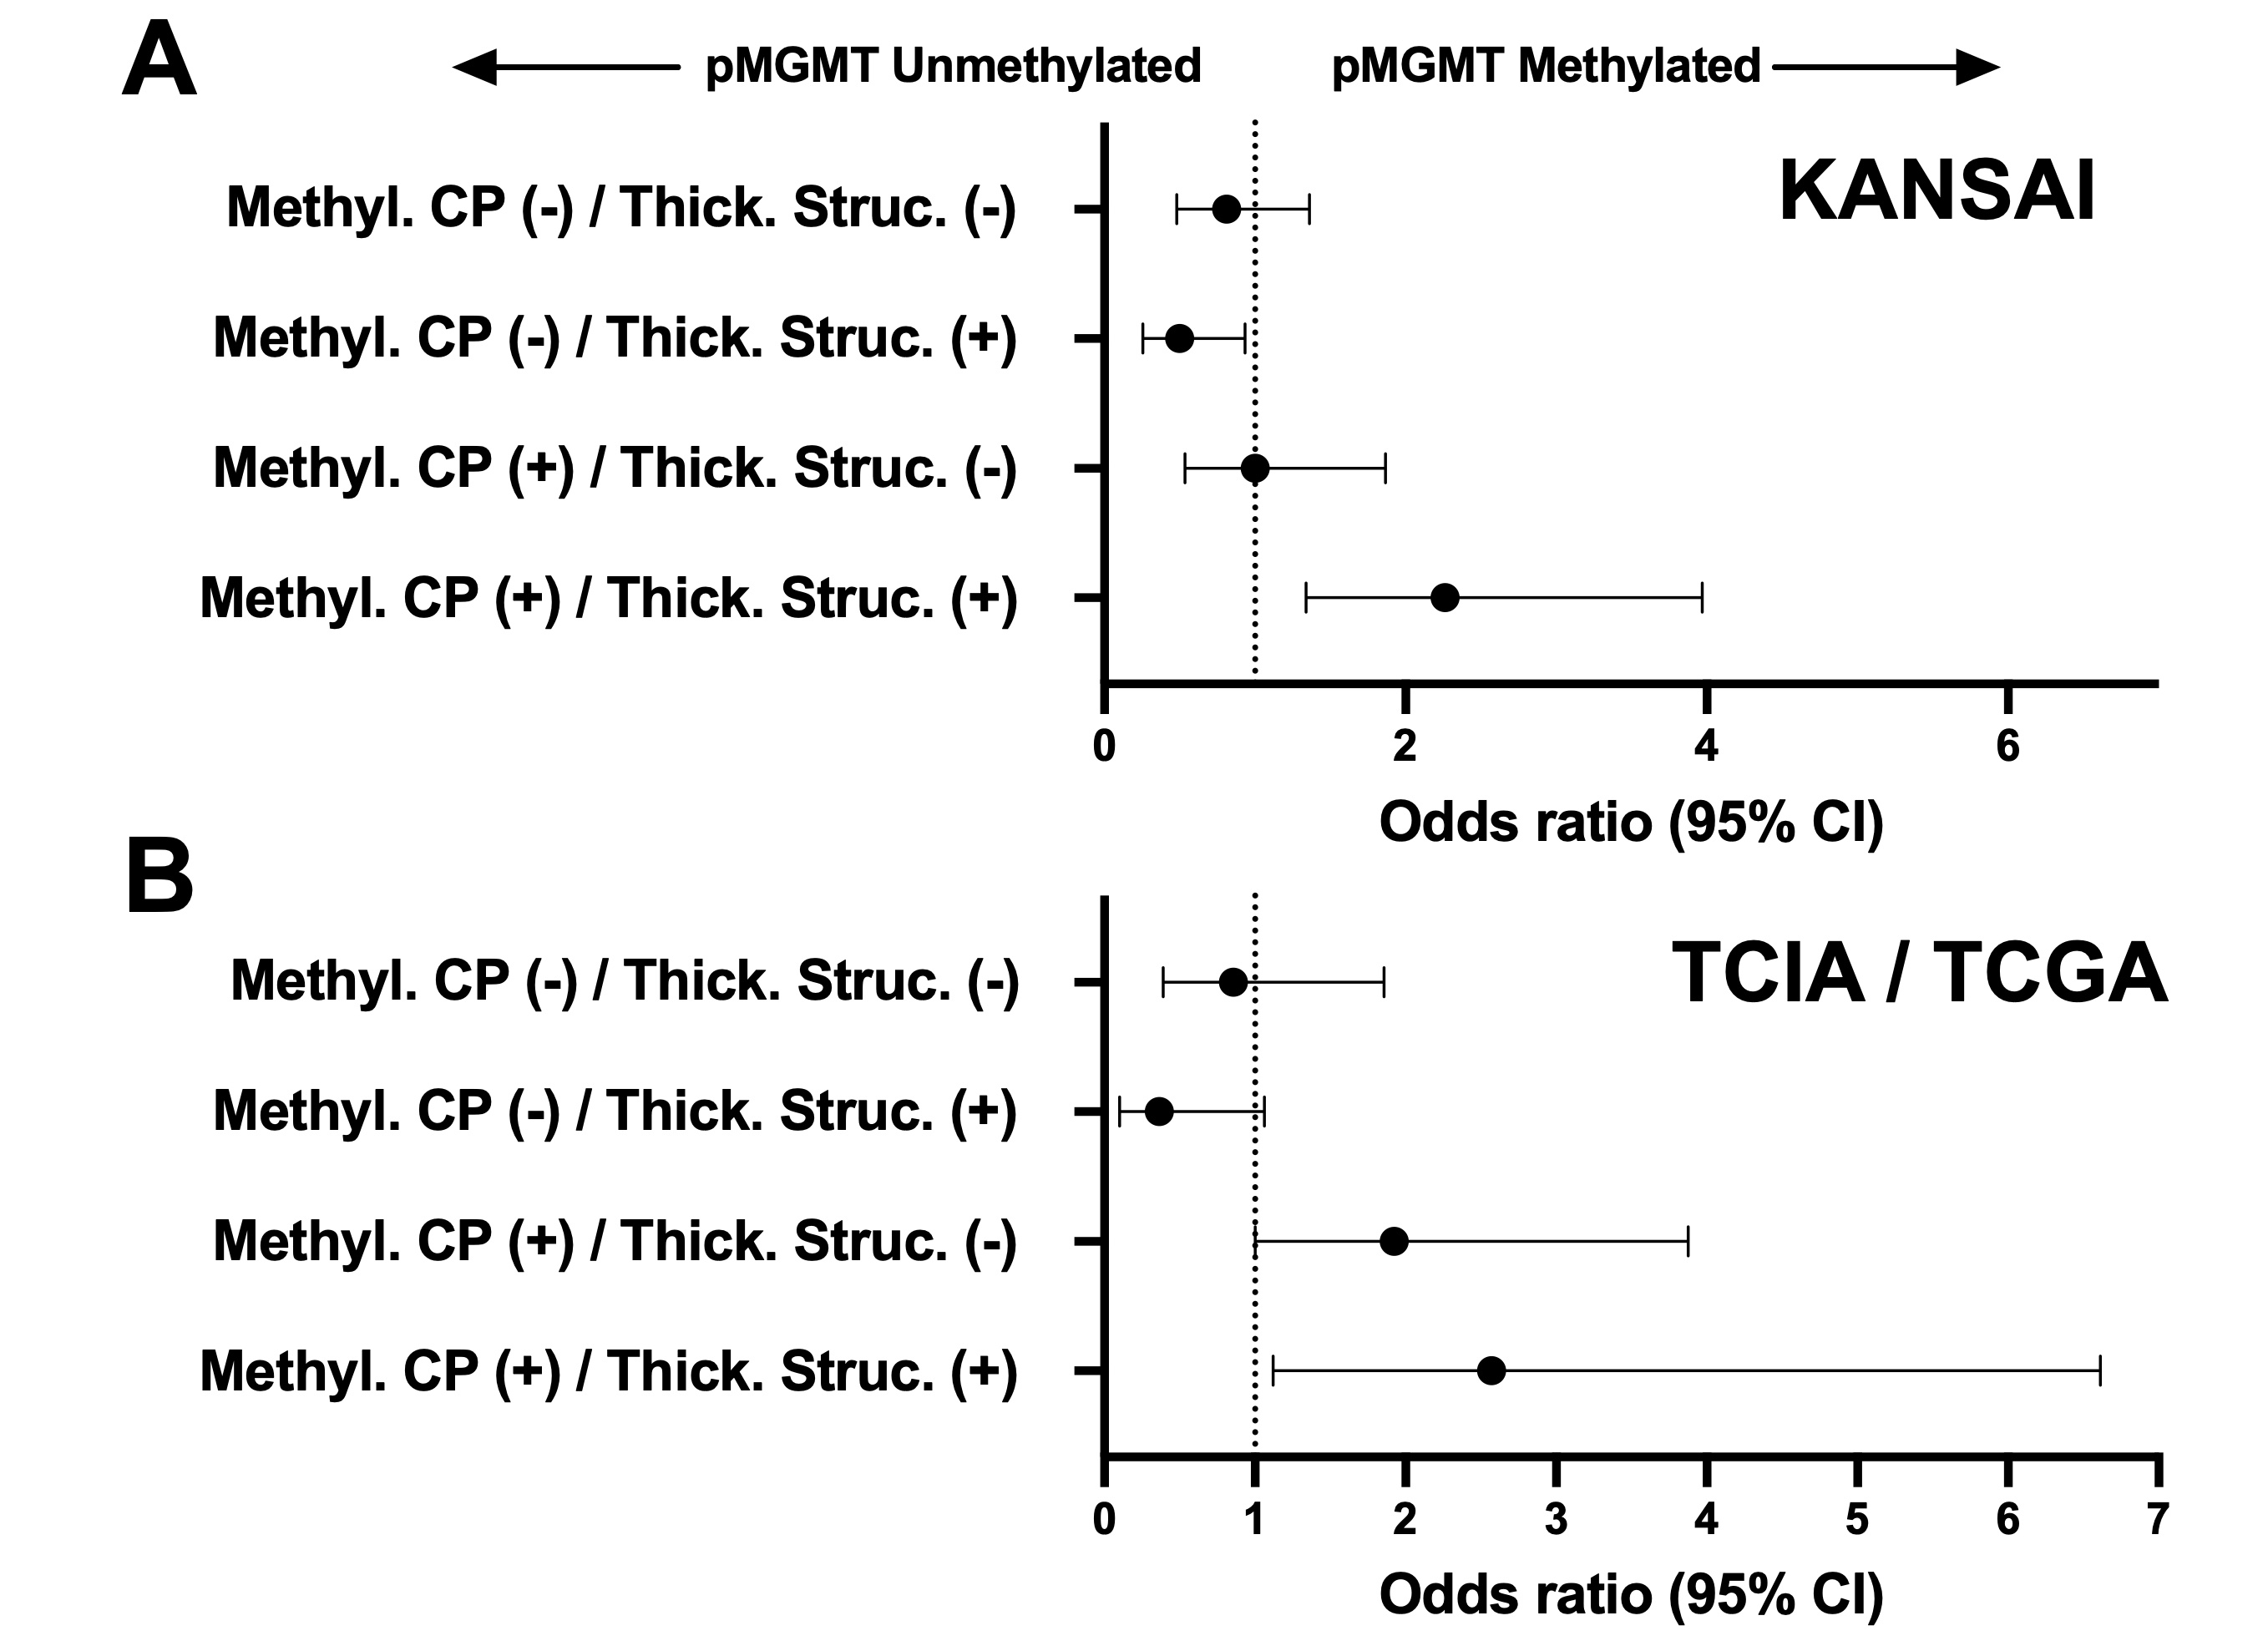
The odds ratios (OR) of the imaging characteristics for predicting GBM’s pMGMT methylation status are presented. The OR of the “Thickened structure” and the “Methylated contrast phenotype” was significantly higher than 1.0 both in the KANSAI exploratory and TCIA / TCGA validation cohort.
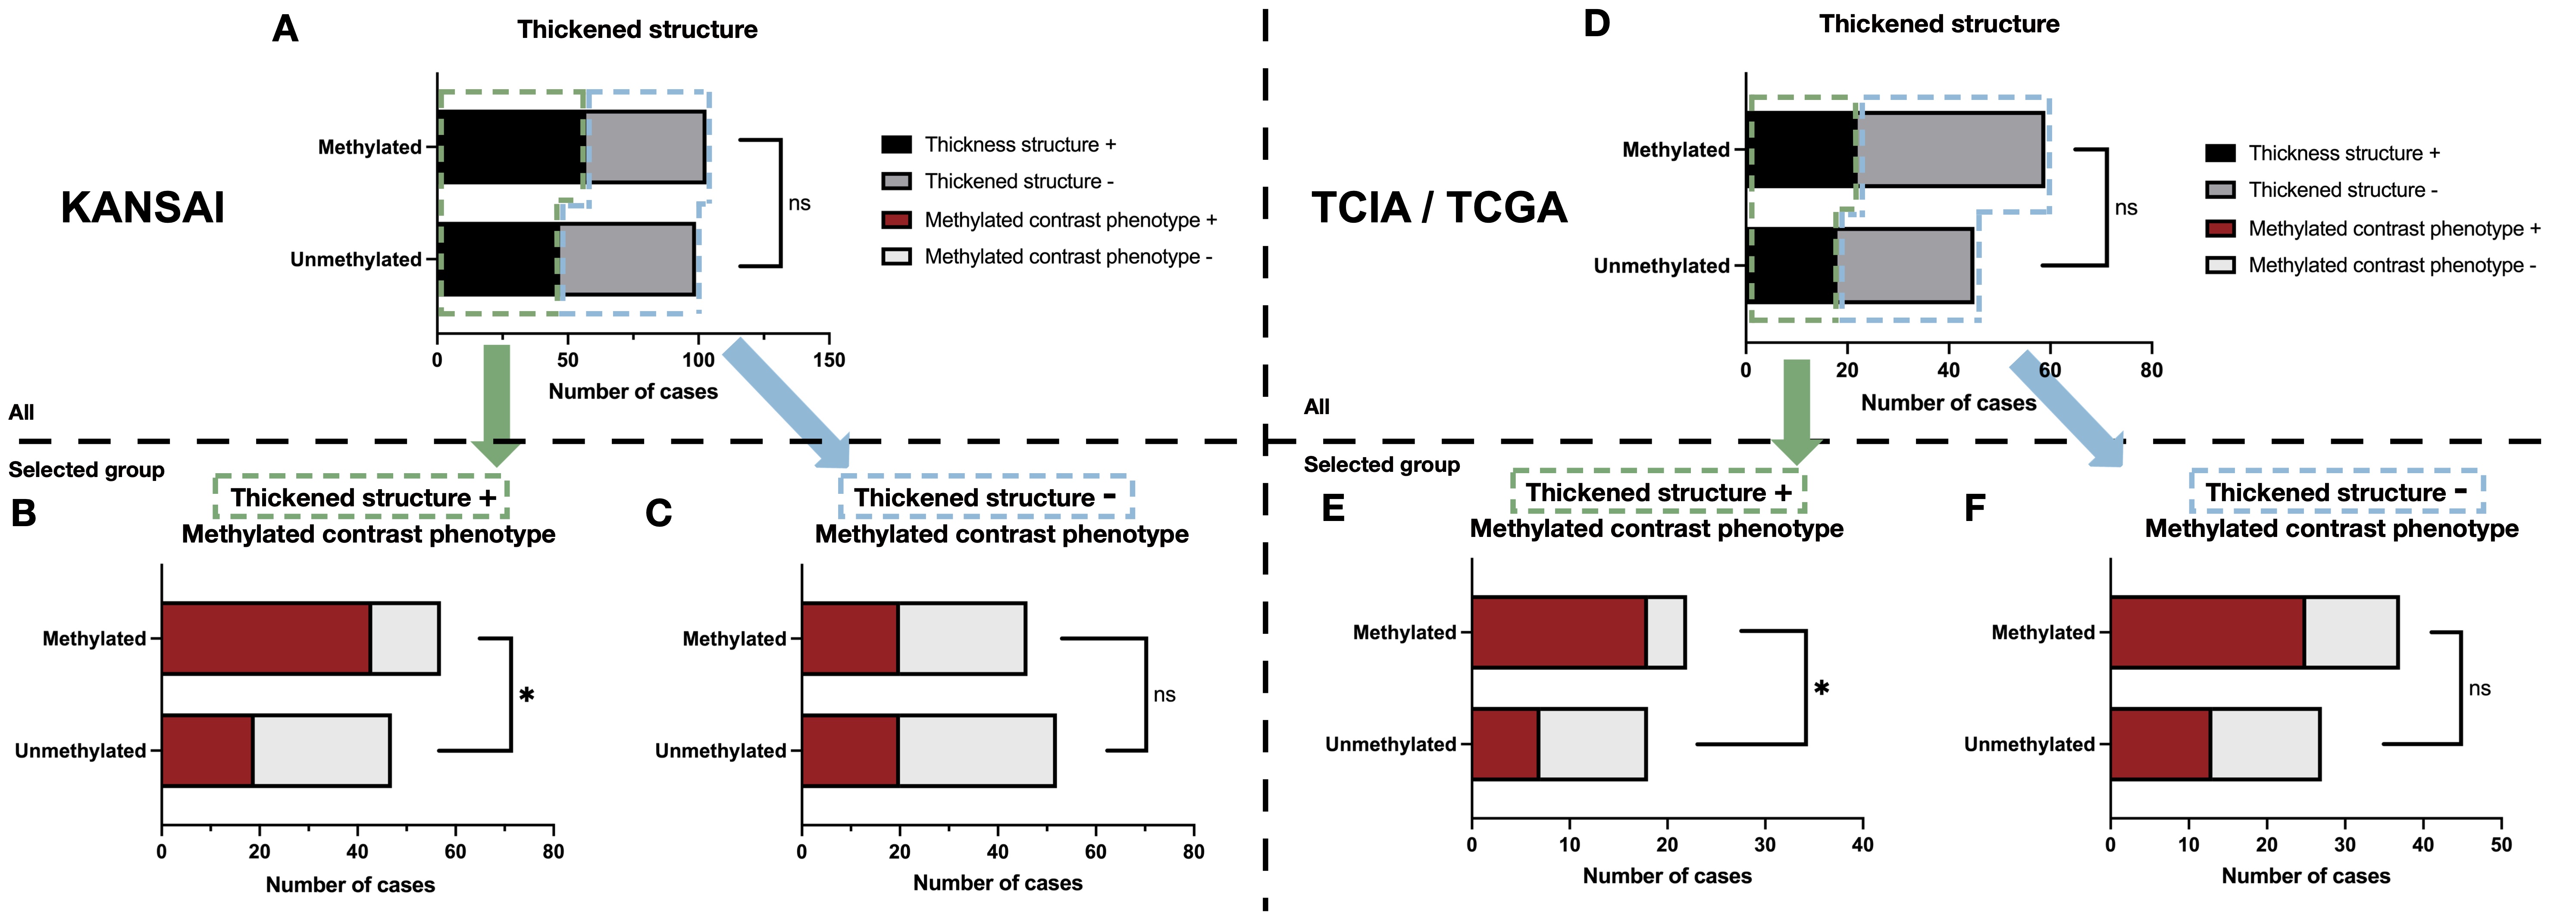
Figure 5.
The correlation between pMGMT methylation status and the “Methylation contrast phenotype” first stratified by the presence or absence of the “Thickened structure” is presented for the KANSAI exploratory cohort (A, p = 0.32). The presence of the “Methylation contrast phenotype” significantly correlated with pMGMT methylation only for the “Thickened structure” present group (B, p < 0.001) and not for the “Thickened structure” absent group (C, p = 0.68). This trend was also consistently observed in the validation cohort (TCIA / TCGA) cohort (D, p = 0.84; E, p = 0.009; F, p = 0.13).