3862
Quantification of BBB Permeability in glioma using ASL with tissue specific T2 values1Biomedical Engineering, Bogazici University, Istanbul, Turkey, 2Amsterdam University Medical Center, Amsterdam, Netherlands, 3Fraunhofer Institute for Digital Medicine MEVIS, Bremen, Germany, 4Department of Pathology, Acibadem University, Istanbul, Turkey, 5Brain Tumor Research Group, Acibadem University, Istanbul, Turkey, 6Department of Neurosurgery, Acibadem University, Istanbul, Turkey, 7mediri GmbH, Heidelberg, Germany, 8Radiology and Nuclear Medicin, Vrije Universiteit Amsterdam, Amsterdam, Netherlands, 9Amsterdam Neuroscience, Brain Imaging, Amsterdam University Medical Center, Amsterdam, Netherlands, 10Helmholtz-Zentrum Dresden-Rossendorf, Dresden, Germany, 11University of Bremen, Bremen, Germany, 12Department of Radiology, Acibadem University, Istanbul, Turkey
Synopsis
Keywords: Tumors (Pre-Treatment), Arterial spin labelling
Motivation: Blood brain barrier arterial spin labeling (BBB-ASL) could assess BBB integrity. However, the assumption of homogeneous T2 in data fitting might be broken in gliomas.
Goal(s): To evaluate the BBB integrity in gliomas with regional tissue-specific T2.
Approach: A mono-exponential T2 fitting was used to obtain tissue-specific T2 values to estimate time of water exchange (Tex) and perfusion (CBF) in the tumor, normal-appearing white (NAWM), and gray matter (NAGM) using ExploreASL.
Results: Higher Tex in NAWM, and lower Tex in the tumor and NAGM were observed and the tumor heterogeneity was better depicted when tissue-specific T2 values were used.
Impact: Water exchange and perfusion maps are highly affected by the tissue T2 value used in BBB-ASL data processing. Applying tissue-specific T2 correction has resulted in a more reliable evaluation of BBB integrity in gliomas.
Introduction
Gliomas are the most common malignant brain tumors, and blood-brain barrier (BBB) breakdown is commonly observed in high-grade gliomas1. Typically, BBB breakdown is assessed by post-contrast (Gd-DTPA) T1-weighted (T1w) MRI. Alternatively, arterial spin labeling MRI (ASL-MRI) could non-invasively assess the BBB breakdown using a multi-echo time (TE) acquisition via T2-based effects quantified in a compartmental model. Common applications of BBB-ASL2,3,4 rely on a constant whole-brain T2 value (85ms) for quantifying the time of water exchange (Tex) and perfusion (CBF). While this assumption is valid in healthy aging and certain pathologies, large T2 changes are common in brain tumors due to their heterogeneous tissue composition and vascularization5,6 and might lead to serious errors in Tex quantification. This study investigated the effect of using regional T2 values in quantifying the CBF and Tex maps in gliomas using BBB-ASL.Method
Six histopathologically proven glioma patients (four glioblastoma (GBM), one oligodendroglioma, and one astrocytoma, F/M=2:4, mean age=55±13.3 years) were scanned on a clinical 3T MRI scanner (Prisma, Siemens Healthineers, Erlangen, Germany) with a 32-channel head coil. Gliomas were classified according to the WHO-CNS 20217. A combination of single-TE and multi-TE Hadamard-encoded pseudo-continuous (pCASL) sequences, implemented using the vendor-independent MRI framework gammaSTAR8, with 3D GRASE readout and two FOCI inversion pulses to suppress background with T1 values of 700 and 1400 ms were used. A single-TE Hadamard-8 matrix was acquired with a sub-bolus duration of 400 ms, post-labeling delay (PLD [ms]) of 600 and 800, TE=13.2 ms, TR=4000 ms, resulting in two sets of seven inflow times (TI [ms]) [1000:400:3400] and [1200:400:3600], respectively. Additionally, a multi-TE Hadamard-4 matrix was acquired with a sub-bolus duration of 1000 ms, PLD of 500 ms, TR 4500 ms, eight TEs [13.8:27.6:207 ms], resulting in datasets with three TIs [1500:1000:3500 ms]. Pre- and post-contrast T1w SPACE (TR=600 ms, TE=12 ms, slice thickness=0.8 mm) were acquired as structural references. Contrast-enhancing regions with substantial BBB disruption were delineated on post-contrast T1w scans. T2 maps were voxel-wise fitted using Eq.1, in which Si is an array of control images acquired using the multi-TE Hadamard-4 sequence, S0 is the M0 image, k is a fitting constant to account for local variations, and TEi are the multiple echo times9.$$S_{i}=kS_{0}e^{-TE_{i}/T2}+noise, \ i=[1,8] \ \ (Eq. 1)$$Mean regional T2 values were calculated within normal-appearing white matter (NAWM), normal-appearing gray matter (NAGM), and contrast-enhancing tumor regions using 3D Slicer10, and used along with the default T2 (85 ms for tissue, 165 ms for blood) for quantifying the CBF and Tex maps using ExploreASL11. First-order histogram values of CBF and Tex maps within the tumor, NAWM, and NAGM regions were computed using Matlab R2021b 9.11 (Mathworks Inc., Natick, MA). A Wilcoxon signed-rank test was used to assess the significant differences between the CBF and Tex valuesResults
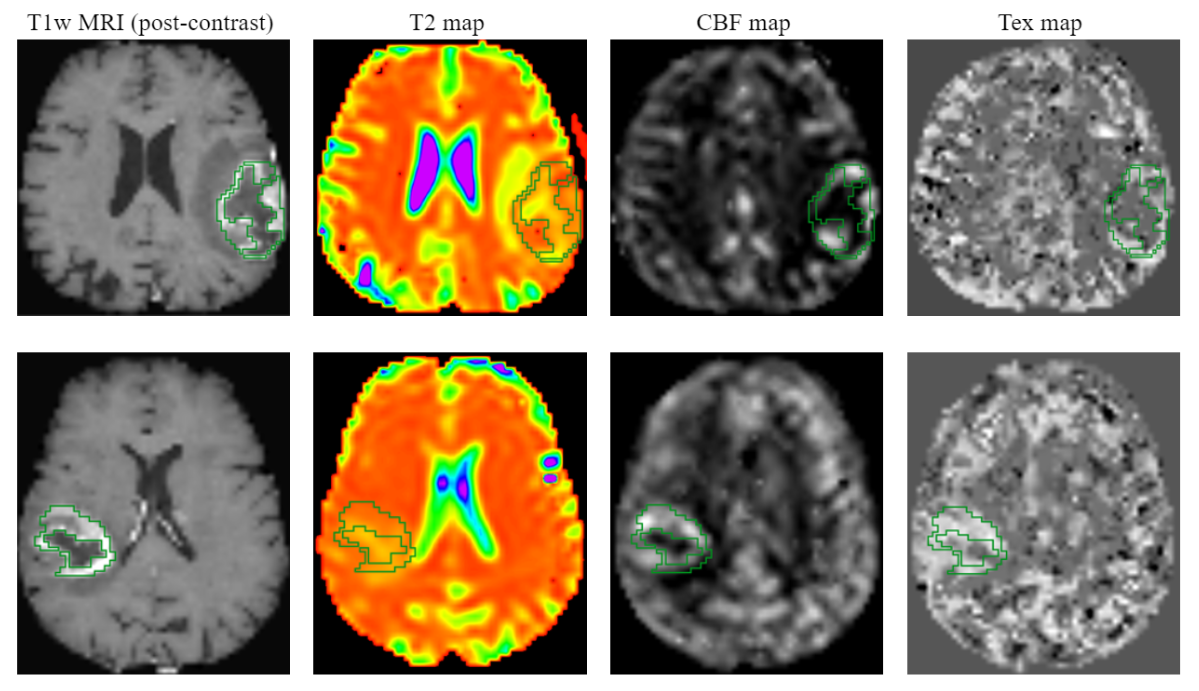
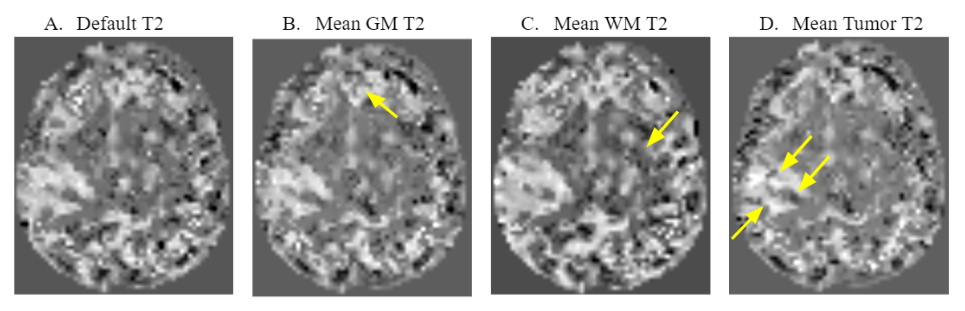
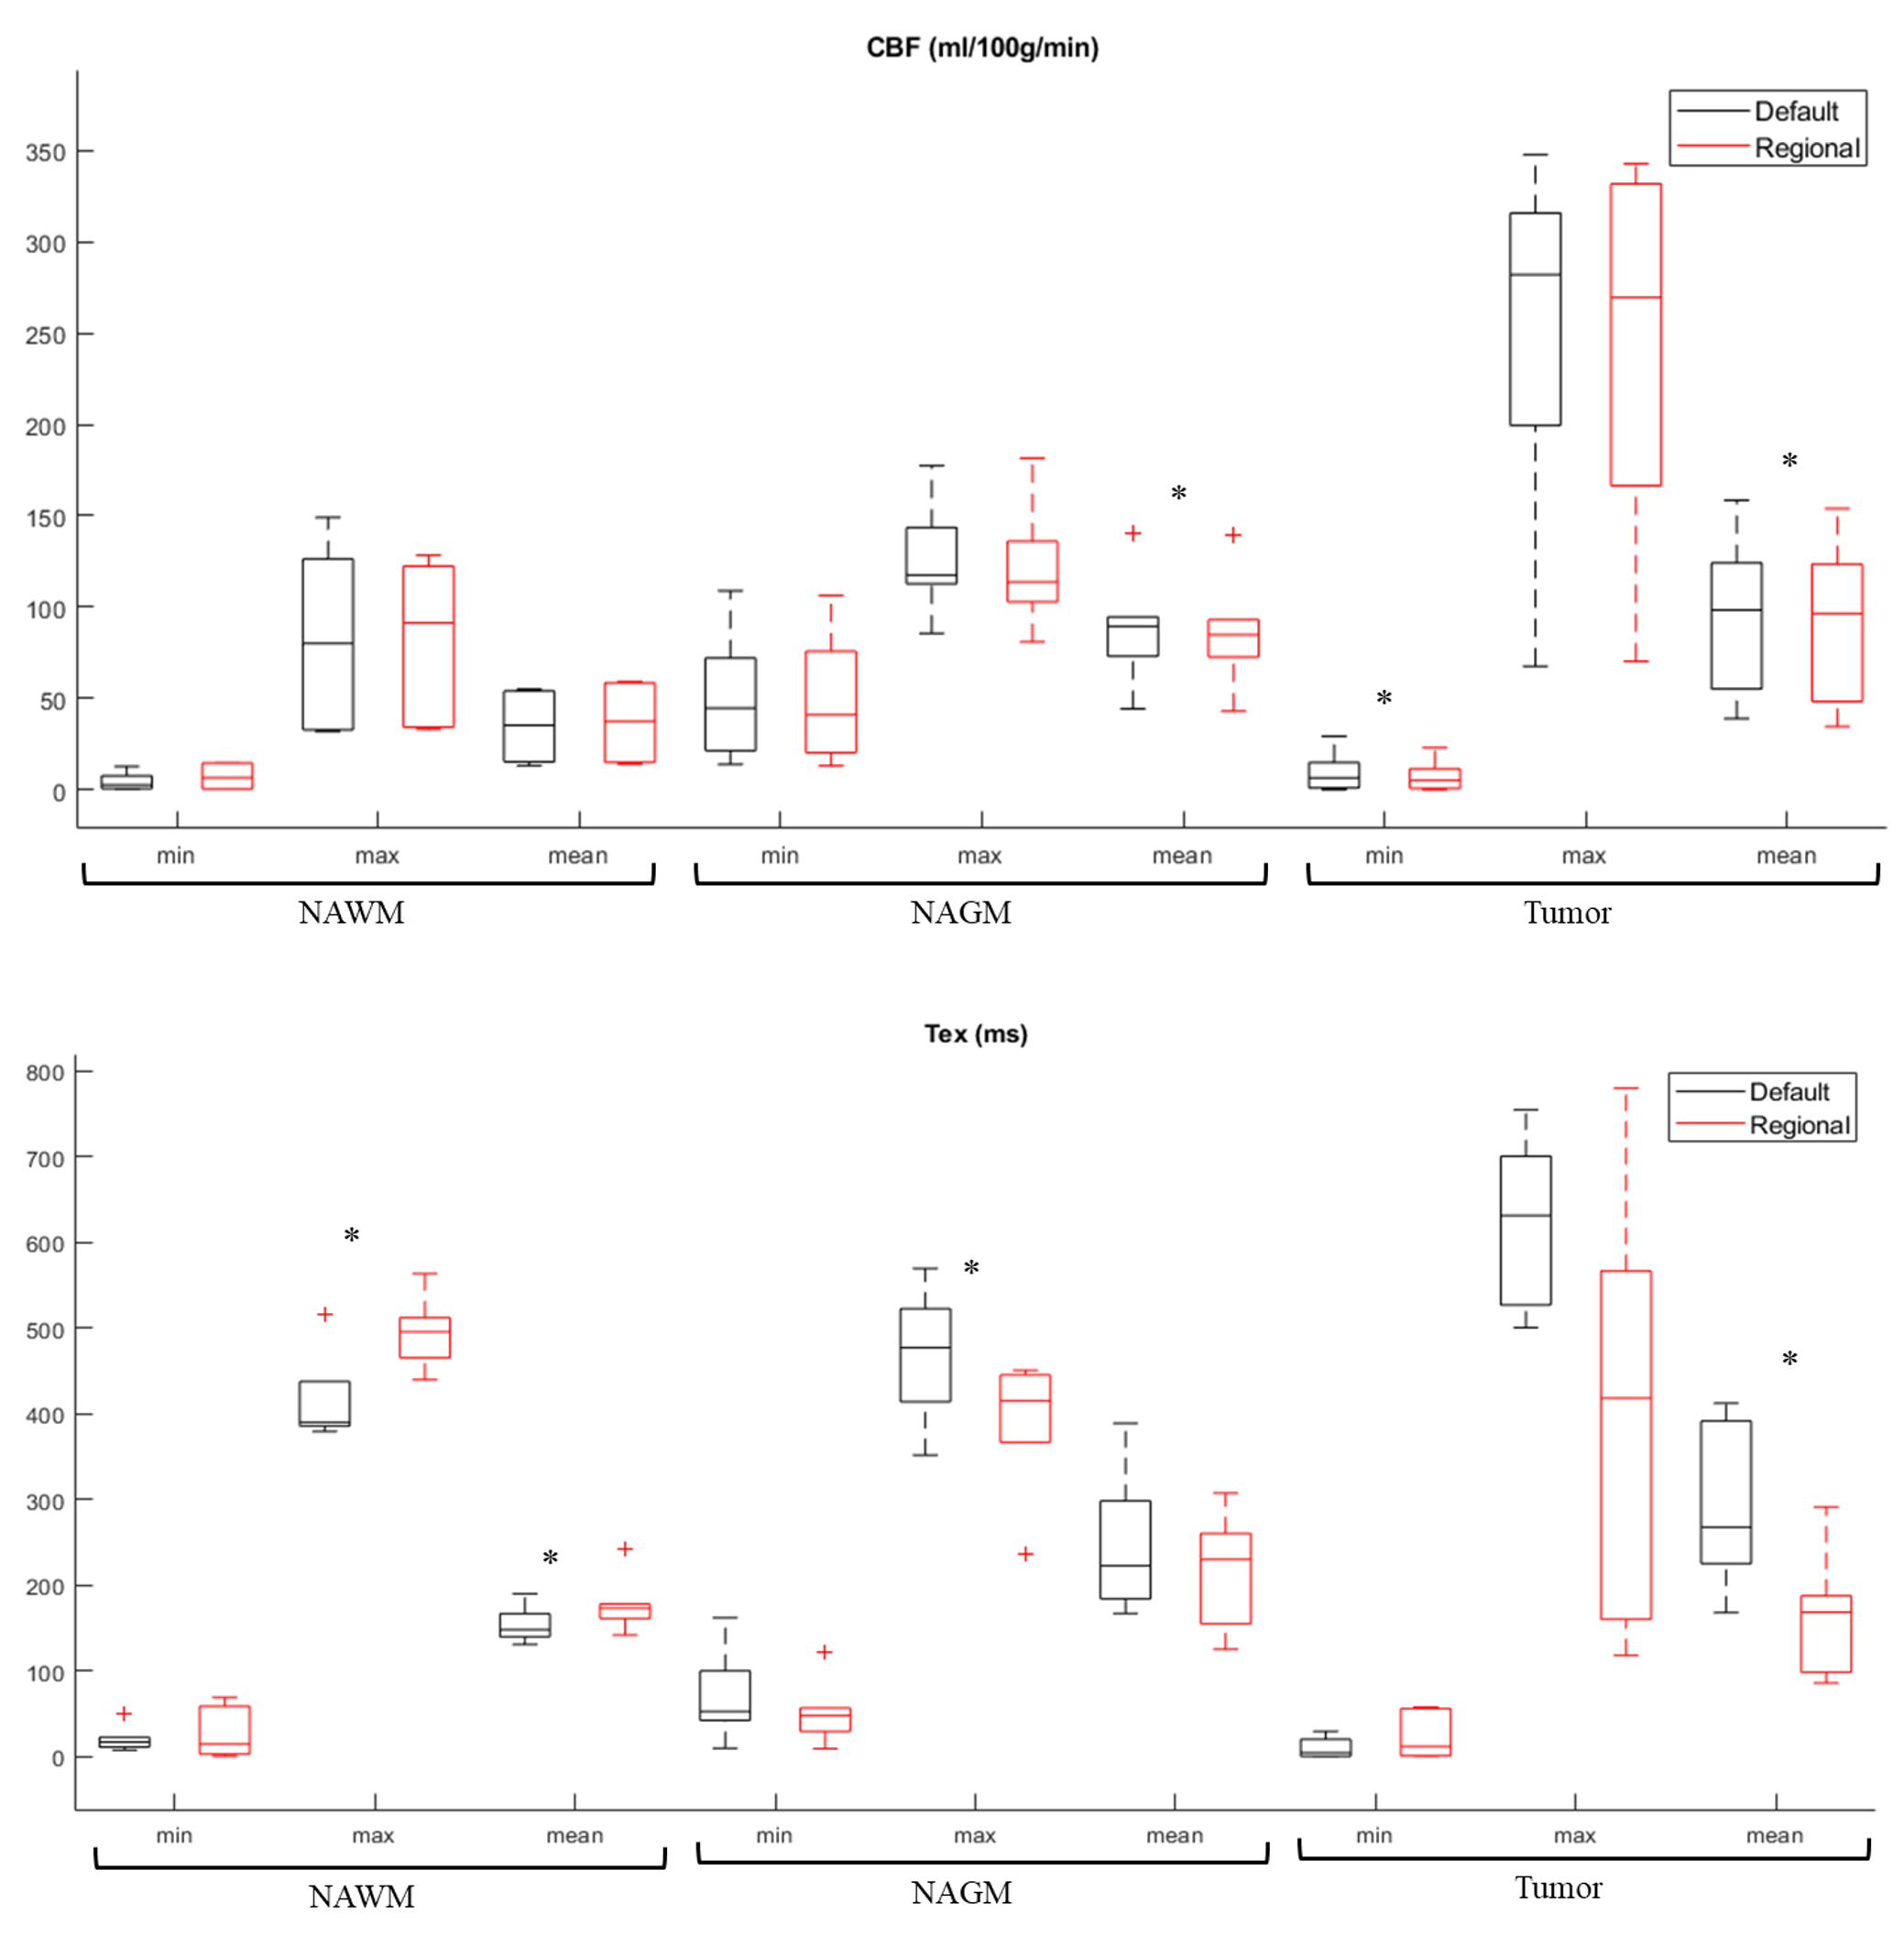
Figure 1 shows T1w MRI and quantified T2, CBF, and Tex maps of two example GBM patients, while the four Tex maps calculated using regional T2 values for patient 2 are depicted in Figure 2. Table 1 presents the mean T2 values for each patient, which ranged from 103.1 to 179.5 in the tumor. Figure 3 represents the boxplots of the CBF and Tex values obtained with the default and regional T2 and their differences. Especially, the Tex values highly varied between the default and the regional T2 models. An increase in the mean and max Tex values at NAWM (p=0.03 for both) and a decrease in mean Tex at the tumor region and max Tex at the NAGM (p=0.03 for both) were observed when their corresponding T2 values were utilized. Additionally, the mean CBF at NAGM and tumor (p=0.03 for both) and the min CBF at tumor (p=0.03) were slightly decreased when corresponding regional T2 values were used.Discussion
In this study, voxel-wise T2 fitting was applied to provide regional T2 values to the BBB-ASL data processing to assess its impact on CBF and Tex maps. This approach has been adopted to evaluate the heterogeneity in the Tex maps in gliomas more reliably. This study showed that using default T2 values may result in slight miscalculations in Tex values and suggests using tissue-specific T2 values instead. In the future, the use of voxel-wise T2 values instead of regionally averaged T2 might allow for improved assessment of water exchange rates in gliomas.Acknowledgements
The DEBBIE project (Developing a non-invasive biomarker for early BBB breakdown in Alzheimer's disease) is an EU Joint Programme -Neurodegenerative Disease Research (JPND) project. It is supported through the following funding organizations under the aegis of JPND -www.jpnd.eu (FWO in Belgium, Canadian Institutes of Health Research in Canada, BMBF in Germany, NFR in Norway, ZonMw in The Netherlands, TUBITAK (grant number 121N030) in Turkey). The project has received funding from the European Union's Horizon 2020 research and innovation programme under the grant agreement No. 825664. This publication is part of the COST Action CA18206 Glioma MR Imaging 2.0, supported by COST (European Cooperation in Science and Technology).References
1. Śledzińska P, Bebyn MG, Furtak J, Kowalewski J, Lewandowska MA. Prognostic and predictive biomarkers in gliomas. Int J Mol Sci. 2021;22(19). doi:10.3390/ijms221910373
2. Mahroo A, Buck MA, Huber J, et al. Robust Multi-TE ASL-Based Blood–Brain Barrier Integrity Measurements. Front Neurosci. 2021;15. doi:10.3389/fnins.2021.719676
3. Mahroo A, Konstandin S, Günther M. Blood–Brain Barrier Permeability to Water Measured Using Multiple Echo Time Arterial Spin Labeling MRI in the Aging Human Brain. Journal of Magnetic Resonance Imaging. Published online 2023. doi:10.1002/jmri.28874
4. Turhan G, İrem Çetin A, Mahroo A, et al. Perfusion and Time of Exchange Measurements Using BBB-ASL in Gliomas: The Initial Experience.
5. Gu W, Fang S, Hou X, Ma D, Li S. Exploring diagnostic performance of T2 mapping in diffuse glioma grading. Quant Imaging Med Surg. 2021;11(7):2943-2954. doi:10.21037/qims-20-916
6. Nakai K, Nawashiro H, Shima K, Kaji T. An analysis of T2 mapping on brain tumors. Acta Neurochir Suppl. 2013;118:195-199. doi:10.1007/978-3-7091-1434-6_36
7. Louis DN, Perry A, Wesseling P, et al. The 2021 WHO Classification of Tumors of the Central Nervous System: a summary. Neuro Oncol. 2021;23(8):1231-1251. doi:10.1093/neuonc/noab106
8. Cordes C, Konstandin S, Porter D, Günther M. Portable and platform‐independent MR pulse sequence programs. Magn Reson Med 2020;83(4):1277–90.
9. Milford D, Rosbach N, Bendszus M, Heiland S. Mono-exponential fitting in T2-relaxometry: Relevance of offset and first echo. PLoS One. 2015;10(12). doi:10.1371/journal.pone.0145255
10. Fedorov A, Beichel R, Kalpathy-Cramer J, et al. 3D Slicer as an image computing platform for the Quantitative Imaging Network. Magnetic Resonance Imaging. doi:10.1016/j.mri.2012.05.001
11. Mutsaerts HJMM, Petr J, Groot P, et al. ExploreASL: An image processing pipeline for multi-center ASL perfusion MRI studies. Neuroimage. 2020;219. doi:10.1016/j.neuroimage.2020.117031
Figures