3860
Decoding the Heterogeneity of Glioma IDH Genotyping by DCE-MRI of Spatial Habitat Analysis: A Feasibility Study1Department of Radiology, The First Hospital of China Medical University, Shenyang, China, 2MR Research Collaboration, Siemens Healthineers, Beijing, China, 3MR Research Collaboration, Siemens Healthineers, Shanghai, China
Synopsis
Keywords: Tumors (Pre-Treatment), DSC & DCE Perfusion
Motivation: To evaluate dynamic contrast enhanced (DCE) MRI for assessing heterogeneity in glioma IDH genotyping and derive a combined map.
Goal(s): To predict specific tumor areas and to guide biopsy and precision molecular typing therapy.
Approach: Whole tumor volumes were delineated on DCE images, and voxel-wise clustering of each quantitative imaging map identified five combined physiologic MRI habitats.
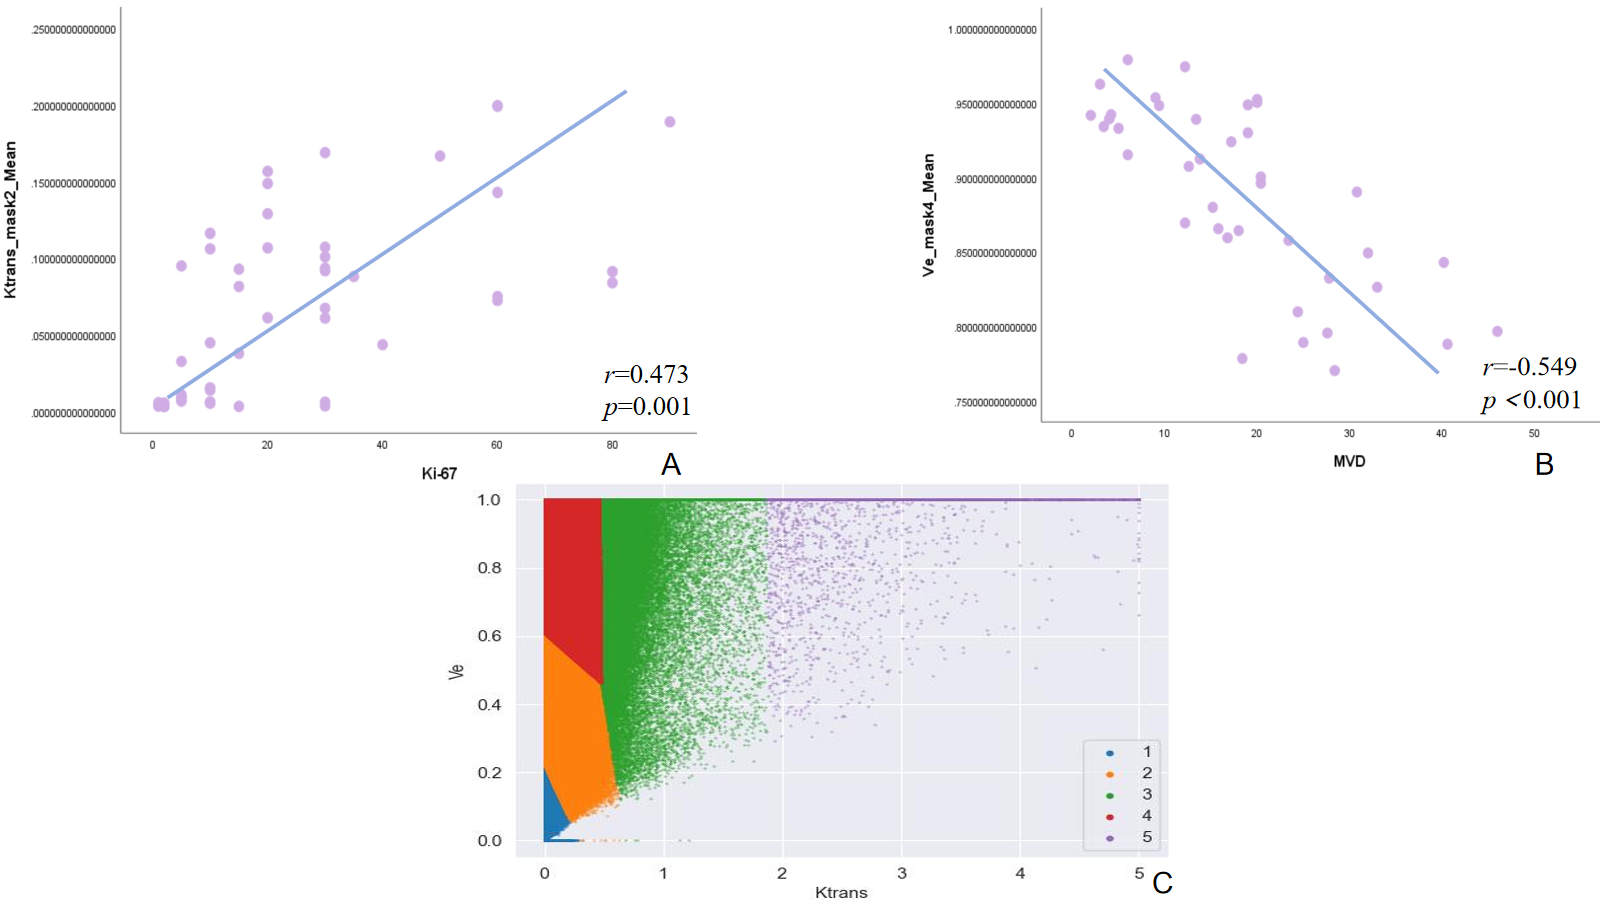
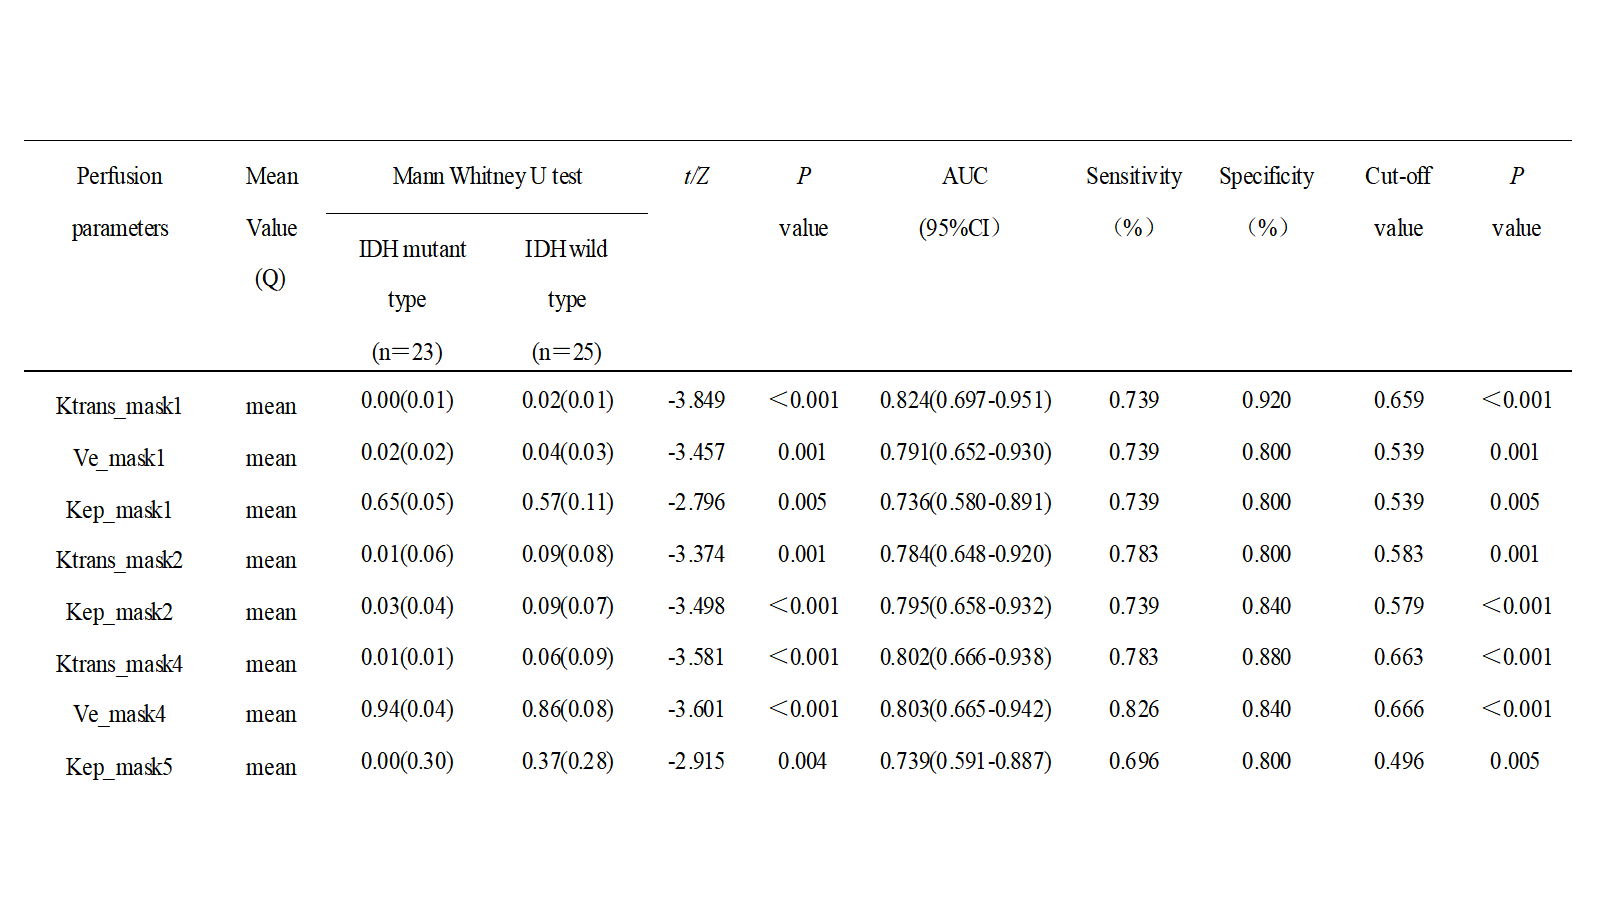
Results: DCE-Ktrans within necrosis subregion (mask1) emerged as the best parameter to identify IDH status (AUC=0.824, p<0.001), while DCE-Ktrans within mild reinforcement region (mask 2) was positively correlated with Ki-67(r=0.473, p=0.001) and DCE-Ve of middle reinforcement (mask 4) was positively correlated with microvessel density (MVD)(r=-0.549, p<0.001).
Impact: Based on the habitat analysis of MR perfusion imaging, glioma was divided into different sub-regions, which reflected biological information such as necrosis, hypoxia, and angiogenesis, predicted molecular classification and guided clinical biopsy or surgical sampling accurately to guide precision therapy.
Introduction
At present, The World Health Organization(WHO)2021central nervous system(CNS5)[1] simplifies the classification and grading criteria for adult diffuse gliomas, dividing them into three types: astrocytoma(AT), IDH(isocitrate dehydrogenase) mutation; oligodendroglioma (OD), IDH mutation and 1p/19q(the short arm of Chromosome 1 and the long arm of Chromo- some 19) co-deletion; glioblastoma(GB), IDH wild-type. In addition, TERT(telomere reverse transcriptase promoter) promoter mutation as a diagnostic criterion for IDH wild-type glio- blastoma, and MGMT(O6-methylguanine-DNA methyltransferase) methylated[2]were sensiti- ve to chemotherapy and radiotherapy,such as temozolomide[3].These molecular subtypes are available and meaningful for patients of glioma in clinical practice. Accumulating evidence[4-6]suggests that intratumoral heterogeneity and divergent development of subpopulations of tumor microenvironment(TME) within the same tumor are probably the keys for understanding treatment failure. And the heterogeneity of GB and the complex interactions between TME have broad implications[7].This dynamic interaction helps establish hypoxic and necrotic tumor areas[8], infiltrate surrounding thin-walled tissues, resist radiation chemotherapy, and promote tumor angiogenesis and invasion. In recent years, TME has been recognized as an important therapeutic target in GB. Some important features distinguish the normal brain from other tissues, such as the composition of the microenvironment around the tumor cells, the presence of the blood-brain barrier, and others[9].Therefore, they may become key imaging biomarkers for elucidating pathophysiological mechanisms, including therapeutic resistance and recurrence. However, due to its invasiveness and repeatability(surgery or biopsy),high cost (PET), most available technologies are not suitable for in vivo characterization in the human body.Dynamic contrast-enhanced MRI (DCE)[10-12]have been verified that the dynamic parameters including volume transfer constant (Ktrans),extravascular extracellular volume fraction(Ve) and rate constant (kep) were correlated with microvascular parameters in important tissues, as well as abnormal blood-brain barrier in the infiltrating area.In this study, we built on DCE-MRI method and hypothesized that by combining imaging biomarker information related to neo-vascularization with quantitative features to capture glioma heterogeneity of different types genotyping in the tumor habitat constituting, so that we can more accurately understand the intratumoral heterogeneity in the pathophysiology of human glioma. We refer to our method as habitat mapping.Methods
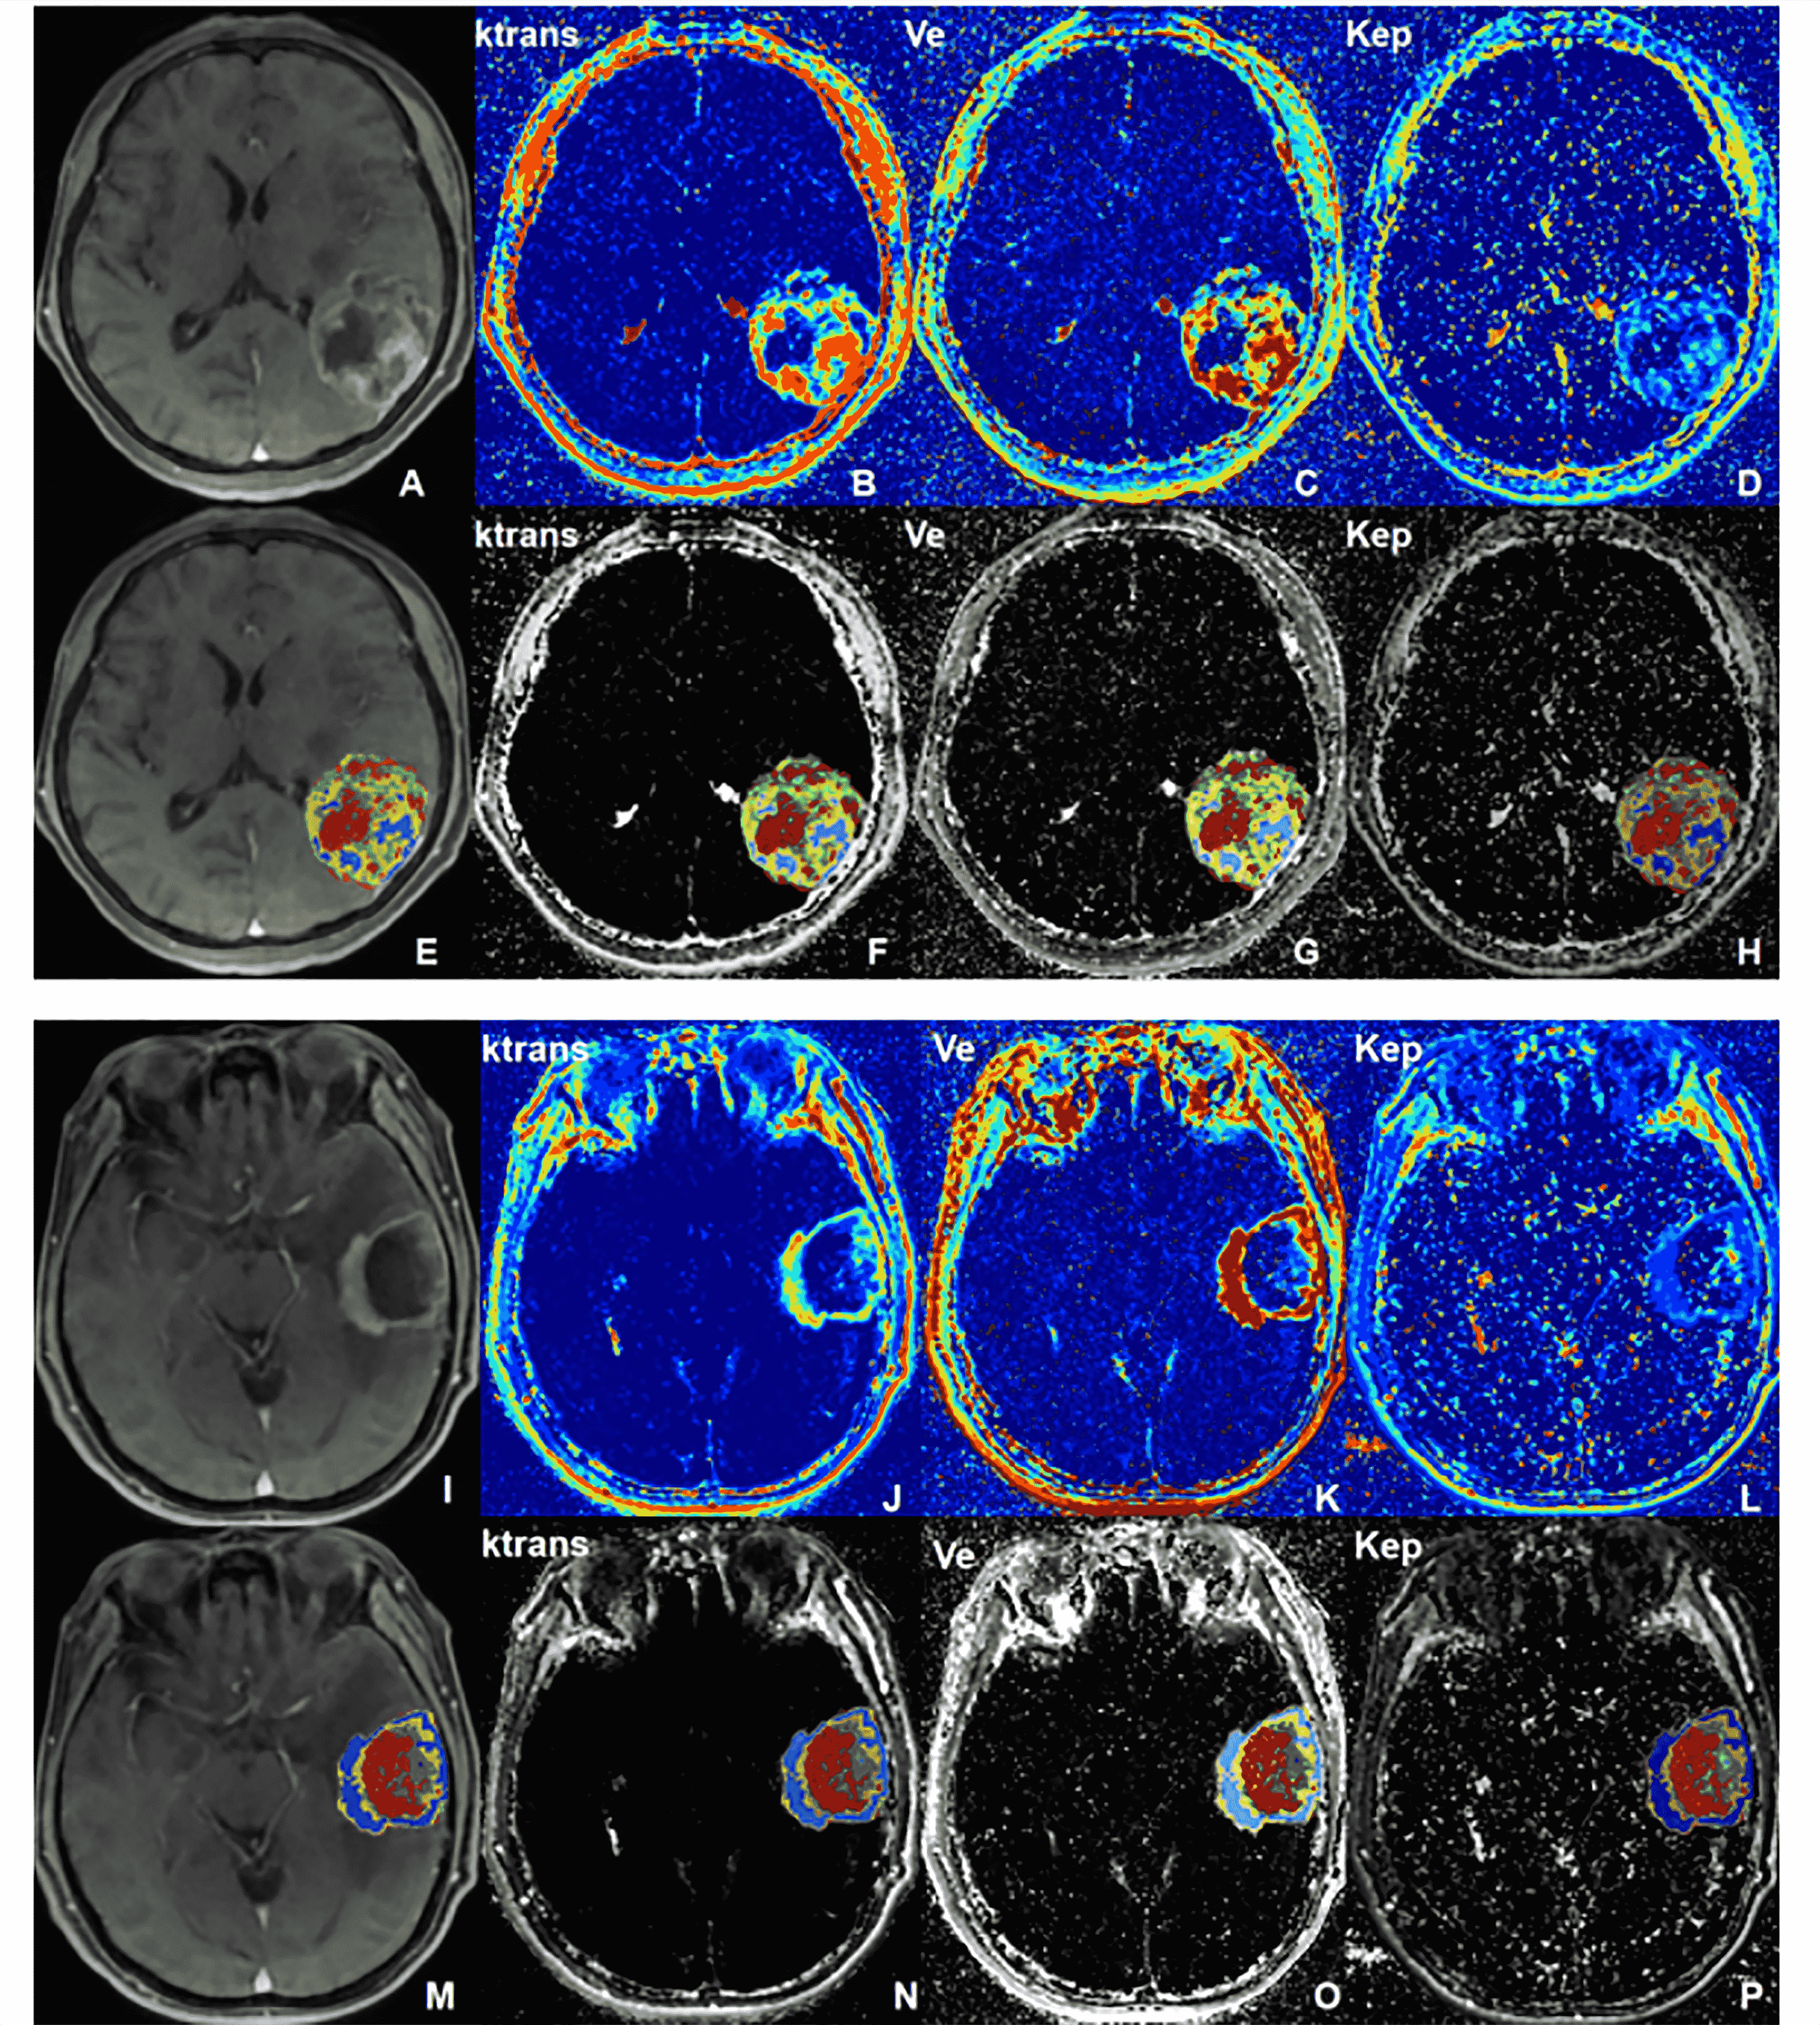
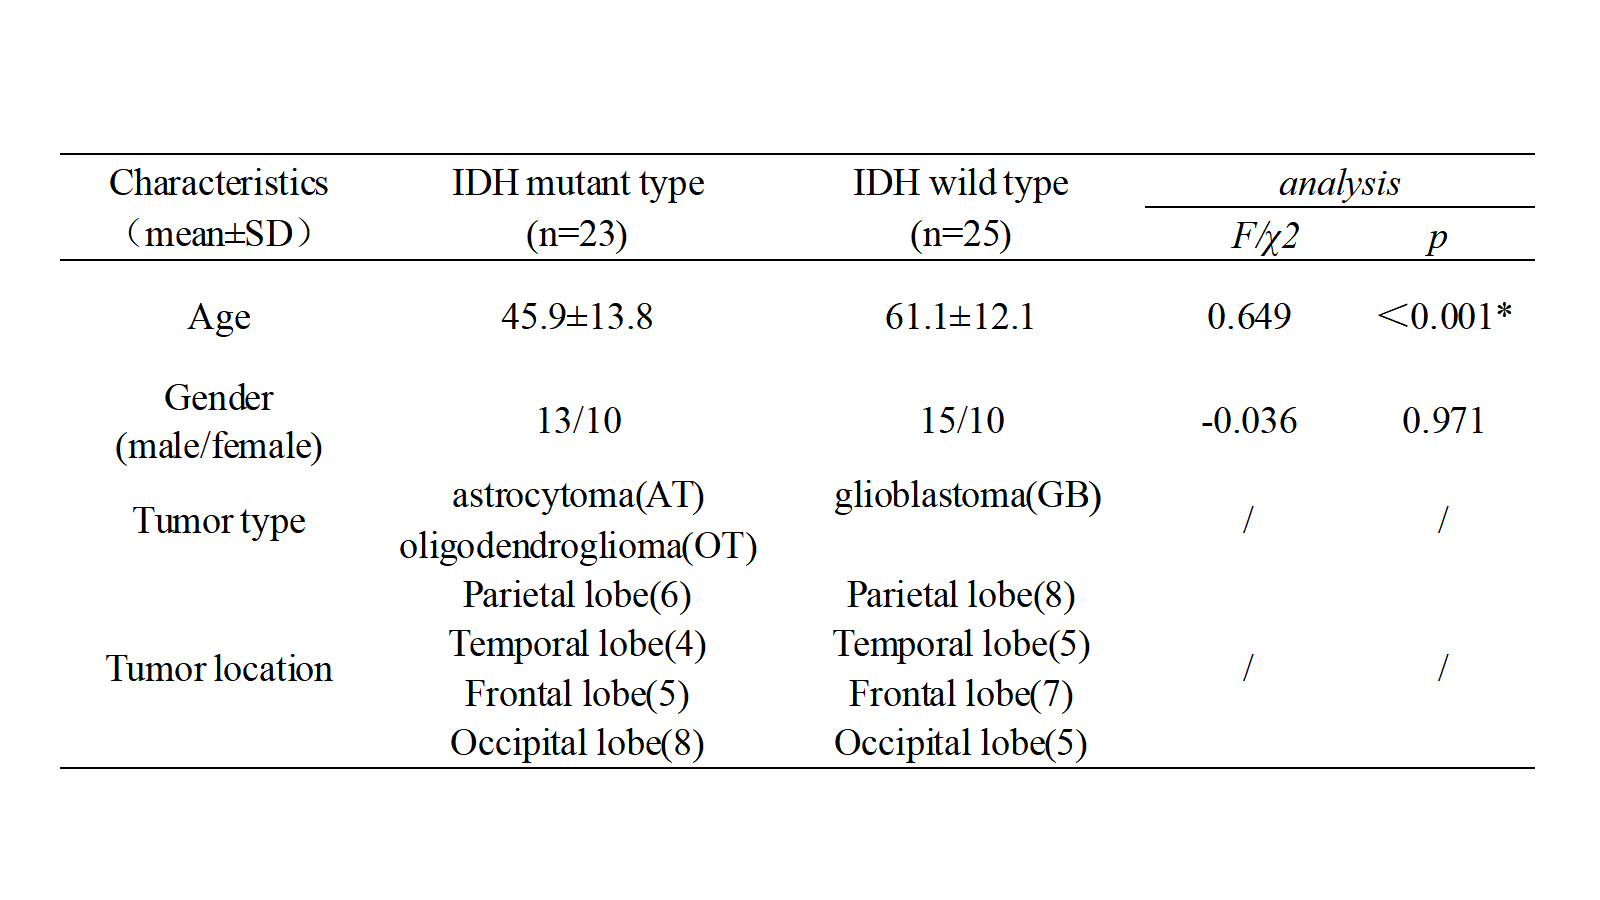
Subjects and MRI acquisition: In this prospective study, forty-nine patients with brain glioma were enrolled including 23 IDH mutant-25 IDH wild type. All participants underwent routine MRI examinations including DCE on a 3T systems with the following scanning parameters: repetition time (TR)/echo time (TE) = 5.1/2.6 ms, multiple flip angles = 3°, 6°, 9°, 12°, and 15°, slice number = 28, slice thickness = 4.0 mm, layer spacing = 0 mm, field of view (FOV) = 240 × 240 mm2, matrix size = 192 × 192, Nex = 1.0. Data processing: Firstly, DCE data was analyzed by image processing software (Omni-kinetics Version V2.1.1R ; General Electric) to calculate the parameters of Pharmacokinetic Model including Ktrans, kep, Ve maps in Standard Tofts’ model. (Fig1A-1D,1I-1L). Secondly, the Volume of interest (VOI) of the entire tumor was manually delineated layer by layer by a neuro-radiologist with 10 years of experience on the original images of the final stage of DCE for each patient using ITK-SNAP(http://www.Itksnap.org). Thirdly, ROIs and perfusion parameter maps obtained through the above steps were analyzed using nnFAE software and selecting kmeans algorithm with 5 clustering to calculated quantitative features and habitat maps(Fig1E-1H,1M-1P).Results
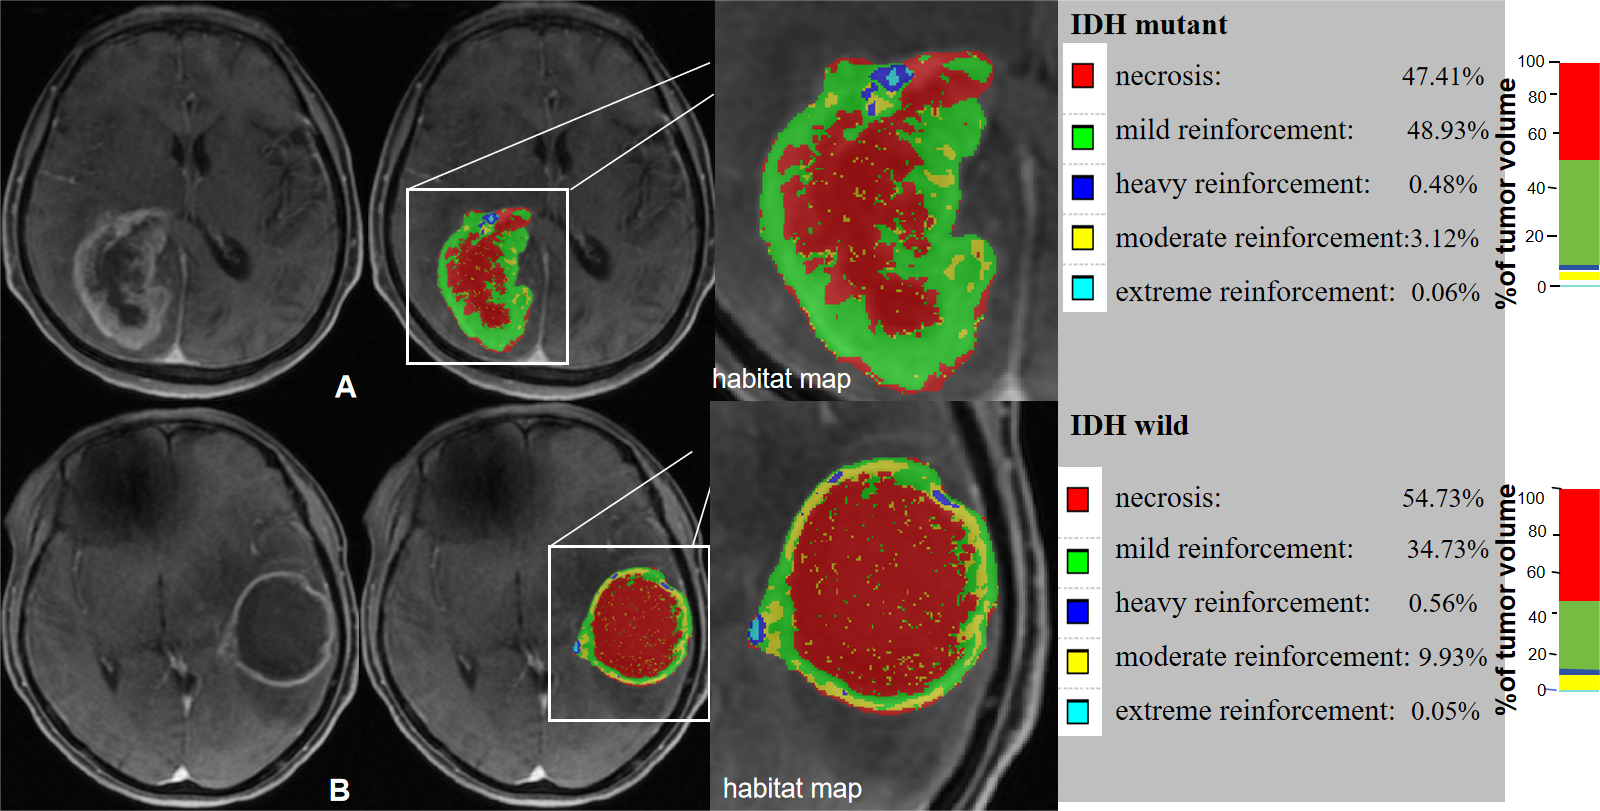
Comparisons of demographic and clinical characteristics between the groups were shown in Table1. Based on the DCE images and habitat maps, the whole tumor can be divided into five sub-regions, which were regarded as necrosis(mask1/red), mild reinforcement(mask2/green), middle reinforcement(mask4/yellow) , heavy reinforcement (mask3/cyan), and extreme reinforcement(mask5/blue) as shown in the scatter plot(Fig3C). Among five sub-regions, there was no significant difference in mask3 between groups. Ktrans_mask1 provided the optimal differential diagnostic efficiency for IDH genotyping(AUC=0.824, p<0.001). Mask5 was not segmented in every tumor, and just Kep_mask5 had statistical difference (AUC=0.739, p=0.005). In IDH mutant-type or IDH wild-type, both Ve and Kep values can identify mask2 and mask4(p<0.001)(Table2). Furthermore, Ktrans_mask2 and Ve_mask4 were correlated with Ki-67 and MVD, respectively (Fig3A-B).Discussion
A highly reproducible distribution pattern of the clusters was observed between IDH genotyping, particularly with respect to morphological landmarks as the necrotic region, mild、middle and severe contrast-enhancing regions, providing valuable biological information compared with conventional imaging. Furthermore, after Pearson correlation analysis, identified a reliable correlation between the expected microenvironment of the different clustering sub-regions and the actual histopathological features. This was confirmed in Stadlbauer A's research[13].Conclusion
Habitat analysis based on DCE-MRI can decode the heterogeneity of IDH molecular typing and be used as imaging markers identifying IDH status and guiding clinical biopsy or surgery.Acknowledgements
No acknowledgement found.References
[1] Louis D N,Perry A,Wesseling P,et al (2021).The 2021 WHO classification of tumors of the central nervous system:a summary.Neuro Oncol 23(8):1231-1251.
[2] Hegi ME, Diserens AC, Gorlia T, et al(2005). MGMT gene silencing and benefit from temozolomide in glioblastoma. N Engl J Med 352(10):997-1003.
[3] Wick W, Hartmann C, Engel C, et al(2009). NOA-04 randomized phase III trial of sequential radiochemotherapy of anaplastic glioma with procarbazine, lomustine, and vincristine or temozolomide. J Clin Oncol 27(35):5874-80.
[4] Goenka A, Tiek D, Song X, et al(2021). The Many Facets of Therapy Resistance and Tumor Recurrence in Glioblastoma. Cells. 2021;10(3):484.
[5] Valtorta S, Salvatore D, Rainone P, et al(2020). Molecular and Cellular Complexity of Glioma. Focus on Tumour Microenvironment and the Use of Molecular and Imaging Biomarkers to Overcome Treatment Resistance. Int J Mol Sci. 2020;21(16):5631.
[6] Hardee ME, Zagzag D(2012). Mechanisms of glioma-associated neovascularization. Am J Pathol. 2012;181(4):1126–1141.
[7] Dapash M, Hou D, Castro B, et al(2021). The Interplay between Glioblastoma and Its Microenvironment. Cells. 2021 Aug 31;10(9):2257.
[8] Boyd NH, Tran AN, Bernstock JD, et al(2021). Glioma stem cells and their roles within the hypoxic tumor microenvironment. Theranostics. 2021;11(2):665-683.
[9] Bao Z, Wang Y, Wang Q, et al(2021). Intratumor heterogeneity, microenvironment, and mechanisms of drug resistance in glioma recurrence and evolution. Front Med. 2021;15(4):551-561.
[10] Xue W, Du X, Wu H, et al (2017). Aberrant glioblastoma neovascularization patterns and their correlation with DCE-MRI-derived parameters following temozolomide and bevacizumab treatment.Sci Rep7(1):13894.
[11] Keil VC, Gielen GH, Pintea B, et al (2021). DCE-MRI in Glioma, Infiltration Zone and Healthy Brain to Assess Angiogenesis: A Biopsy Study. Clin Neuroradiol 31(4):1049-1058.
[12] Wang J, Hu Y, Zhou X, et al(2022). A radiomics model based on DCE-MRI and DWI may improve the prediction of estimating IDH1 mutation and angiogenesis in gliomas. Eur J Radiol. 2022;147:110141.
[13] Stadlbauer A, Oberndorfer S, Zimmermann M, et al(2020). Physiologic MR imaging of the tumor microenvironment revealed switching of metabolic phenotype upon recurrence of glioblastoma in humans. J Cereb Blood Flow Metab. 2020 Mar;40(3):528-538.
Figures