3857
Evaluating the potential of SWI-EPI MRI towards Glioma grading1Centre for Biomedical Engineering, Indian Institute of Technology Delhi, New Delhi, India, 2Department of Radiology, Fortis Memorial Research Institute, Gurgaon, India, 3Department of Biomedical Engineering, All India Institute of Medical Sciences, Delhi, New Delhi, India, 4Yardi School of Artificial Intelligence (ScAI), Indian Institute of Technology Delhi, New Delhi, India
Synopsis
Keywords: Tumors (Pre-Treatment), Brain, Blood vessels
Motivation: Echo planar based SWI (SWI-EPI) can provide better contrast of vasculature and higher spatial resolution compared to SWI and at shorter acquisition time. However, its potential in glioma grading has not been explored well.
Goal(s): To evaluate the potential of SWI-EPI for automatic segmentation and quantification of tumor vasculature for glioma grading.
Approach: Tumor vasculature for both SWI and SWI-EPI images were segmented and quantified. T-test and ROC curve analysis was used to determine statistical significance and grading accuracy.
Results: Tumor vasculature features automatically computed from SWI-EPI provided improved glioma grading accuracy compared to conventional SWI based features.
Impact: SWI-EPI offers advantages over SWI images in terms of image resolution and shorter acquistion time. It was found to have improved glioma grading accuracy and has the potential to be used as a routine imaging sequence in clinical settings.
Introduction
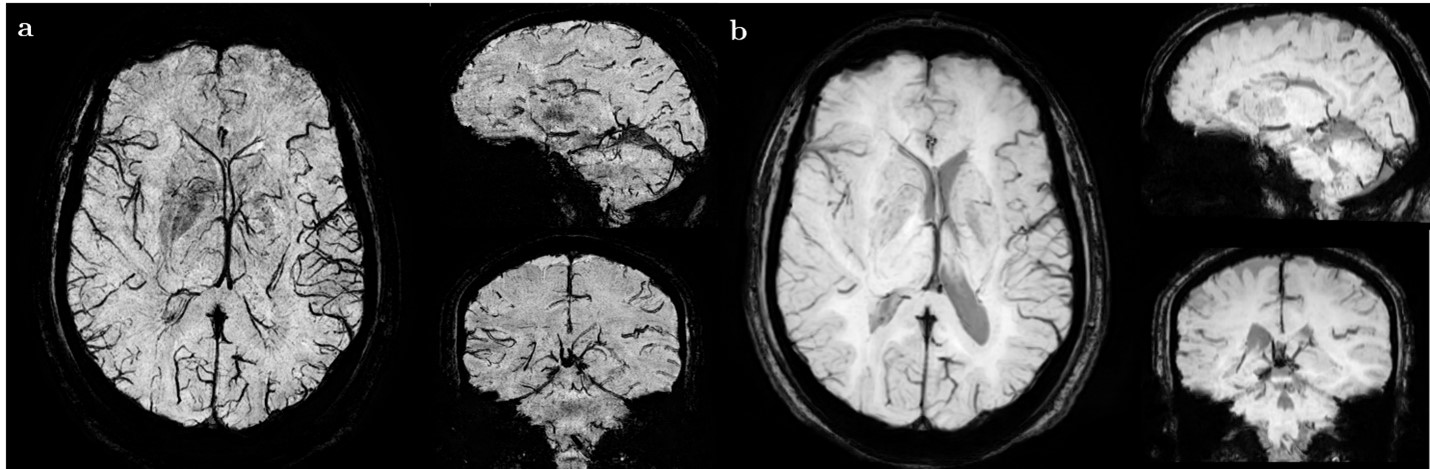
Gliomas represent a heterogeneous group of primary brain tumors presenting diverse histopathological and molecular characteristics, associated with significant mortality and morbidity. Due to their heterogeneous nature, accurate glioma grading is necessary for treatment planning and monitoring disease progression. HGGs (high grade gliomas) in comparison to LGGs (low grade gliomas) present a higher degree of angiogenesis, severe necrosis, and micro-hemorrhages. Angiogenesis plays an important role in the development and progression of tumors. The degree of angiogenesis in tumors can be an important parameter in determining the tumor progression. Several studies have been conducted that have tried to grade gliomas by indirect, non-invasive quantification of the degree of angiogenesis. These studies had the downside of either being semi-quantitative1 or excluding cases that did not have visible ITSS2 (Intratumoral susceptibility signals).In this study, we developed a fully automatic approach for IVV (ITSS vasculature volume) segmentation and quantification for glioma grading using SWI-EPI imaging sequence. SWI-EPI employs the echo-planar based acquisition for obtaining the SWI images, whereas the conventional SWI images are acquired using a gradient echo-based sequence. In our experiments, it was obsereved that the image resolution of SWI-EPI was higher than that of the SWI images (Figure 1), with the added advantage of faster acquisition time.
Methods
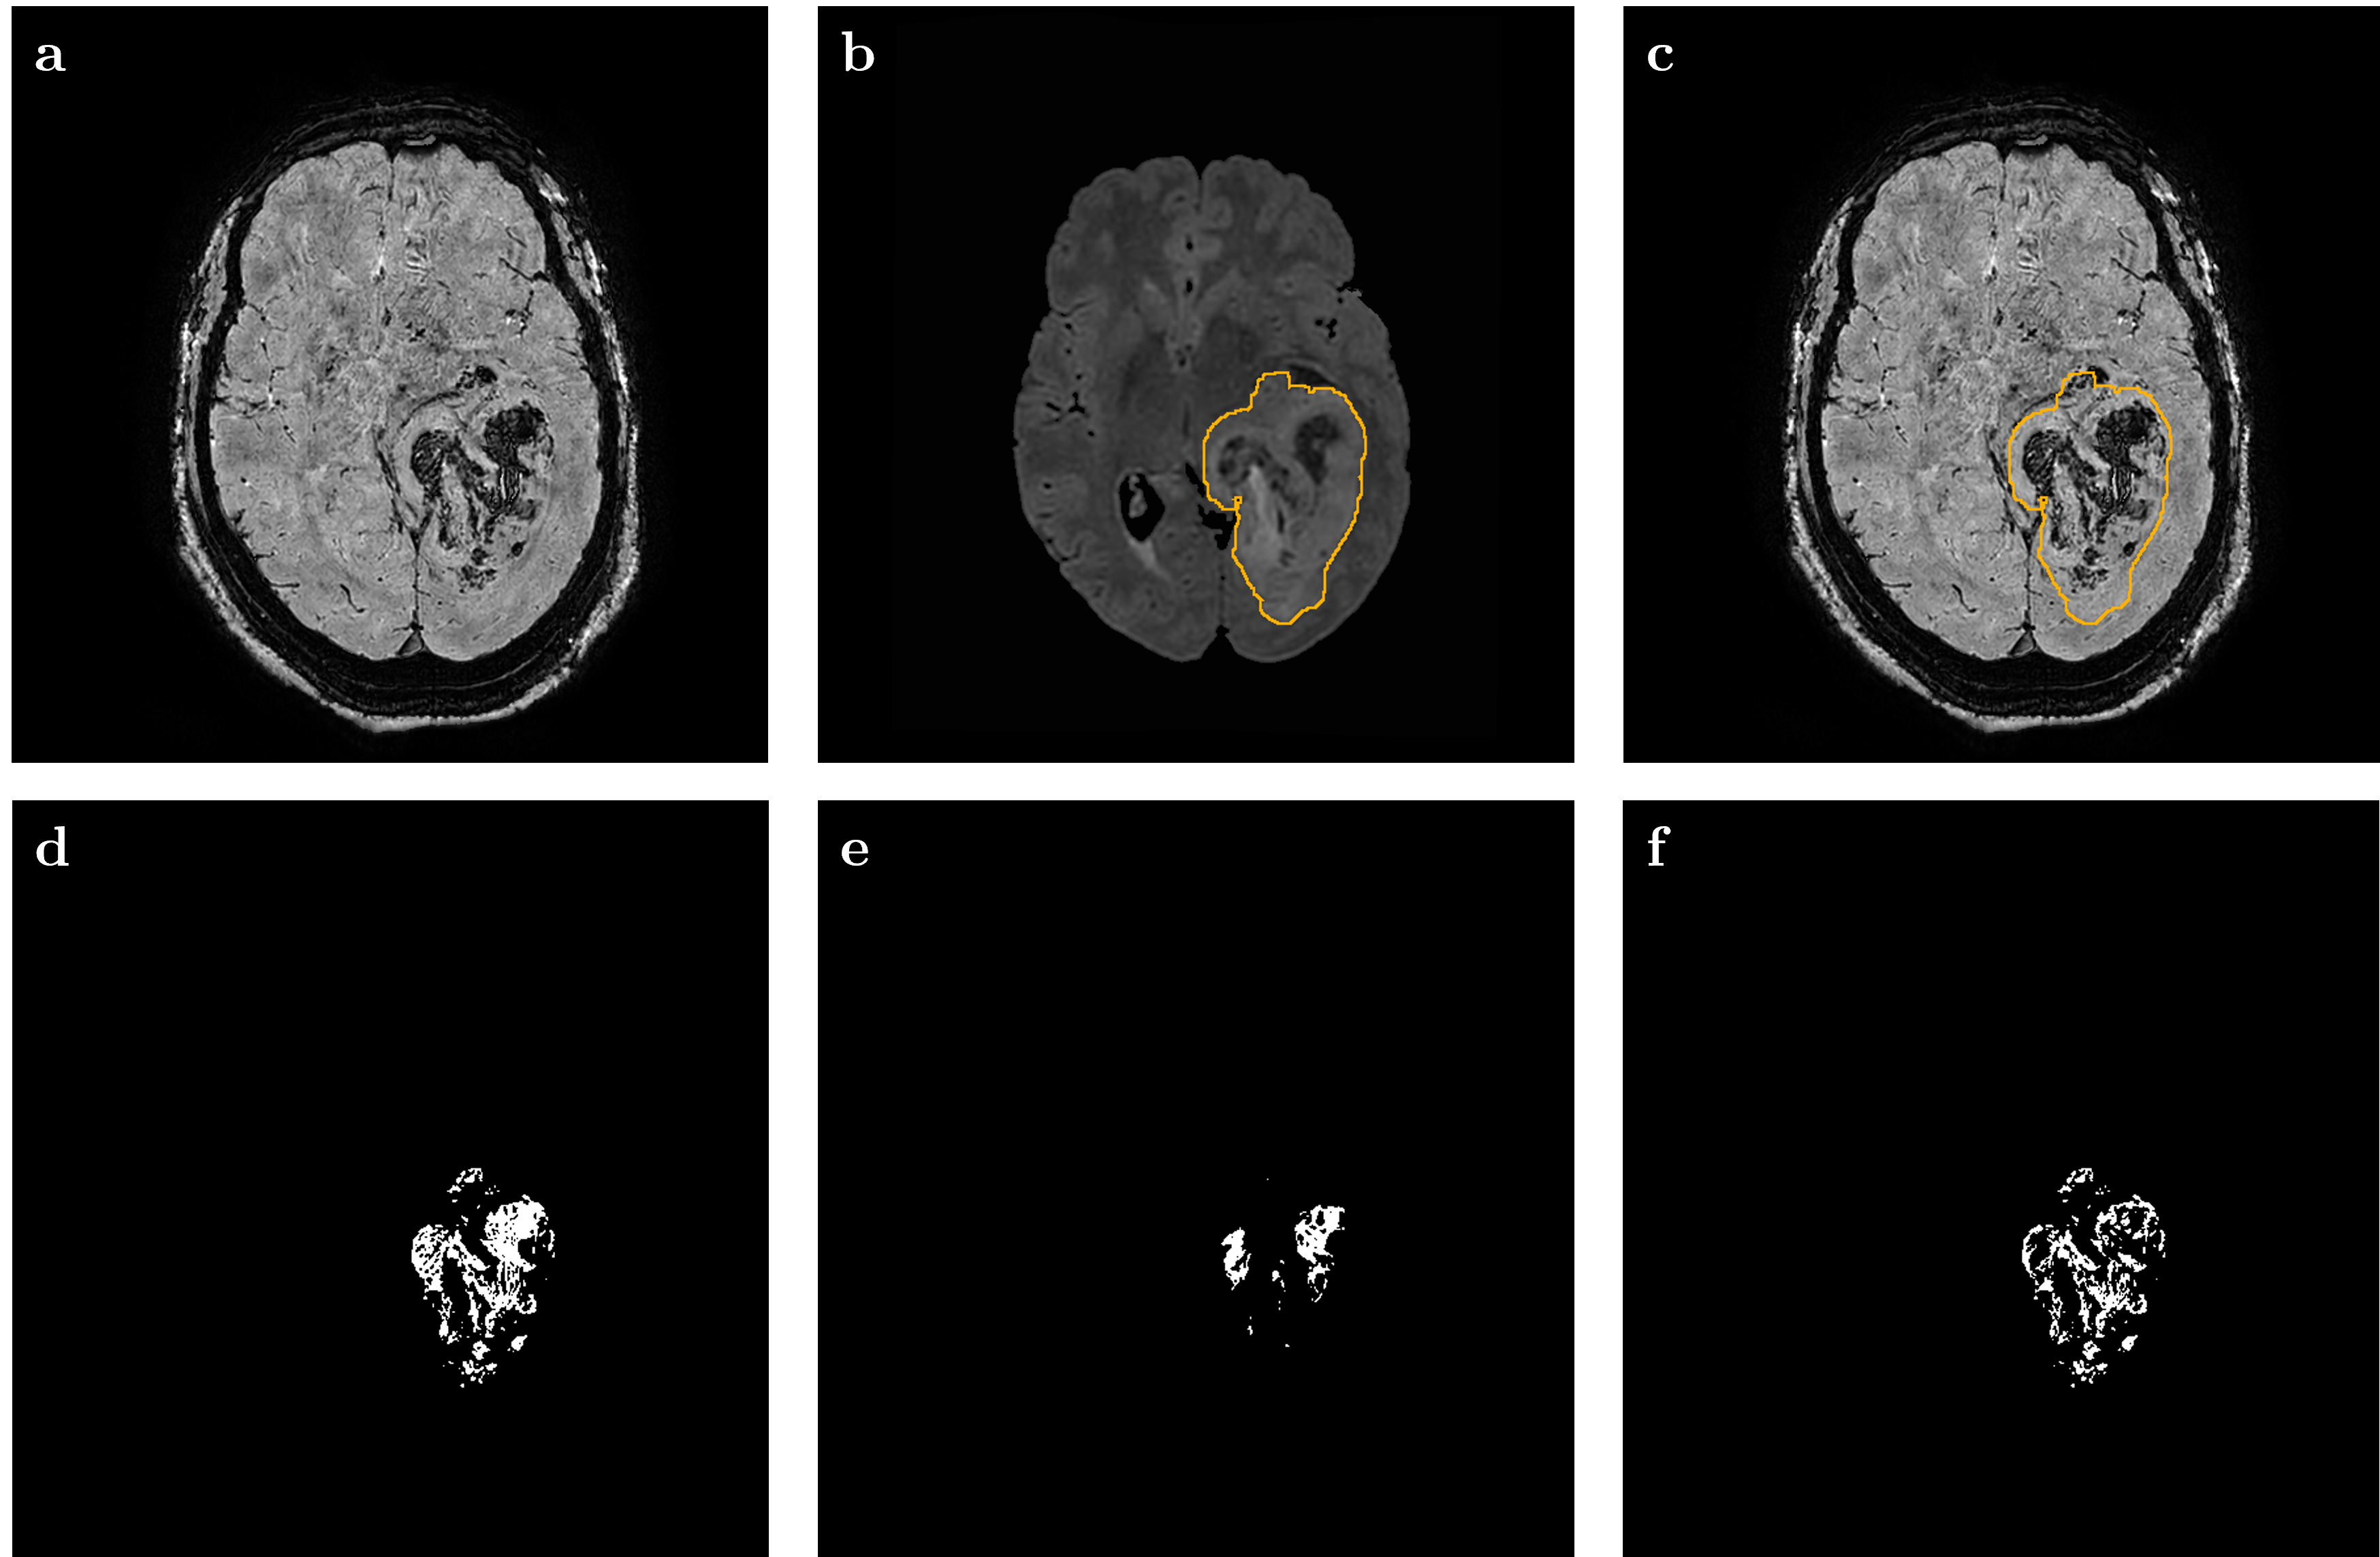
A total of 68 glioma patients (15 LGG, 49 HGG) were considered for this study. Routine imaging sequences like T1-weighted, T2-weighted, 3D FLAIR, and post-contrast T1-weighted were acquired along with SWI-EPI and SWI sequences. FLAIR and SWI images were co-registered with SWI-EPI images. The whole tumor (WT) region was segmented from the FLAIR images by using an in-house developed tumor segmentation model3. The tumor masks were applied to the SWI-EPI and the SWI images and the ITSS was segmented using Otsu thresholding. R2* relaxation maps computed from multi-echo SWI images were used to obtain the tumor micro-hemorrhage masks by using an appropriate threshold value. This threshold value was chosen based on R2* maps of 4 non-glioma patients who presented chronic hemorrhage. These hemorrhage masks were then subtracted from the ITSS masks to obtain just the tumor vasculature, termed IVV (ITSS vasculature volume). Figure 2 shows the images obtained by the above-mentioned steps.A new grading feature nIVV-TVR (normalized IVV-Tumor volume ratio), obtained by dividing IVV with the WT volume, followed by appropriate normalization was also proposed.
Results
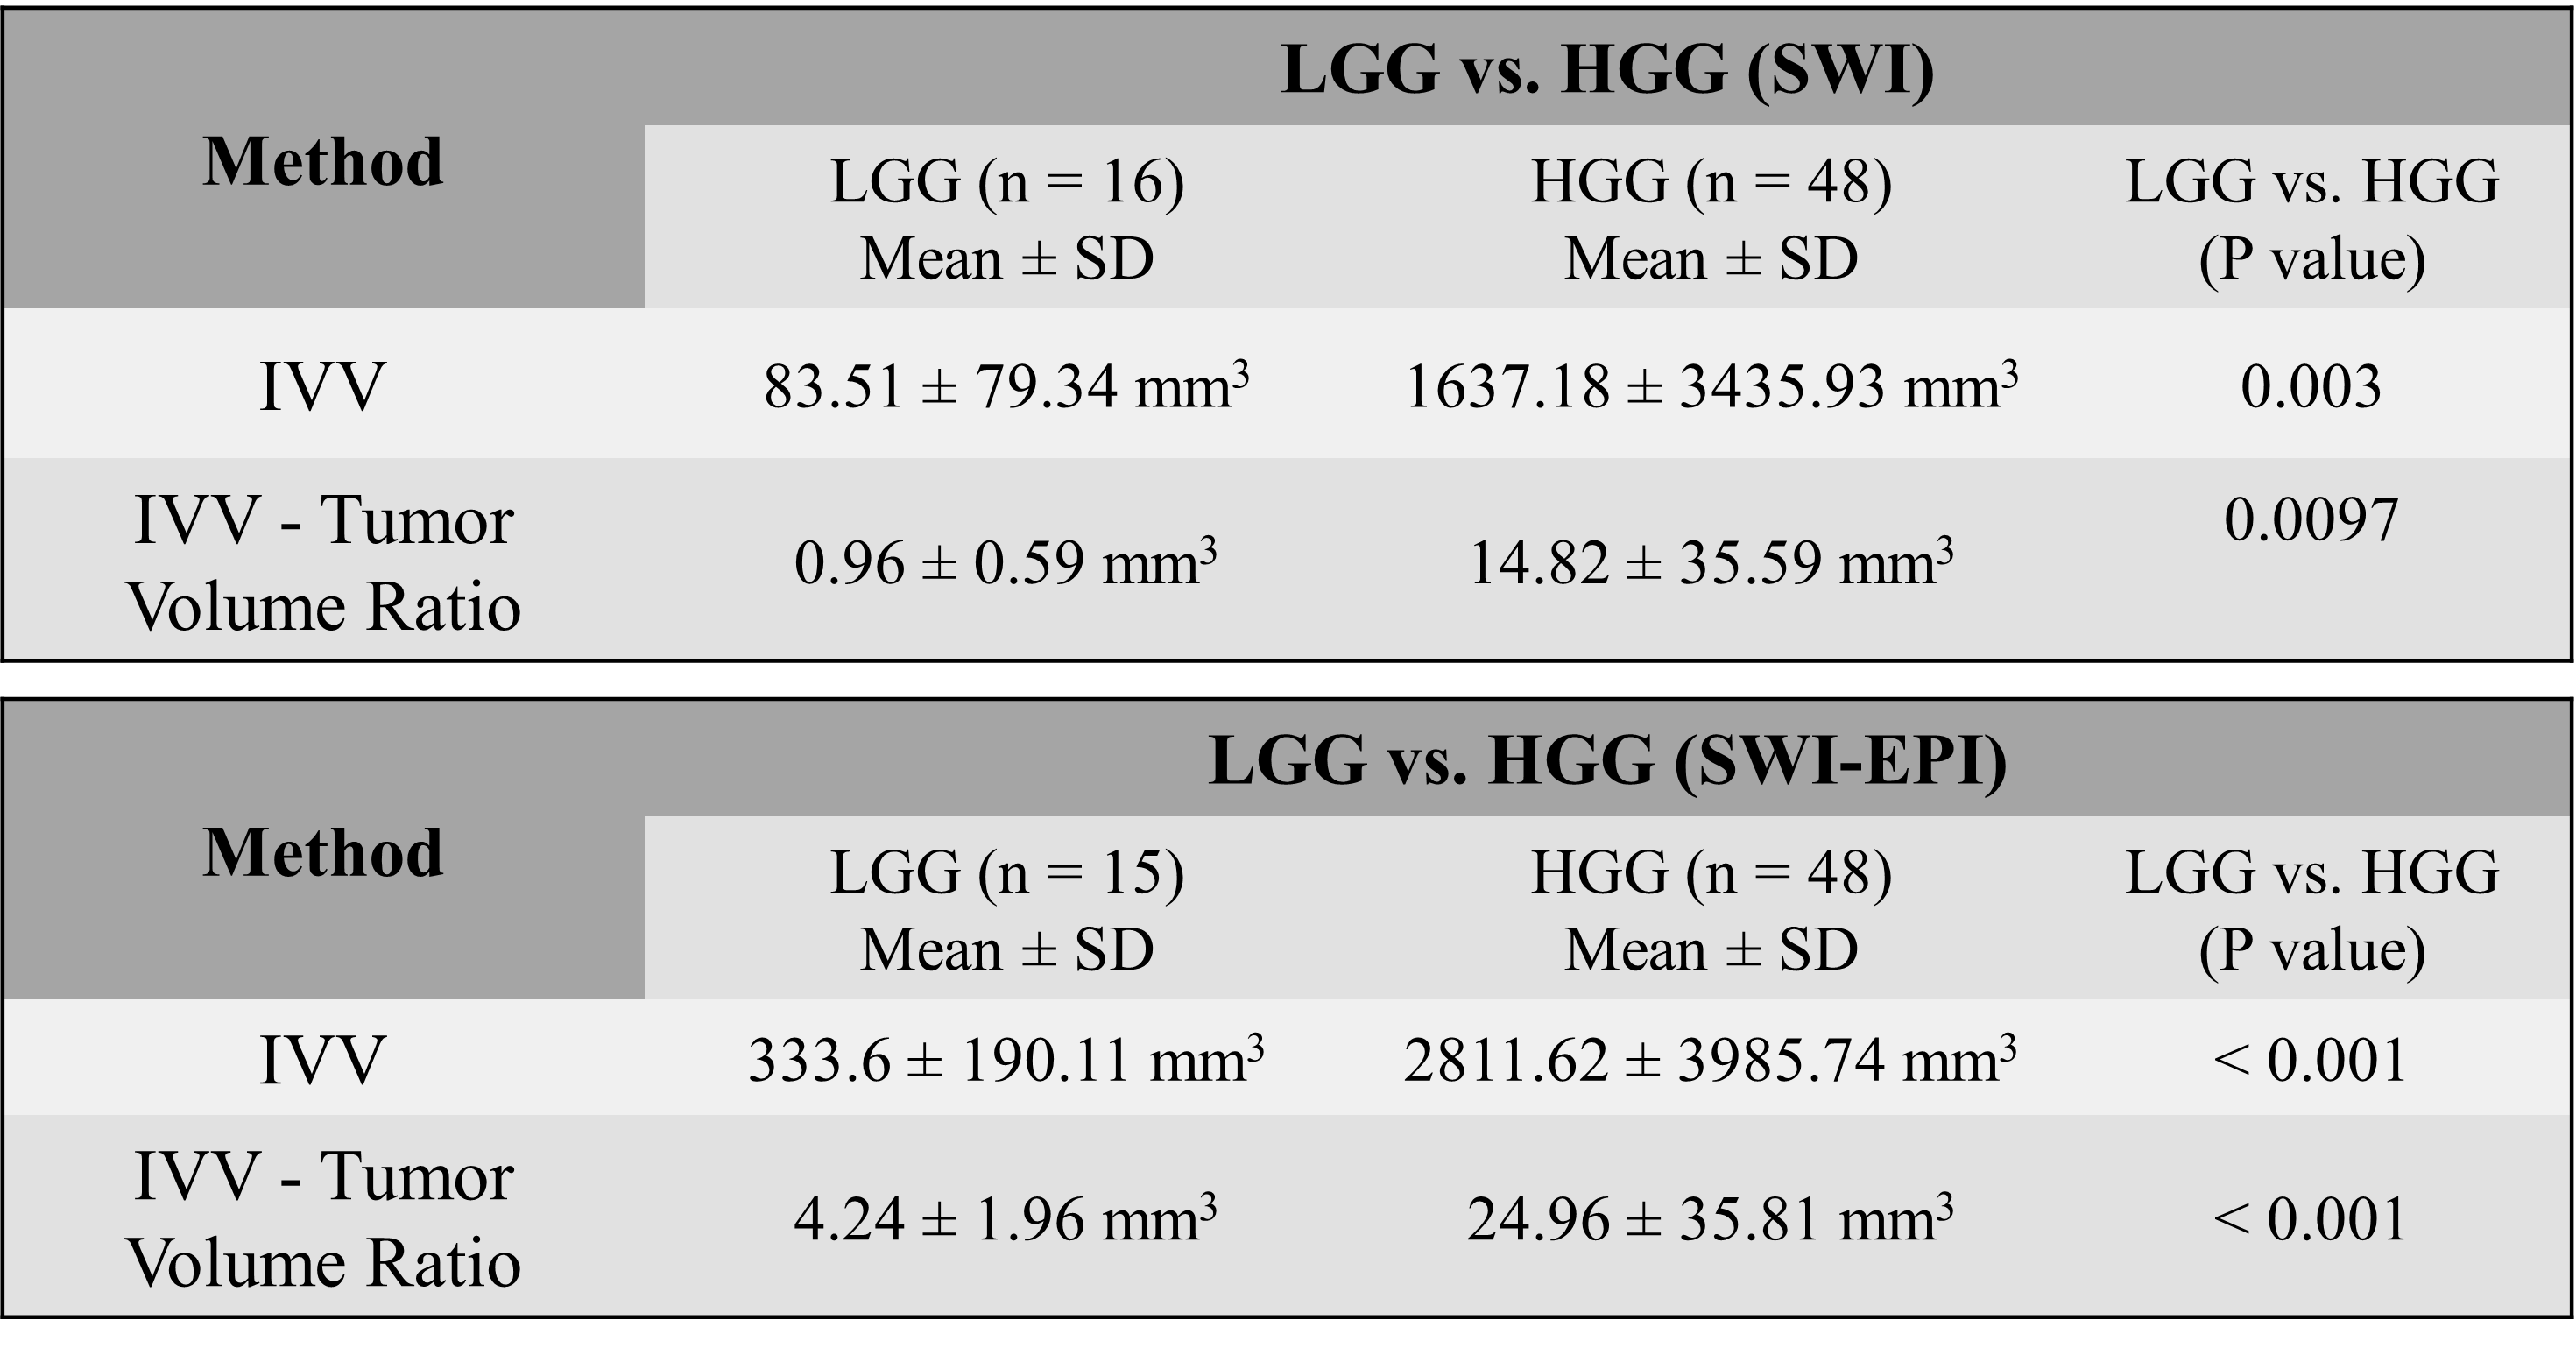
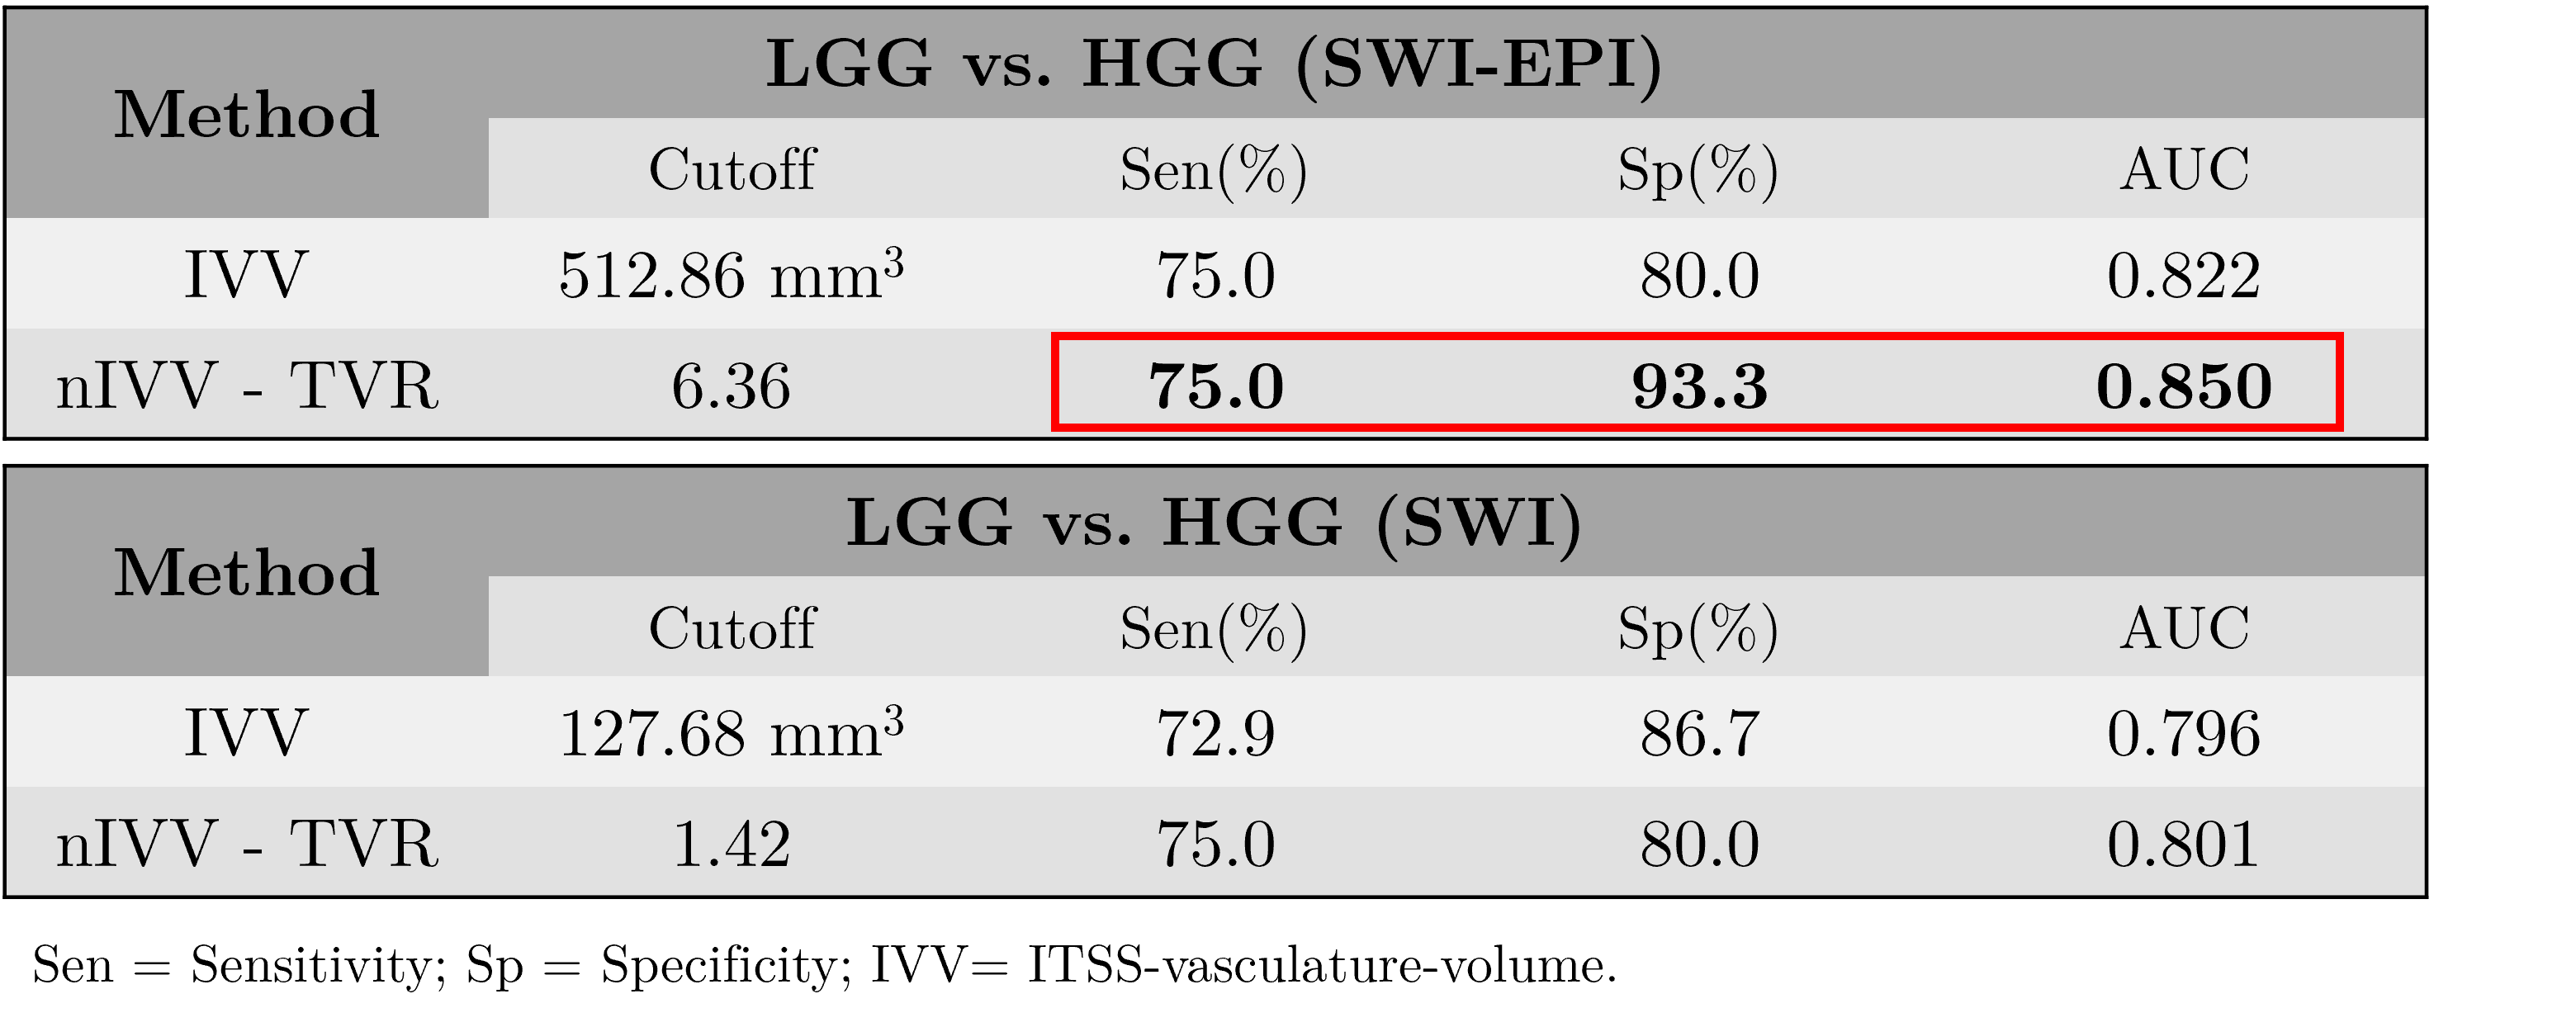
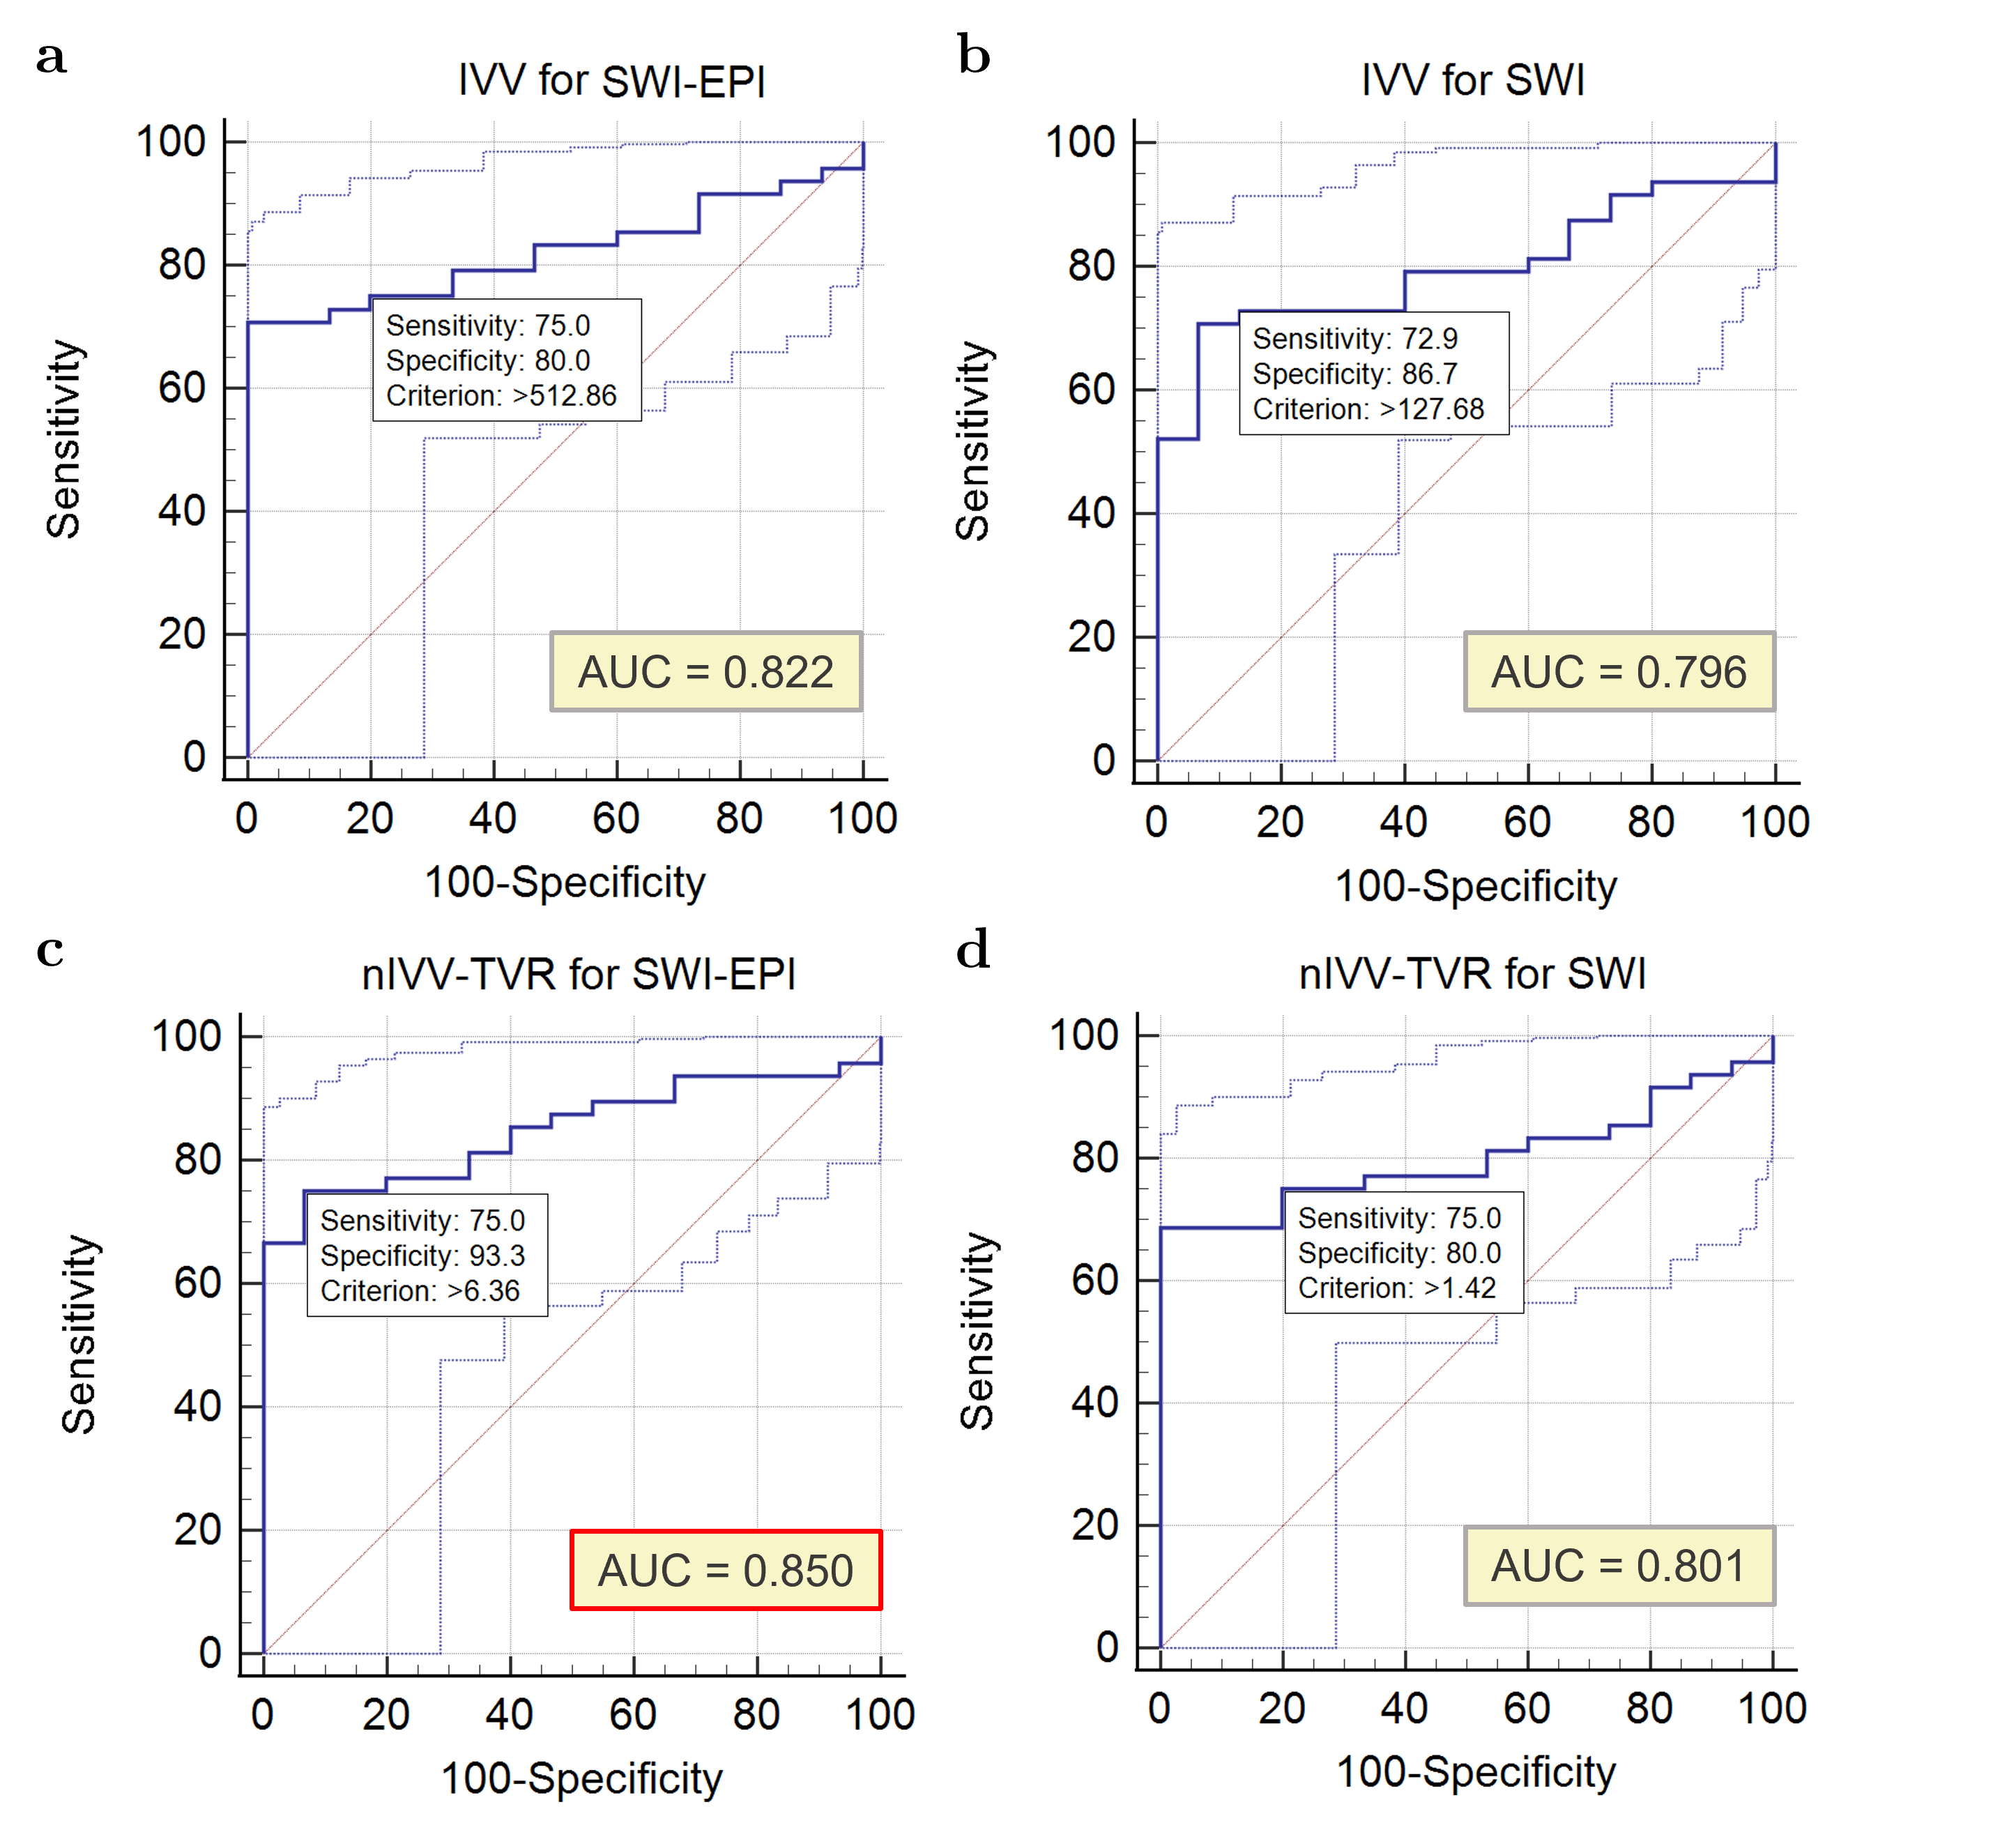
The mean, standard deviation along with the range of IVV and nIVV-TVR for LGG and HGG for both SWI and SWI-EPI were separately calculated and are summarized in Table 1. IVV values were significantly higher for HGGs as compared to LGGs. This was seen both for the SWI-EPI and the SWI images. The same trend was observed in the case of nIVV-TVR. It was also observed that IVV and nIVV-TVR values were higher when using the SWI-EPI images for the same subject. The proposed nIVV-TVR values using SWI-EPI images showed a higher significance level (P < 0.001) than the values obtained using SWI images (P = 0.0097).ROC curve analysis - An AUC (Area under the curve) of 0.822 as compared to 0.796 was obtained when comparing the grading accuracy of IVV for SWI-EPI and SWI, respectively. Comparing the AUCs of SWI-EPI (0.850) and SWI (0.801), it was seen that there was an improvement in the diagnostic accuracy using SWI-EPI images with nIVV-TVR as the differentiating metric. Table 2 reports the sensitivity and specificity values for differentiating between the tumor grades for the SWI-EPI and the SWI images. Figure 3 shows the ROC AUC curve analysis for differentiating between the tumor grades using IVV and the proposed nIVV-TVR.
Discussion
This study was aimed at evaluating the potential of SWI-EPI towards grading gliomas into LGG and HGG and compared it with GRE-based SWI. In general, SWI-EPI provides better contrast for visualizing the brain vasculature.Conclusion
In this study, a fully automatic approach for tumor vasculature segmentation and qunatification using SWI-EPI for glioma grading was developed. It was found that SWI-EPI has potential advantages over SWI and can provide better diagnostic capabilities for tumor grading.Acknowledgements
I acknowledge fundings from SERB-DST (Project no. CRG/2019/005032) and the PMRF fellowship for supporting this project. I also thank Rakesh Kumar Singh from Fortis Memorial Research Institute for his help in data collection.References
1. Park MJ, Kim HS, Jahng GH, Ryu CW, Park SM, Kim SY. Semiquantitative assessment of intratumoral susceptibility signals using non-contrast-enhanced high-field high-resolution susceptibility-weighted imaging in patients with gliomas: comparison with MR perfusion imaging. Am J Neuroradiol. 2009;30(7):1402-1408.
2. Bhattacharjee R, Gupta RK, Patir R, Vaishya S, Ahlawat S, Singh A. Quantitative vs. semiquantitative assessment of intratumoral susceptibility signals in patients with different grades of glioma. J Magn Reson Imaging. 2020;51(1):225-233.
3. Maurya S, Kumar Yadav V, Agarwal S, Singh A. Brain Tumor Segmentation in mpMRI Scans (BraTS-2021) Using Models Based on U-Net Architecture. In: International MICCAI Brainlesion Workshop. Springer; 2021:312-323.
Figures