3855
Multiparametric Simultaneous Hybrid 18F-FDG PET/MRI Incorporating Intratumoral and Peritumoral Regions for Grading of Glioma1Department of Medical Imaging,, Guangdong Second Provincial General Hospital, Guangzhou, China, 2Guangzhou Universal Medical Imaging Diagnostic Center, Guangzhou, China
Synopsis
Keywords: Tumors (Pre-Treatment), Brain, Glioma, PET/MRI
Motivation: The biological behavior and prognosis between low- and high-grade gliomas (HGG) are different, it is important to preoperatively judge the grading in clinical practice.
Goal(s): Multiple parameters derived from hybrid 18F-FDG PET/MRI of the solid component and peritumoral zone (PTZ) can potentially improve the accuracy of glioma grading.
Approach: We employed multiparametric simultaneous hybrid 18F-FDG PET/MRI including PET, ASL, and DWI from the solid component and PTZ of glioma to differentiate HGG from LGG.
Results: The combination of multiple parameters from hybrid PET/MRI in tumor and PBZ can provide better diagnostic efficacy than a single parameter alone.
Impact: Incorporating multiple tumoral regions into multiparameter from simultaneous 18F-FDG PET/MRI can optimize the workflow efficiency for glioma grading, and aid treatment decision-making to offer appropriate, patient-tailored precision medicine, and reduce the risk of unnecessary or inappropriate treatments.
Introduction
Optimized management of glioma, the most common primary brain tumor, remains a major global concern(1). Patient survival varies greatly depending on tumor grade, with high-grade glioma (HGG) having a very high mortality rate (e.g., 5-year survival rate <5%). On the other hand, low-grade glioma (LGG) achieves a survival rate as high as 80%(2). Accurate grading of glioma is critical for clinical decision-making in order to maximize prognosis and patient-tailored precision medicine. However, some patients cannot tolerate surgery or biopsy, in addition, the pathological diagnosis from stereotactic biopsy or surgical resection may be inaccurate due to sampling bias(3).DWI-derived apparent diffusion coefficient (ADC) and ASL has been recommended to simultaneously assess the cellular and vascular properties of gliomas, and are viewed as useful biomarkers for grading(4, 5). Multiparametric MRI show greater potential in differentiation of HGGs from LGG than dose a single parameter. Combining PET and MRI can help procure structural, functional, and metabolic information for glioma in a single examination(6-8). reports have shown that tumor cell infiltration can extend several centimeters beyond the tumor margin(9). We hypothesized that multiple parameters derived from simultaneous 18F-FDG PET/MRI of multiple tumoral regions would improve the grading performance.
Methods
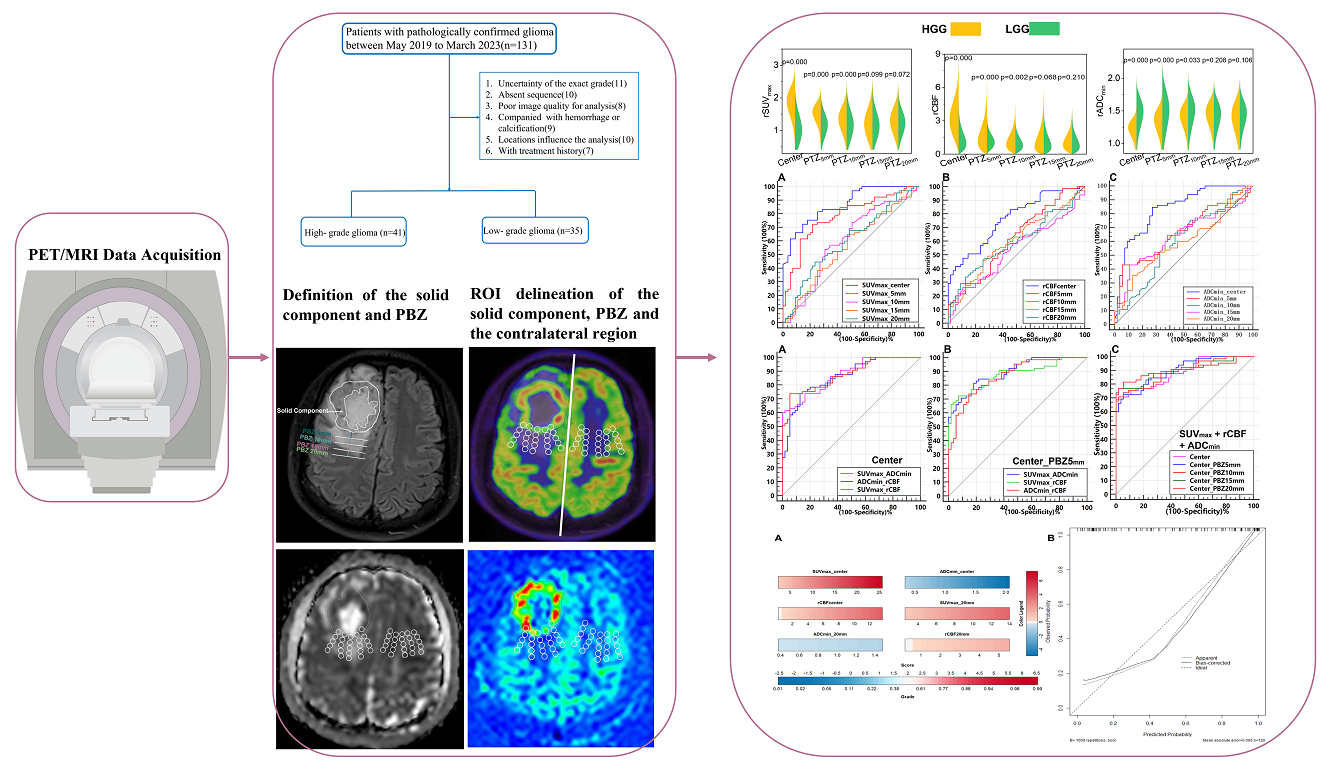
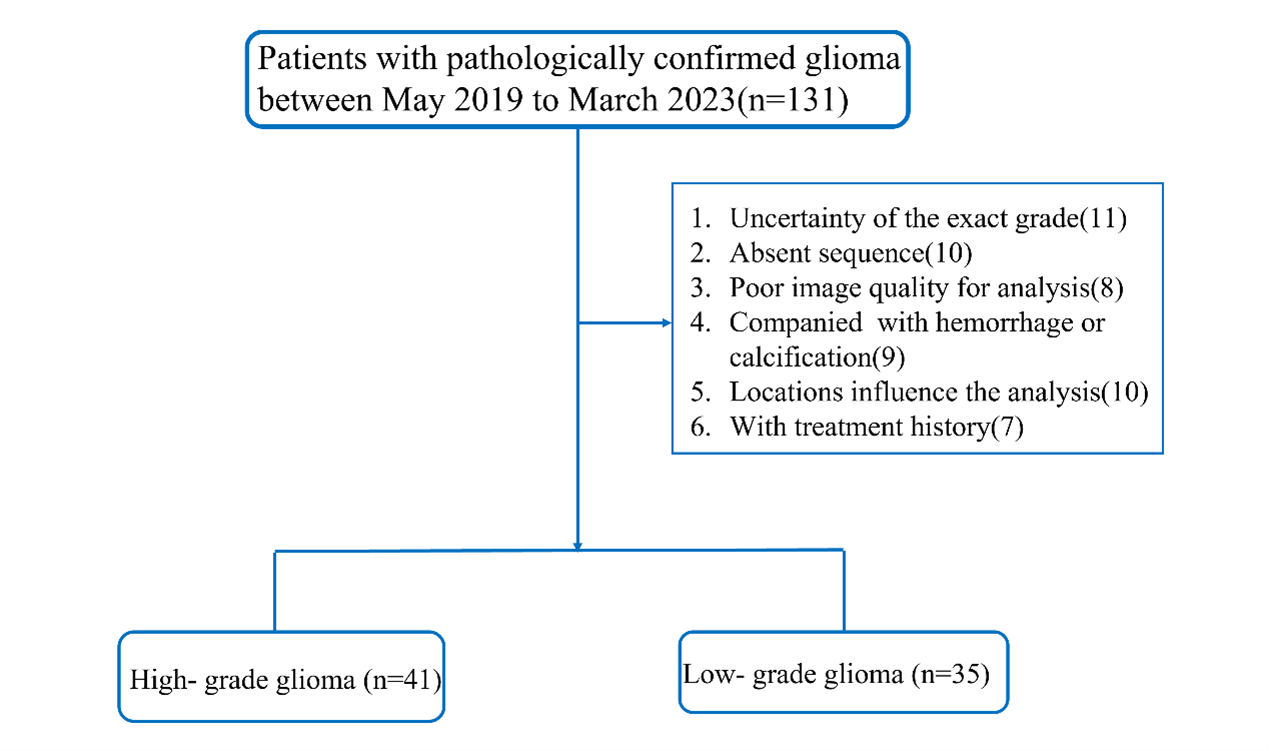
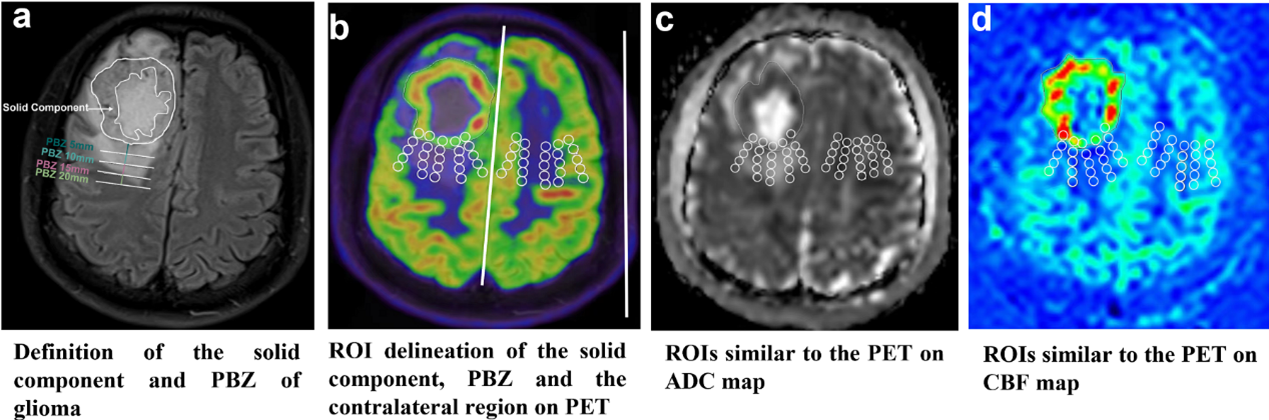
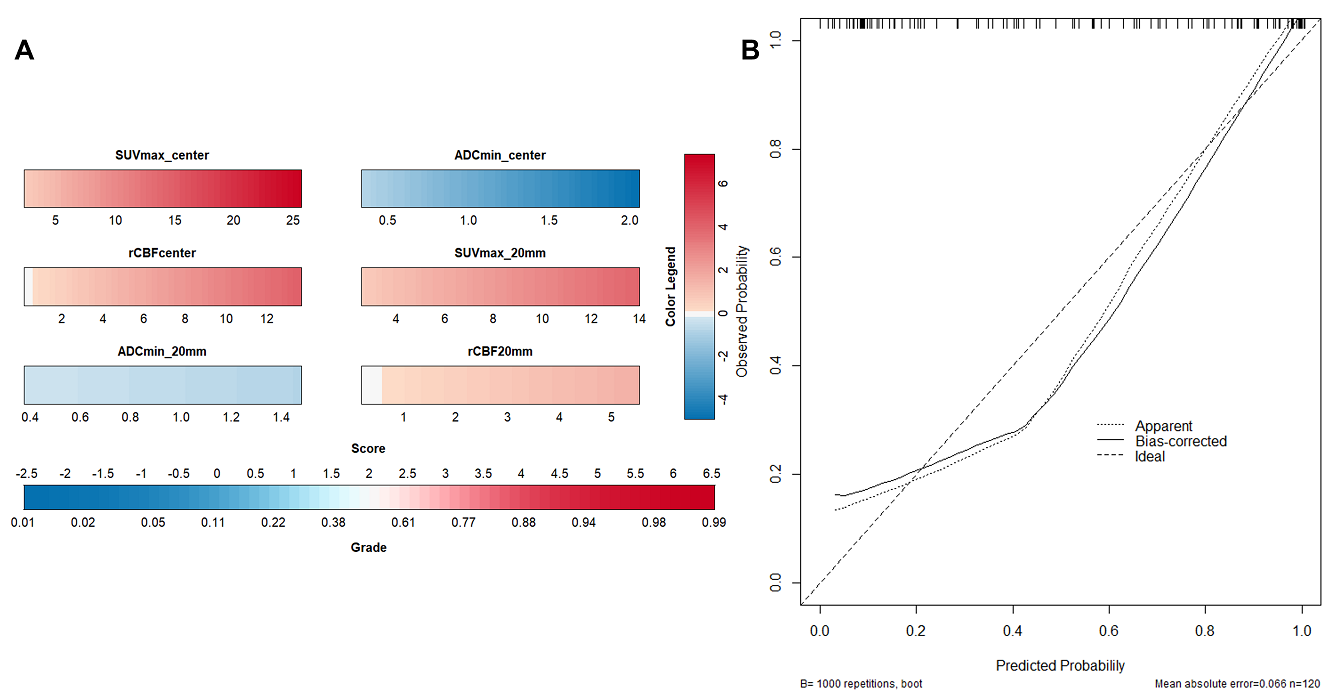
The complete progress for this study was shown in Fig 1. The 18F-FDG PET/MRI examination was approved by the Internal Ethics Committee of the Hospital (No. 003/2019) and conducted in accordance with the Declaration of Helsinki. Patients with histologically confirmed gliomas subjected to brain 18F-FDG PET/MRI between May 2019 and March 2023 were retrospectively enrolled (Fig 2). Normalizing ASL difference images to normal-appearing (contralateral) tissue (mirrored ROI) help to improve accuracy in tumor grading(10, 11). Thus, we used the relative values (the values of ROI divided by the value of the mirrored ROI from the contralateral normal-appearing brain regions) of PET, CBF, and ADC for quantitative assessment. The delineation of the margin was performed by the previous two neuroradiologists, with any disagreements on the location of regions of interest (ROIs) within each lesion, resolved by consensus. The pipeline of the process of the measurements of multiple parameters in our study were shown in Fig 3. Imaging parameters across HGG and LGG groups were compared using the two-sample t-test or the Mann–Whitney U test. Receiver operating characteristic (ROC) curves for the parameters (single or combined) were used to evaluate their efficiency in discriminating HGGs form LGGs. An individualized nomogram prediction model was constructed to predict the probability of HGG. The nomogram performance was evaluated by discrimination and calibration. The discriminative ability of the prediction model was determined by C-index. A visual calibration plot, comparing the predicted and actual probability of HGG, was performed to calibrate the prediction model. The nomogram was subjected to 1000 bootstrap resamples for internal validation to assess predictive accuracy(12).Results
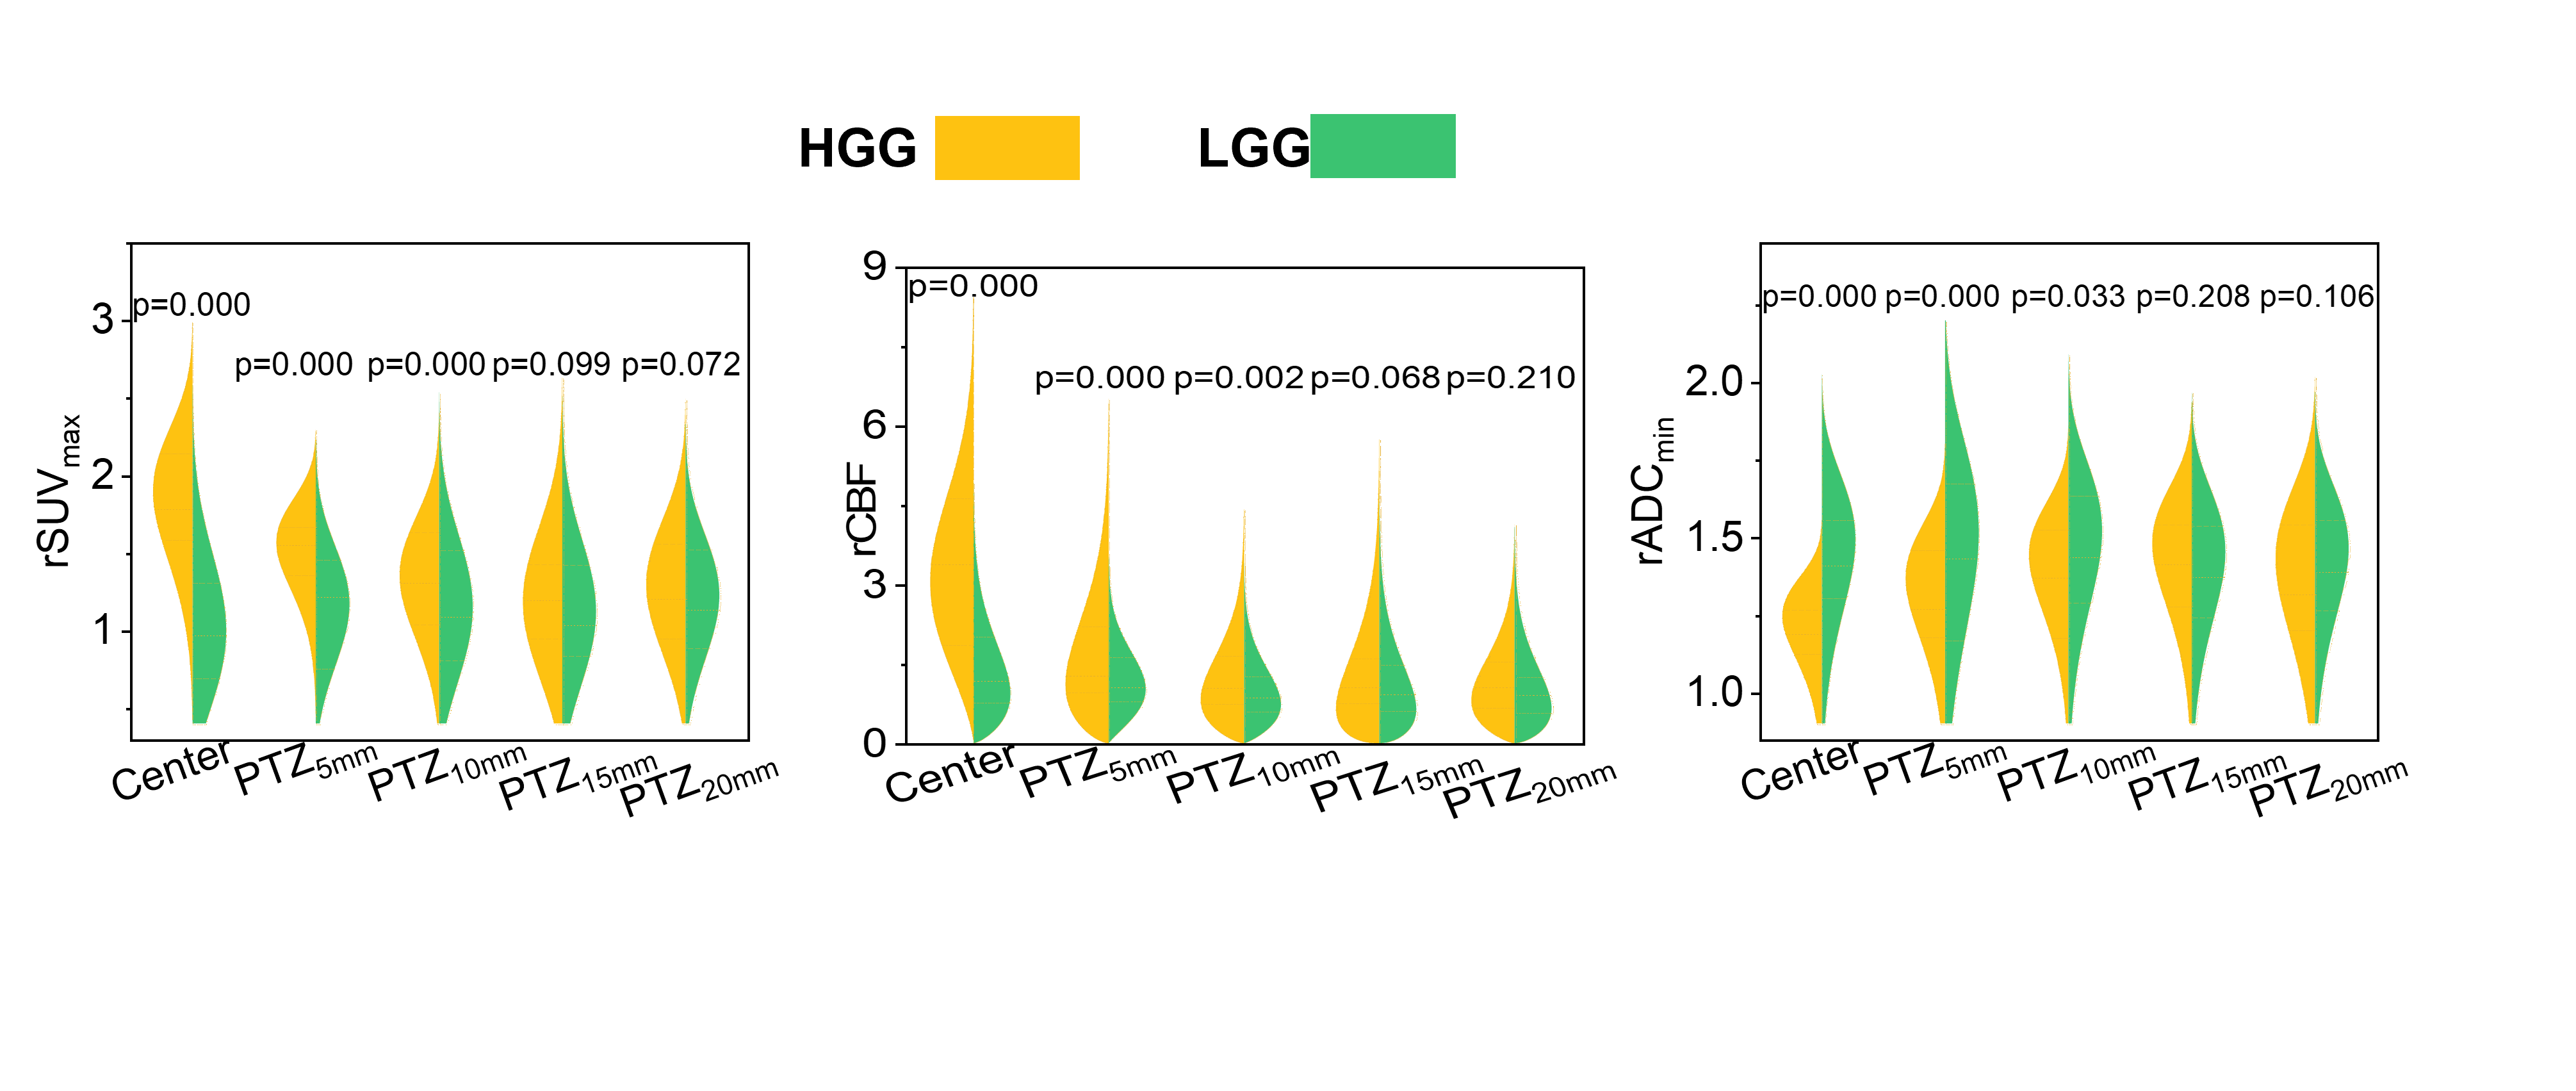
HGGs displayed higher rSUVmax and rCBF but lower rADCmin in the solid component and 5mm-adjacent PTZ, lower rADCmin in the 10-mm-adjacent PBZ, and higher rCBF in the 15- and 20-mm-adjacent PTZ (Fig 4). rSUVmax in the solid component performed best [area under the curve (AUC) = 0.865] as a single parameter for grading. Combination of rSUVmax in the solid component and adjacent 20mm performed better (AUC = 0.881). Integration of all three indicators in the solid component and adjacent 20mm performed the best (AUC = 0.928). The nomogram including rSUVmax, rCBF, and rADCmin in the solid component and 20-mm-adjacent PTZ predicted HGG with a C-index of 0.906(Fig 5).Discussion
Recent studies found that glioma cells can infiltrate the apparently normal region covering 20 mm around the tumor border as visualized on conventional enhanced MRI. We proposed multiple parametric markers from the solid component of the tumor and peritumoral regions, incorporating diffusion, perfusion, and metabolic information from hybrid 18F-FDG PET/MRI, to grade glioma. Moreover, in order to enhance the reliability and validity of results, we used the relative or normalized values yielded from the contralateral normal tissue mirrored to tumor for grading.In current study, HGGs showed higher rSUVmax than did LGGs at any measured point in PBZ; this may reflect the high glucose avidity in malignant brain tumors, as suggested in previous reports(8, 13, 14). Of note, the HGG and LGG groups differed in the solid component and the 5-mm-adjacent PBZ, suggesting that the greatest metabolic discrepancy between glioma exists mainly in and close to the solid component, where tumor cells proliferate much more actively.
Conclusion
Combination of rSUVmax, rCBF, and rADCmin derived from hybrid PET/MRI of the solid component and PBZ facilitated more accurate discrimination of LGGs from HGGs than did a single parameter alone.Acknowledgements
We thank for the National Natural Science Foundation of China (No. 82271948, 82102004), Science and Technology Planning Project of Guangzhou (2023A03J0276), the Key Laboratory Construction Project of the Guangzhou Science and Technology (202201020373), and the National Key Research and Development Project of China (2022YFC2400049).References
1. He Y, Cai Y, Liu J, et al. Systematic Analysis of a Pyroptosis-Related Signature to Predict the Prognosis and Immune Microenvironment of Lower-Grade Glioma. Cells. 2022; 11(24). 2. Ostrom QT, Cioffi G, Gittleman H, et al. CBTRUS Statistical Report: Primary Brain and Other Central Nervous System Tumors Diagnosed in the United States in 2012-2016. Neuro Oncol. 2019; 21(Suppl 5):v1-v100. 3. Du N, Shu W, Li K, et al. An initial study on the predictive value using multiple MRI characteristics for Ki-67 labeling index in glioma. (1479-5876 (Electronic)). 4. Alkanhal H, Das K, Poptani H. Diffusion- and Perfusion-Weighted Magnetic Resonance Imaging Methods in Nonenhancing Gliomas. World Neurosurg. 2020; 141:123-30. 5. Hashido T, Saito S, Ishida T. Radiomics-Based Machine Learning Classification for Glioma Grading Using Diffusion- and Perfusion-Weighted Magnetic Resonance Imaging. J Comput Assist Tomogr. 2021; 45(4):606-13. 6. Almansory KO, Fraioli F. Combined PET/MRI in brain glioma imaging. Br J Hosp Med (Lond). 2019; 80(7):380-6. 7. Overcast WB, Davis KM, Ho CY, et al. Advanced imaging techniques for neuro-oncologic tumor diagnosis, with an emphasis on PET-MRI imaging of malignant brain tumors. Curr Oncol Rep. 2021; 23(3):34. 8. Quartuccio N, Laudicella R, Vento A, et al. The Additional Value of (18)F-FDG PET and MRI in Patients with Glioma: A Review of the Literature from 2015 to 2020. Diagnostics (Basel). 2020; 10(6). 9. Lemée JM, Clavreul A, Aubry M, et al. Characterizing the peritumoral brain zone in glioblastoma: a multidisciplinary analysis. J Neurooncol. 2015; 122(1):53-61. 10. Alsaedi A, Doniselli F, Jäger HR, et al. The value of arterial spin labelling in adults glioma grading: systematic review and meta-analysis. Oncotarget. 2019; 10(16):1589-601. 11. Warmuth C, Gunther M, Zimmer C. Quantification of blood flow in brain tumors: comparison of arterial spin labeling and dynamic susceptibility-weighted contrast-enhanced MR imaging. Radiology. 2003; 228(2):523-32. 12. Jin C, Cao J, Cai Y, et al. A nomogram for predicting the risk of invasive pulmonary adenocarcinoma for patients with solitary peripheral subsolid nodules. (1097-685X (Electronic)). 13. Song PJ, Lu QY, Li MY, Li X, Shen F. Comparison of effects of 18F-FDG PET-CT and MRI in identifying and grading gliomas. J Biol Regul Homeost Agents. 2016; 30(3):833-8. 14. Albert NL, Weller M, Suchorska B, et al. Response Assessment in Neuro-Oncology working group and European Association for Neuro-Oncology recommendations for the clinical use of PET imaging in gliomas. Neuro Oncol. 2016; 18(9):1199-208.Figures