3853
Vasari-based features nomogram to predict the tumor-infiltrating CD8+ T cell levels in glioblastoma1Lanzhou University Second Hospital, Lanzhou, China
Synopsis
Keywords: Tumors (Pre-Treatment), Tumor, glioblastoma; magnetic resonance imaging; apparent diffusion coefficient; CD8+ T cells
Motivation: Tumor-infiltrating CD8+ T cells play a key role in glioblastoma development, malignant progression, and recurrence.
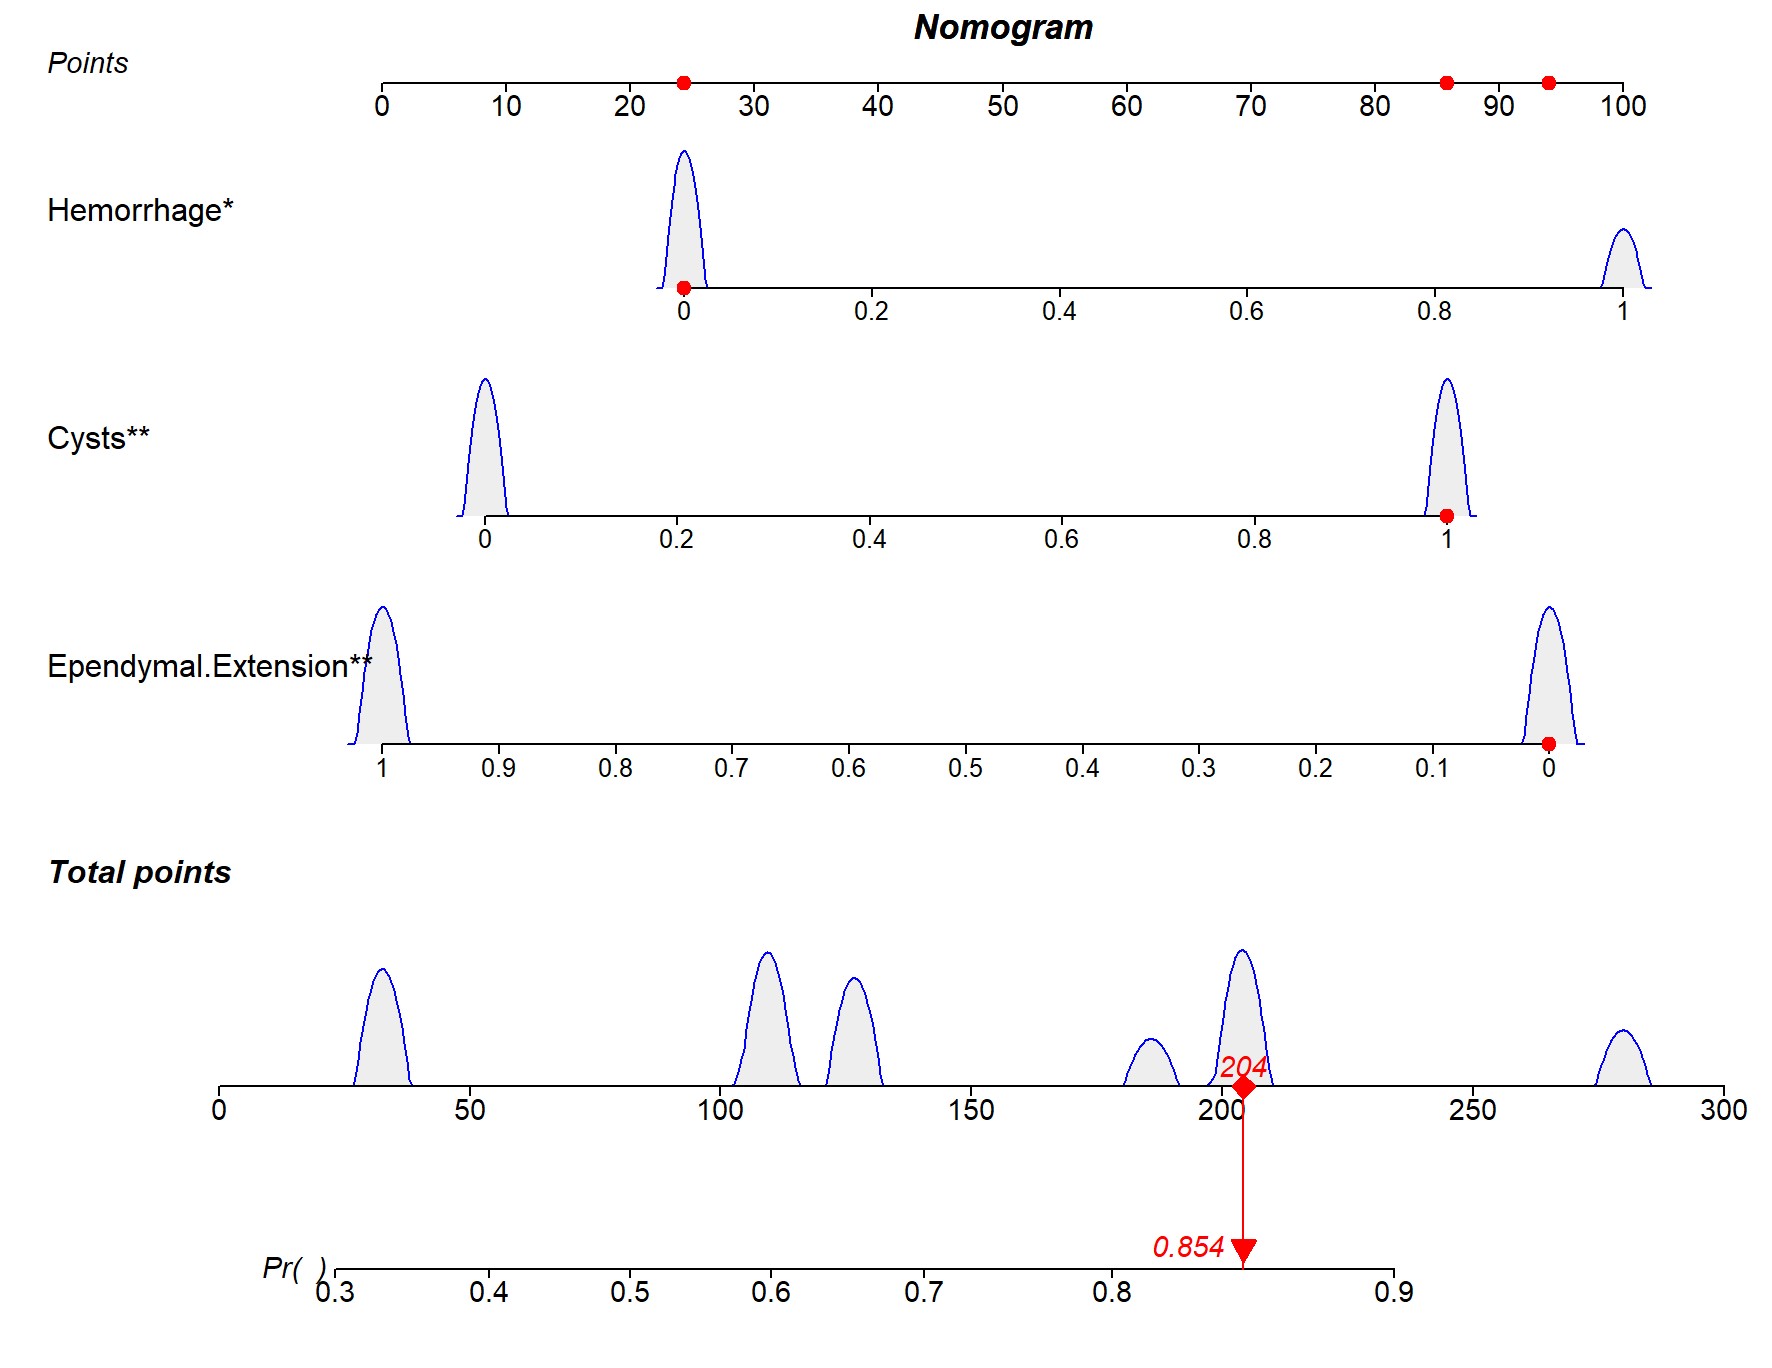
Goal(s): The aim of the study was to establish nomograms based on the VASARI features of multiparametric MRI to determine the expression levels of CD8+ T cells in patients with glioblastoma.
Approach: 140 patients with glioblastoma confirmed by surgery and pathology were retrospectively analyzed. Patients were divided into high and low CD8 expression groups. The MRI images of patients with glioblastoma were analyzed using the VASARI scoring system.
Results: The features with the greatest predictive power for CD8 expression levels were, cystic, hemorrhage, and ependymal extension.
Impact: The VASARI feature-based nomogram model can shows promise to predict the level of infiltrative CD8 expression in GB tumors noninvasively for earlier tissue diagnosis and more aggressive treatment.
Abstract
Abstract Background: Tumor-infiltrating CD8+ T cells play a key role in glioblastoma development, malignant progression, and recurrence. The aim of the study was to establish nomograms based on the Visually AcceSAble Rembrandt Images (VASARI) features of multiparametric magnetic resonance imaging (MRI) to determine the expression levels of tumor-infiltrating CD8+ T cells in patients with glioblastoma. Materials and methods: Pathological and imaging data of 140 patients with glioblastoma confirmed by surgery and pathology were retrospectively analyzed. The levels of tumor-infiltrating CD8+ T cells in tumor tissue samples obtained from patients were quantified using immunohistochemical staining. Patients were divided into high and low CD8 expression groups. The MRI images of patients with glioblastoma were analyzed by two radiologists using the VASARI scoring system. Results: A total of 25 MRI-based VASARI imaging features were evaluated by two neuroradiologists. The features with the greatest predictive power for CD8 expression levels were, cystic (OR, 3.063; 95% CI: 1.387, 6.766; P = 0.006), hemorrhage (OR, 2.980; 95% CI: 1.172, 7.575; P = 0.022), and ependymal extension (OR, 0.257; 95% CI: 0.114 0.581; P = 0.001). A logistic regression model based on these three features showed better sample predictive performance (AUC = 0.745; 95% CI: 0.665, 0.825; Sensitivity = 0.527; Specificity = 0.857). Conclusions: The VASARI feature-based nomogram model can shows promise to predict the level of infiltrative CD8 expression in GB tumors noninvasively for earlier tissue diagnosis and more aggressive treatment.Acknowledgements
Not applicable.References
[1] Wang X, Ye J, Gao M, Zhang D, Jiang H, Zhang H, et al. Nifuroxazide inhibits the growth of glioblastoma and promotes the infiltration of CD8 T cells to enhance antitumour immunity. Int Immunopharmacol 2023;118:109987. [2] Nabors LB, Portnow J, Ahluwalia M, Baehring J, Brem H, Brem S, et al. Central Nervous System Cancers, Version 3.2020, NCCN Clinical Practice Guidelines in Oncology. J Natl Compr Canc Netw 2020;18(11):1537-70. [3] Tan AC, Ashley DM, Lopez GY, Malinzak M, Friedman HS, Khasraw M. Management of glioblastoma: State of the art and future directions. CA Cancer J Clin 2020;70(4):299-312. [4] Pellat A, Barat M. Tumor microenvironment: A new application for radiomics. Diagnostic and interventional imaging 2023;104(3):93-4. [5] Ireland L, Santos A, Ahmed MS, Rainer C, Nielsen SR, Quaranta V, et al. Chemoresistance in Pancreatic Cancer Is Driven by Stroma-Derived Insulin-Like Growth Factors. Cancer Res 2016;76(23):6851-63. [6] Ugel S, Cane S, De Sanctis F, Bronte V. Monocytes in the Tumor Microenvironment. Annu Rev Pathol 2021;16:93-122. [7] Chen DS, Mellman I. Elements of cancer immunity and the cancer-immune set point. Nature 2017;541(7637):321-30. [8] Xue C, Zhou Q, Zhang P, Zhang B, Sun Q, Li S, et al. MRI histogram analysis of tumor-infiltrating CD8+ T cell levels in patients with glioblastoma. Neuroimage Clin 2023;37:103353. [9] La Manna MP, Di Liberto D, Lo Pizzo M, Mohammadnezhad L, Shekarkar Azgomi M, Salamone V, et al. The Abundance of Tumor-Infiltrating CD8(+) Tissue Resident Memory T Lymphocytes Correlates with Patient Survival in Glioblastoma. Biomedicines 2022;10(10).Figures