3852
Comparison of Tracer Kinetic Models for Differentiating Glioblastoma and Primary Central Nervous System Lymphoma1Department of Radiology, The Affiliated Drum Tower Hospital of Nanjing University Medical School, Nanjing, China, 2Jiangsu Key Laboratory of Medical Optics, Suzhou Institute of Biomedical Engineering and Technology, Chinese Academy of Sciences, Suzhou, China., Suzhou, China
Synopsis
Keywords: Tumors (Pre-Treatment), DSC & DCE Perfusion, Glioblastoma, PCNSL, dynamic contrast-enhanced, tracer kinetic model
Motivation: The overlapping radiographical features between glioblastoma and primary central nervous system lymphoma (PCNSL) make it difficult to distinguish the two clinically.
Goal(s): This study aimed to compare values of conventional and advanced tracer kinetic models based on dynamic contrast enhanced (DCE)-MRI in differentiating glioblastoma and lymphoma.
Approach: Patients diagnosed as glioblastoma or lymphoma were examined using dynamic contrast-enhanced MRI. Imaging data were analyzed using tracer kinetic models.
Results: Permeability parameters of DP model attained best performance in differential diagnosis, with dominant features comprising significantly higher PS and E in the tumor region of lymphoma than in that of glioblastoma.
Impact: Distributed parameter (DP) model demonstrated excellent performance in differentiating PCNSL and glioblastoma and permeability parameters of advanced tracer kinetic models such as PS and E could be promising imaging biomarkers.
Introduction
MR imaging features of glioblastoma and primary central nervous system lymphoma (PCNSL) are highly overlapping, making it difficult to differentiate when based only on conventional MR imaging1,2. Given the choice of surgical protocol and the assessment of prognosis, it is important to accurately distinguish between glioblastoma and PCNSL before surgery3.Compared with conventional imaging techniques, DCE perfusion has the advantages of higher spatial resolution, better quantification of microvascular leakiness and perfusion, and increased resistance to susceptibility artifacts4,5. DCE imaging data can be quantitatively analyzed using a tracer kinetic model, a mathematical description of tracer molecular transport within the tissue microenvironment that derives quantitative values of various model parameters pertaining to the tissue status. However, the results of conventional tracer kinetic models such as Tofts or Extended-Tofts model have been ambiguous6. The meaning of several terms has been summarized in Table 1. Primary tracer kinetic models have been listed in Table 2.
This study aimed to compare values of conventional and advanced tracer kinetic models in differentiating glioblastoma and PCNSL and to reveal the characteristics of the tumor microenvironment through permeability parameters.
Materials and Methods
Patients diagnosed as glioblastoma or primary central nervous system lymphoma between 2022 and 2023 were included. All patients underwent examination before surgery in a 3.0T MR scanner (uMR770, United Imaging Healthcare). DCE-MRI was performed after Gadodiamide injection (0.2mL/kg, 3.5mL/s). DCE images were analyzed using MItalytics software (FISCA Healthcare, Singapore). Tofts, Extended-Tofts, approximated tissue homogeneity (ATH), Brix, and distributed parameter (DP) models were employed for quantitative analysis of DCE data, leading to the following parameters: Ktrans (Tofts, ExTofts), Ve (all), CBV (all), Kep (=Ktrans/Ve; Tofts, ExTofts); CBF, MTT, PS and E for ATH, Brix and DP.Distributed Parameter (DP) model was formulated as follows
$$C_{tiss}\left(t\right)=AIF\otimes F_{p}\left\{u\left(t\right)-u\left(t-\frac{V_{p}}{F_{p}}\right)+u\left(t-\frac{V_{p}}{F_{p}}\left\{1-\exp\left(-\frac{PS}{F_{p}}\right)\left[1+\int_{0}^{t-\frac{V_{p}}{F_{p}}} \exp\left(-\frac{PS}{V_{e}}\tau\right)\sqrt{\frac{PS}{V_{e}}\frac{PS}{F_{p}}\frac{1}{\tau}}I_{1}\left(2\sqrt{\frac{PS}{V_{e}}\frac{PS}{F_{p}}\tau}\right)d\tau\right]\right\}\right)\right\} $$
where AIF denotes artery input function, Ctiss(t) is the tissue tracer concentration with time. u(t) denotes the Heaviside unit-step function and I1 is the modified Bessel function. The derived kinetic parameters include: blood flow (Fp), vessel wall permeability (PS), fractional volume of intravascular space (Vp), fractional volume of interstitial space (Ve). Extracted fraction of first pass was calculated as$$E=1-\exp\left(1-\frac{PS}{F_{p}}\right) $$
Region-of-interests of tumor, edema and normal white matter (nWM) were delineated manually. Parameter values were normalized by nWM. Mann-Whitney U test was utilized to compare the difference between groups. Performance of differential diagnosis was quantified using area under ROC curve (AUC). Parameters with P<0.05 were selected and fused using Logistic regression method.
Results
Forty-one patients were included, with 29 glioblastoma and 12 lymphoma. Model-wise AUCs were 0.787(Tofts), 0.796(Extended-Tofts),0.816(ATH),0.796(Brix),0.856(DP) (Figure 1), where DP attained best performance in differential diagnosis, with dominant features comprising significantly higher PS and E in the tumor region of lymphoma than in that of glioblastoma (PS: 19.4[7.6,28.9] mL/min/100mL vs 3.1[1.8,8.8]mL/min/100mL, p<0.001; E: 41.4[19.3,47.7]% vs 8.9[5.9,21.0]%, p<0.001) (Figure 2).Discussion
This study evaluated the diagnostic performance of DCE tracer kinetic models– derived vascular permeability parameters to facilitate the preoperative differentiation of glioblastoma and PCNSL. As shown in results, DP model demonstrated excellent performance in differentiating PCNSL and glioblastoma. Furthermore, PCNSL demonstrated significantly higher PS and E values based on DP model. This might be due to separate accounting of blood flow and vessel wall permeability in DP7, suggesting increased vascular permeability for PCNSL8.The advanced tracer kinetic models such as DP model can more truly reflect the transportation of tracers in tissues, and quantitatively express the tissue microenvironment and vascular permeability. Future researchers should make full use of the advanced DCE model and obtain reasonable thresholds for clinical application after massive data verification, so as to predict glioma grade, genotyping and differential diagnosis.
Conclusion
Permeability parameters of DP model could be promising imaging biomarkers in differential diagnosis of glioblastoma and lymphoma, where lymphoma presented higher permeability in vessel walls.Acknowledgements
No acknowledgement found.References
1. Kang KM, Choi SH, Chul-Kee P, et al. Differentiation between glioblastoma and primary CNS lymphoma: application of DCE-MRI parameters based on arterial input function obtained from DSC-MRI. European Radiology. 2021;31(12):9098–9109.
2. Lin X, Lee M, Buck O, et al. Diagnostic Accuracy of T1-Weighted Dynamic Contrast-Enhanced-MRI and DWI-ADC for Differentiation of Glioblastoma and Primary CNS Lymphoma. AJNR. American journal of neuroradiology. 2017;38(3):485–491.
3. Davis ME. Glioblastoma: Overview of Disease and Treatment. Clin J Oncol Nurs. 2016 Oct 1;20(5 Suppl): S2-8.
4. Cha S. Update on brain tumor imaging: from anatomy to physiology. AJNR Am J Neuroradiol. 2006 Mar;27(3):475-487.
5. Essig M, Shiroishi MS, Nguyen TB, et al. Perfusion MRI: the five most frequently asked technical questions. AJR Am J Roentgenol. 2013 Jan;200(1):24-34.
6. Kickingereder P, Wiestler B, Sahm F, et al. Primary central nervous system lymphoma and atypical glioblastoma: multiparametric differentiation by using diffusion-, perfusion-, and susceptibility-weighted MR imaging. Radiology. 2014 Sep;272(3):843-850.
7. Li Z, Zhao W, He B, et al. Application of Distributed Parameter Model to Assessment of Glioma IDH Mutation Status by Dynamic Contrast-Enhanced Magnetic Resonance Imaging. Contrast Media & Molecular Imaging. 2020; 2020:8843084.
8. Molna´r PP, O’Neill BP, Scheithauer BW, et al. The blood-brain barrier in primary CNS lymphomas: ultrastructural evidence of endothelial cell death. Neuro Oncol 1999; 1:89 –10.
Figures
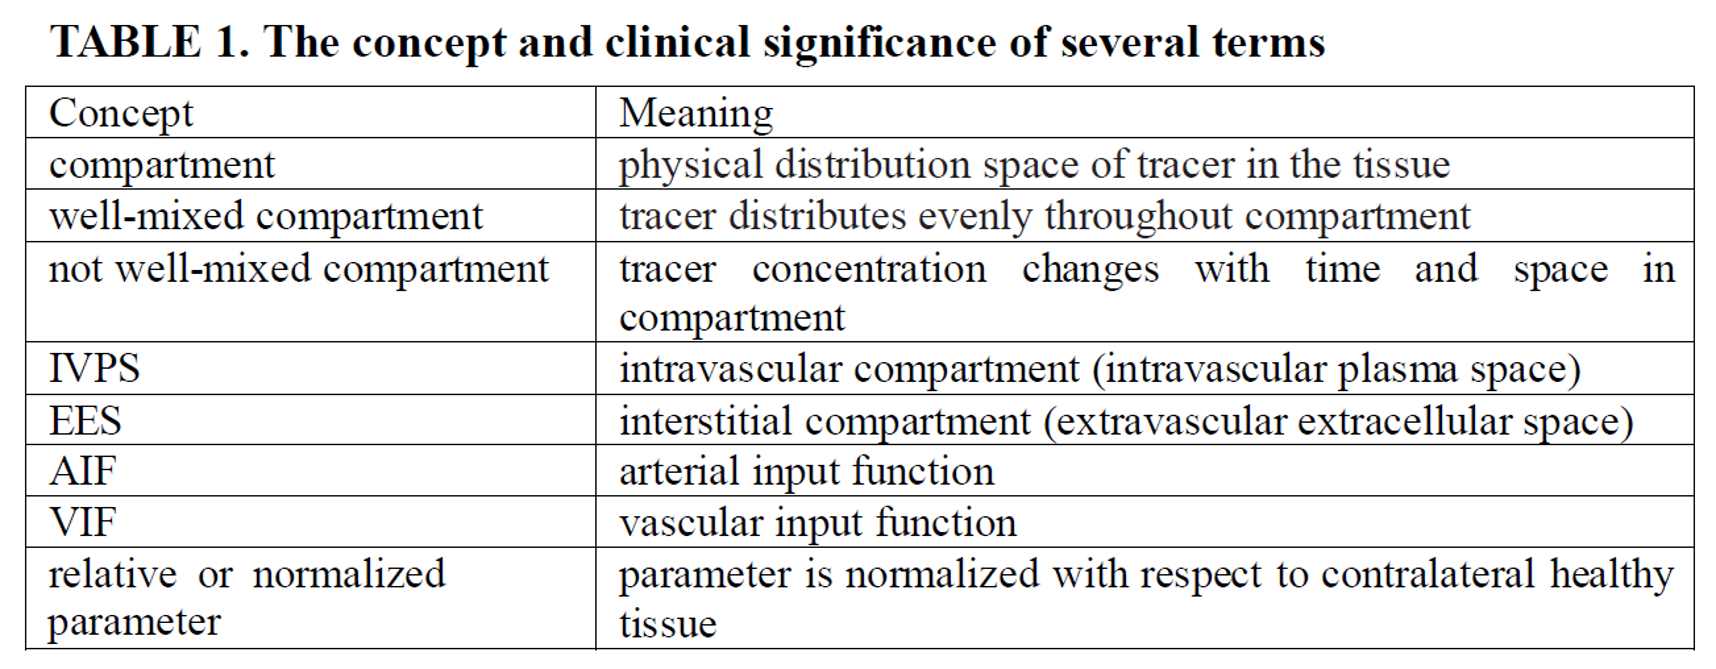
TABLE 1 The concept and clinical significance of several terms
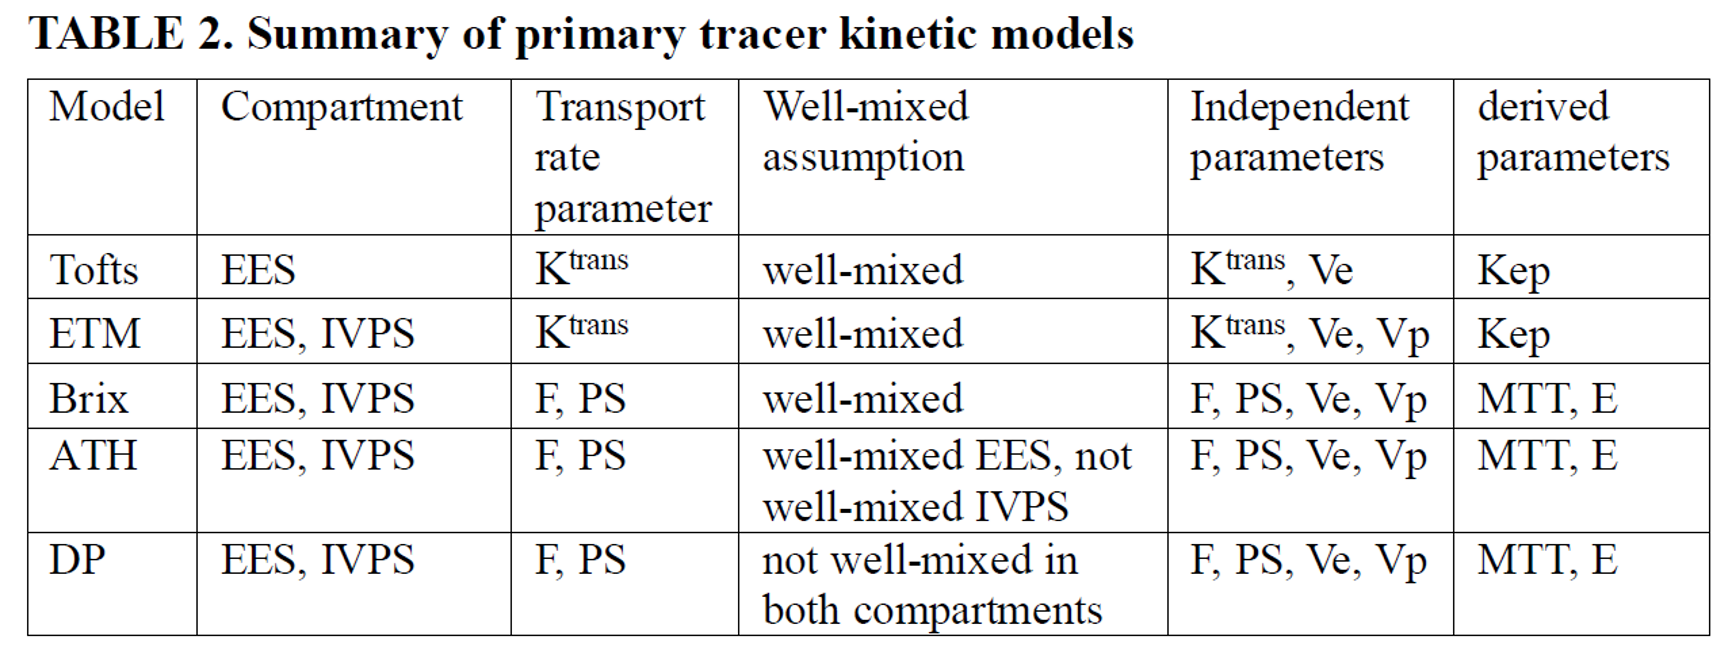
TABLE 2 Summary of primary tracer kinetic models
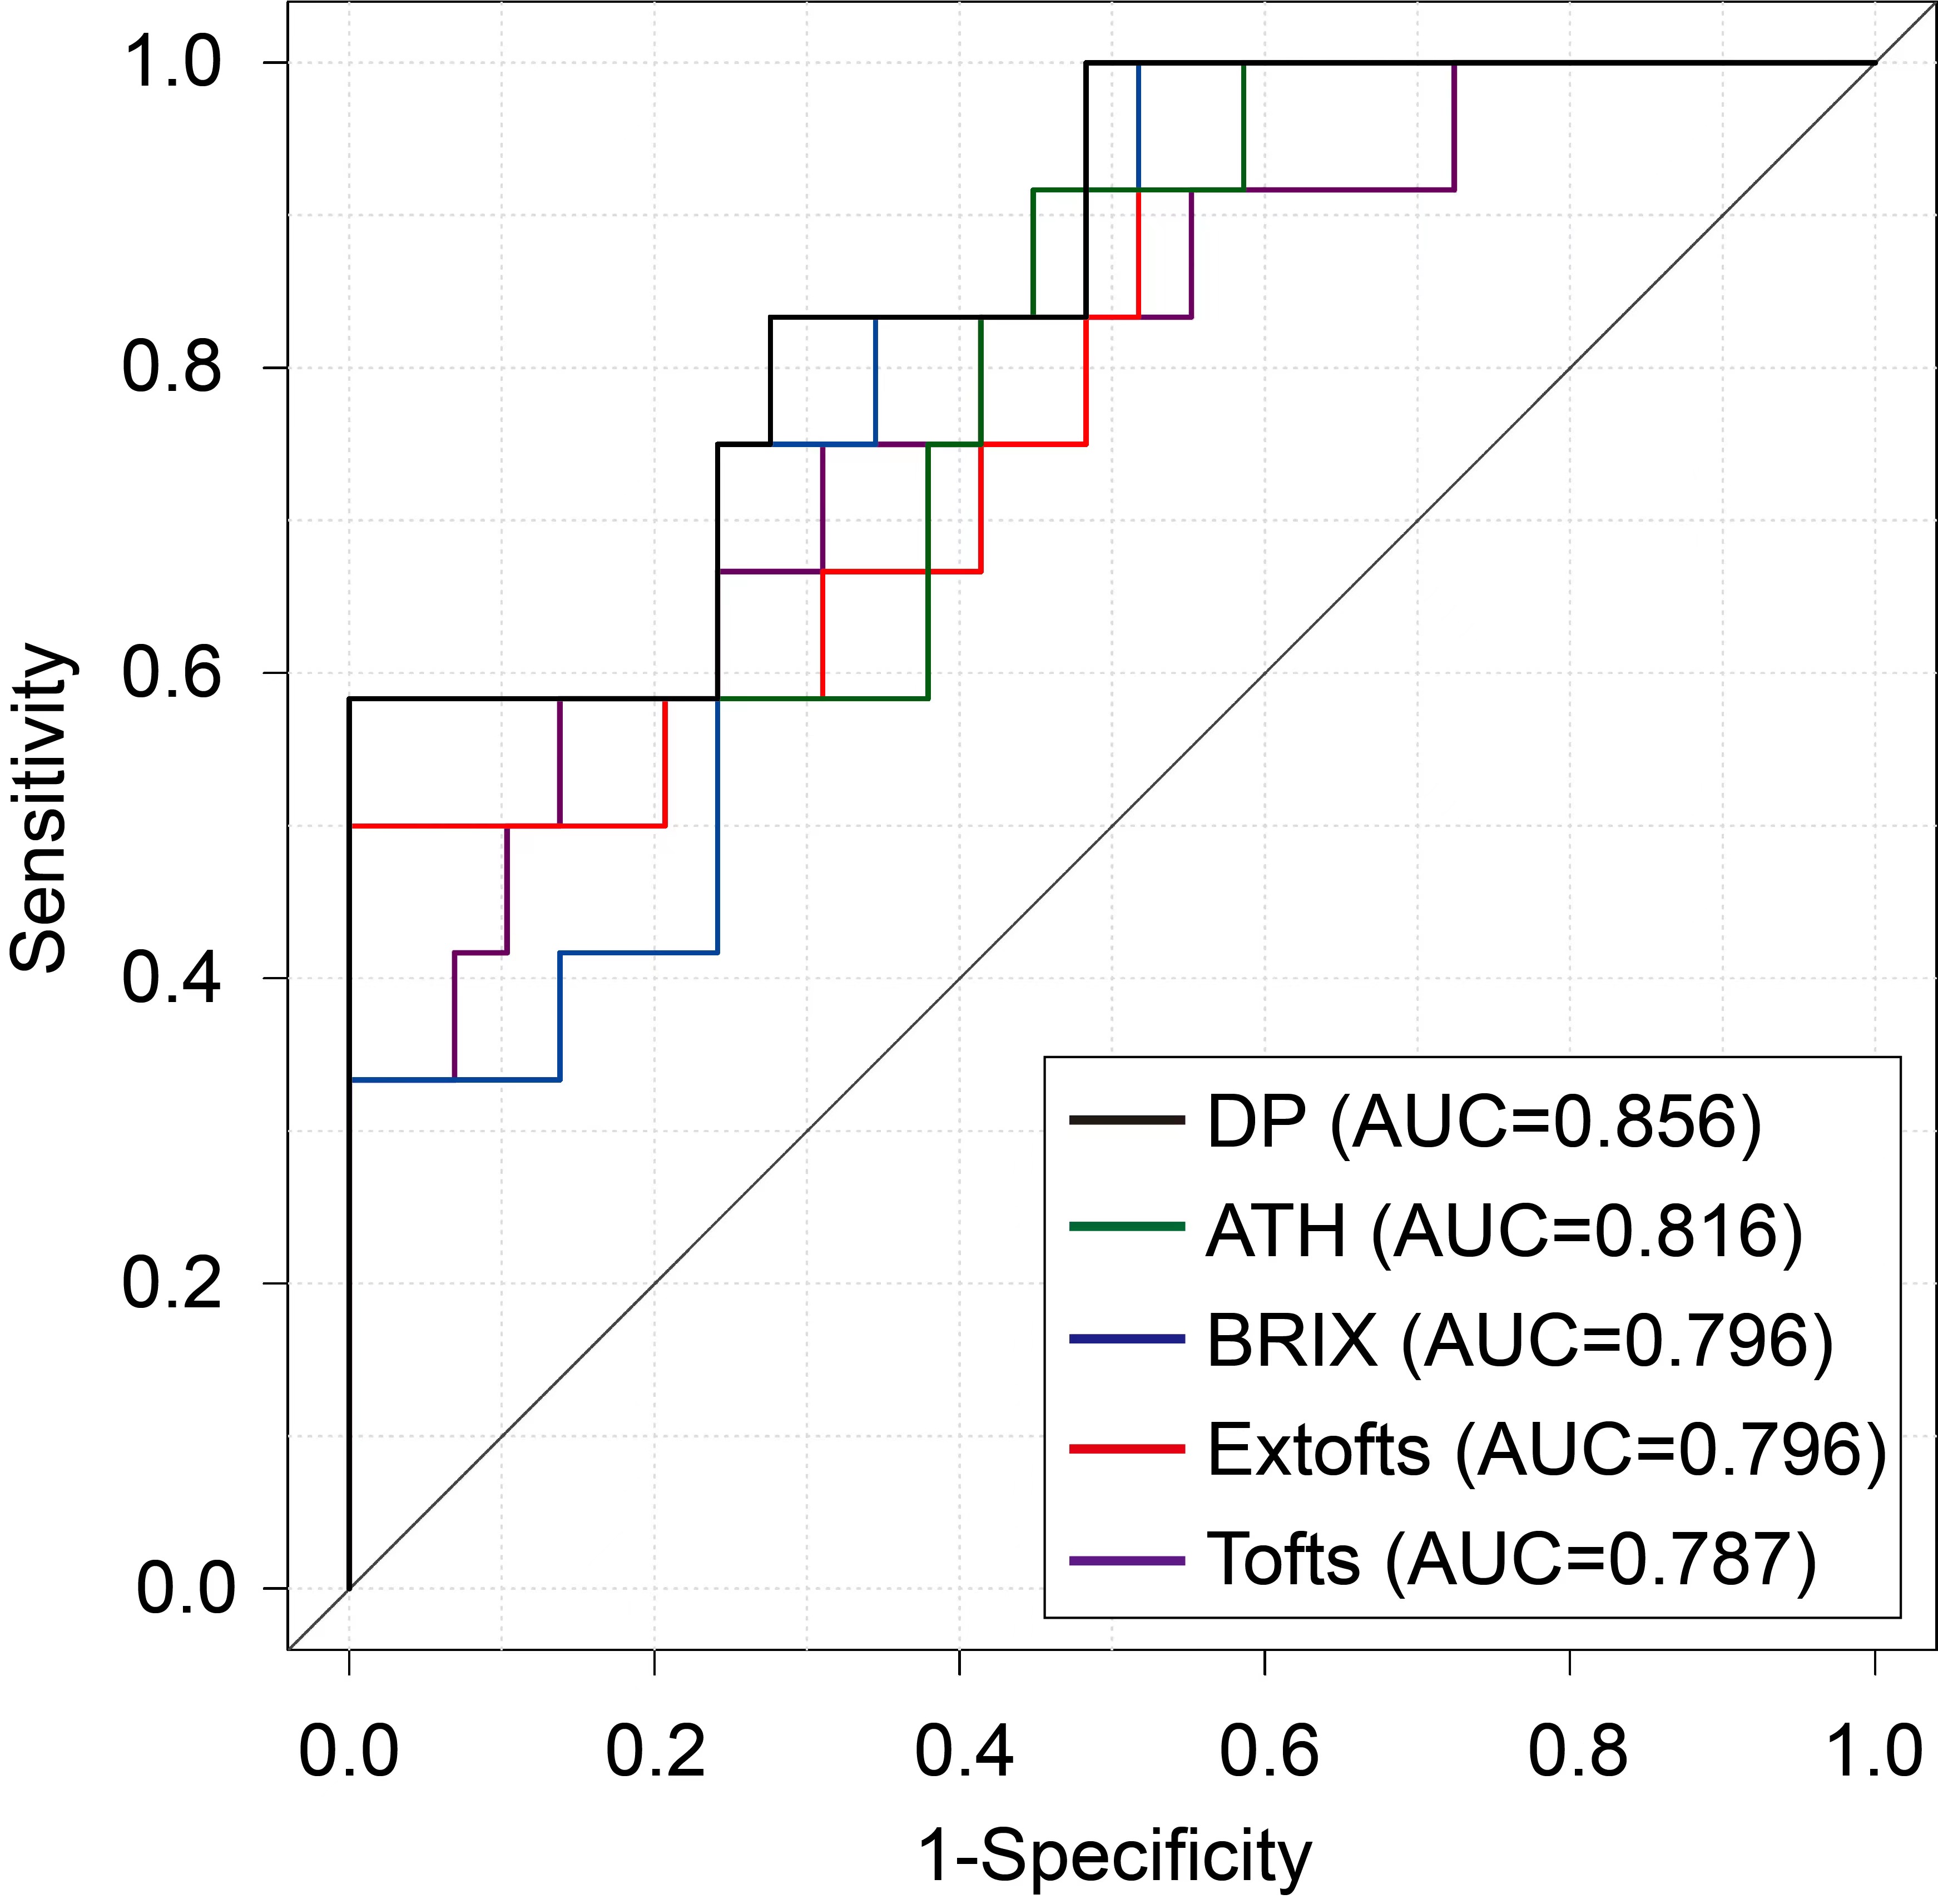
Figure 1 Plots of receiver operating characteristic curves in differentiating glioblastoma and PCNSL
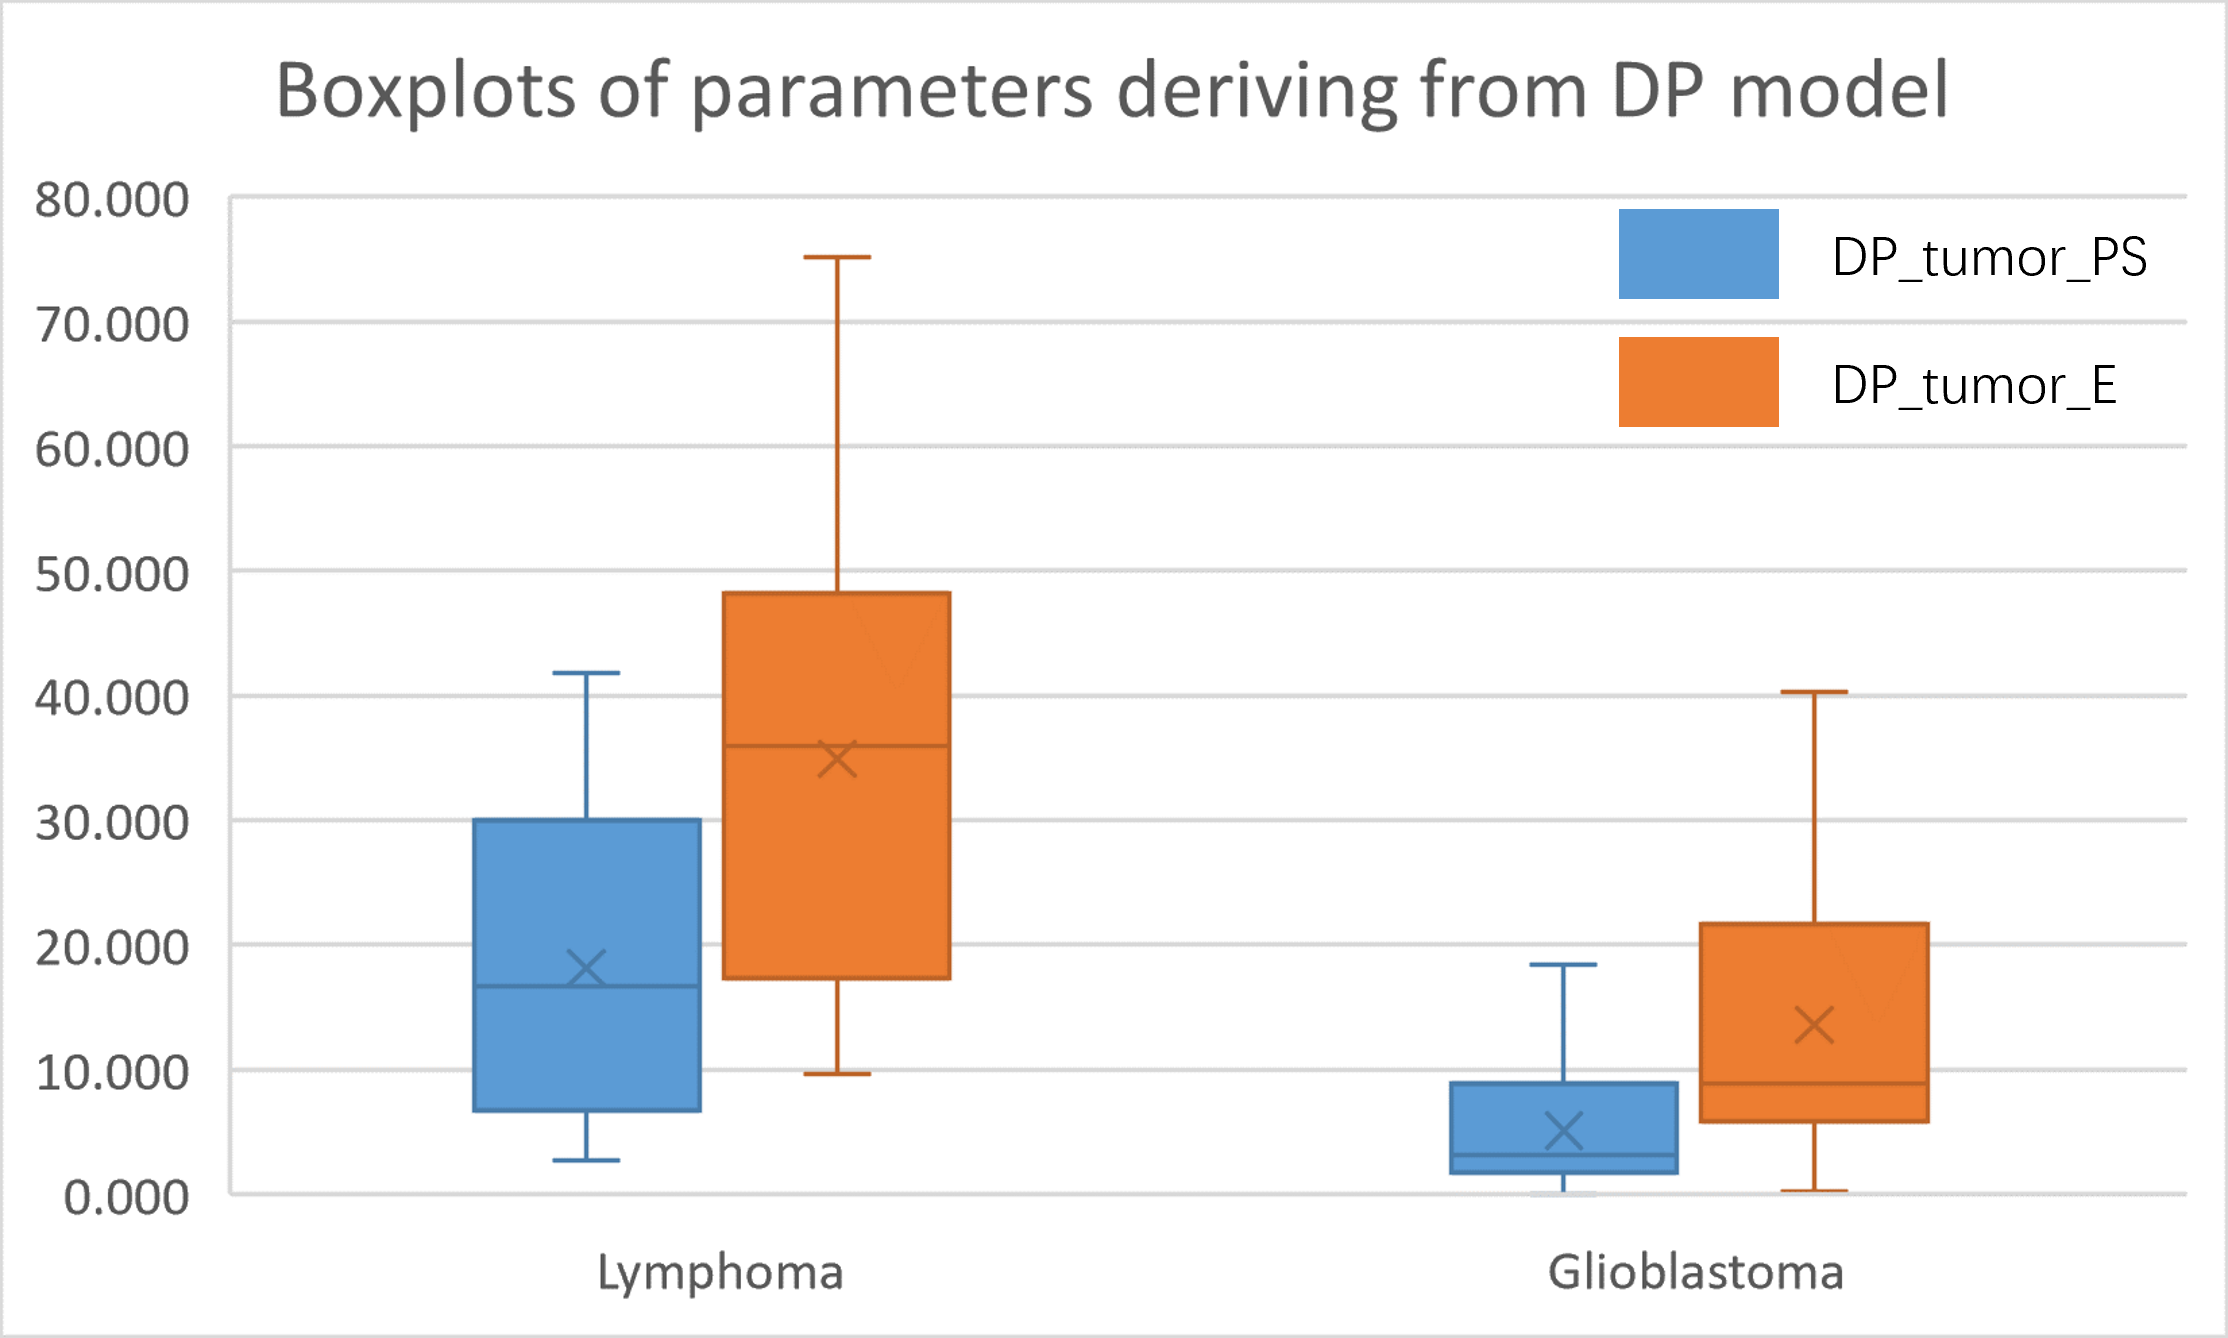
Figure 2 Boxplots of parameters deriving from distributed parameter (DP) model in differentiating glioblastoma and PCNSL