3851
Orientation Dispersion Index identifies sub-areas in the edema tissue of glioblastoma1Department of Surgery, Oncology and Gastroenterology, University of Padova, Padova, Italy, 2Department of Information Engineering, University of Padova, Padova, Italy, 3Padova Neuroscience Center, University of Padova, Padova, Italy, 4Department of Neuroscience, University of Padova, Padova, Italy, 5Nuclear Medicine Unit, Department of Medicine, Padova University Hospital, Padova, Italy, 6Veneto Institute of Molecular Medicine, Padova, Italy
Synopsis
Keywords: Tumors (Pre-Treatment), Tumor
Motivation: Edema tissue in glioblastoma is not included in surgical resection, even though tumor cells infiltration could be mediated by it.
Goal(s): The aim of the study is to investigate the heterogeneity of edema.
Approach: Clustering analysis within edema is performed on the orientation dispersion index derived from diffusion magnetic resonance imaging. Then, a non-parametric statistical test is carried out to assess the difference between the resulting edema sub-tissues (e.g., clusters).
Results: Two spatially separated clusters are found for all subjects. Statistically significant differences are observed between each couple of resulting clusters.
Impact: Edema is not a healthy tissue and the possibility of identifying sub-tissues within it could aid clinical practice and pre-surgical planning. This study works at single-subject level, allowing the focus on the specific glioblastoma cases.
Introduction
Edema tissue is an area within glioblastoma, one of the most malignant types of primary brain tumors1. Given that the blood-brain barrier is locally disrupted, edema is associated with both accumulation of plasma fluid in the extracellular space and infiltration of tumor cells2. The identification of these two components before surgical resection is therefore paramount. Several Magnetic Resonance Imaging (MRI) modalities have been used to address this issue3. In particular, diffusion MRI has already shown its ability to provide insights on edema tissue4-6. The aim of the present study is therefore to investigate the heterogeneity of edema.Methods
Data were collected on a 3T Siemens Biograph mMR-PET/MR scanner (Padova, Italy). A total of sixteen glioblastoma patients were selected for this study. The Neurite Orientation and Dispersion Density Imaging (NODDI) protocol7, a multi-shell dMRI acquisition of a total of 100 diffusion weighted images was used (TR=5355 ms, TE=104 ms, voxel size=2×2×2 mm3, FOV=220×220 mm2, 68 slices, multiband accelerator factor=2 - 10 images at b=0 s/mm2, 30 diffusion weighted images (DWIs) at b value=710 s/mm2 and 60 DWIs at b value=2855 s/mm2). Considering the subsequent distortion correction, each diffusion direction was acquired with reverse phase encoding directions. Lesions were manually delineated on structural images by an experienced neuroradiologist that segmented them into four main tissues, including edema. The NODDI model with Watson distributions was quantified and the orientation dispersion index (ODI) parameter map was then brought in the T1w-weighted image space in which lesion masks were delineated. All following analysis was carried out at single-subject level. Clustering analysis using the fuzzy C-means algorithm8 was performed on the values of ODI maps corresponding to edema tissue. The optimal number of clusters was chosen in the range [2,5] (i.e., [min,max]) by using the Silhouette coefficient. Wilcoxon rank sum test was carried out to assess the statistical differences between the resulting clusters.Results
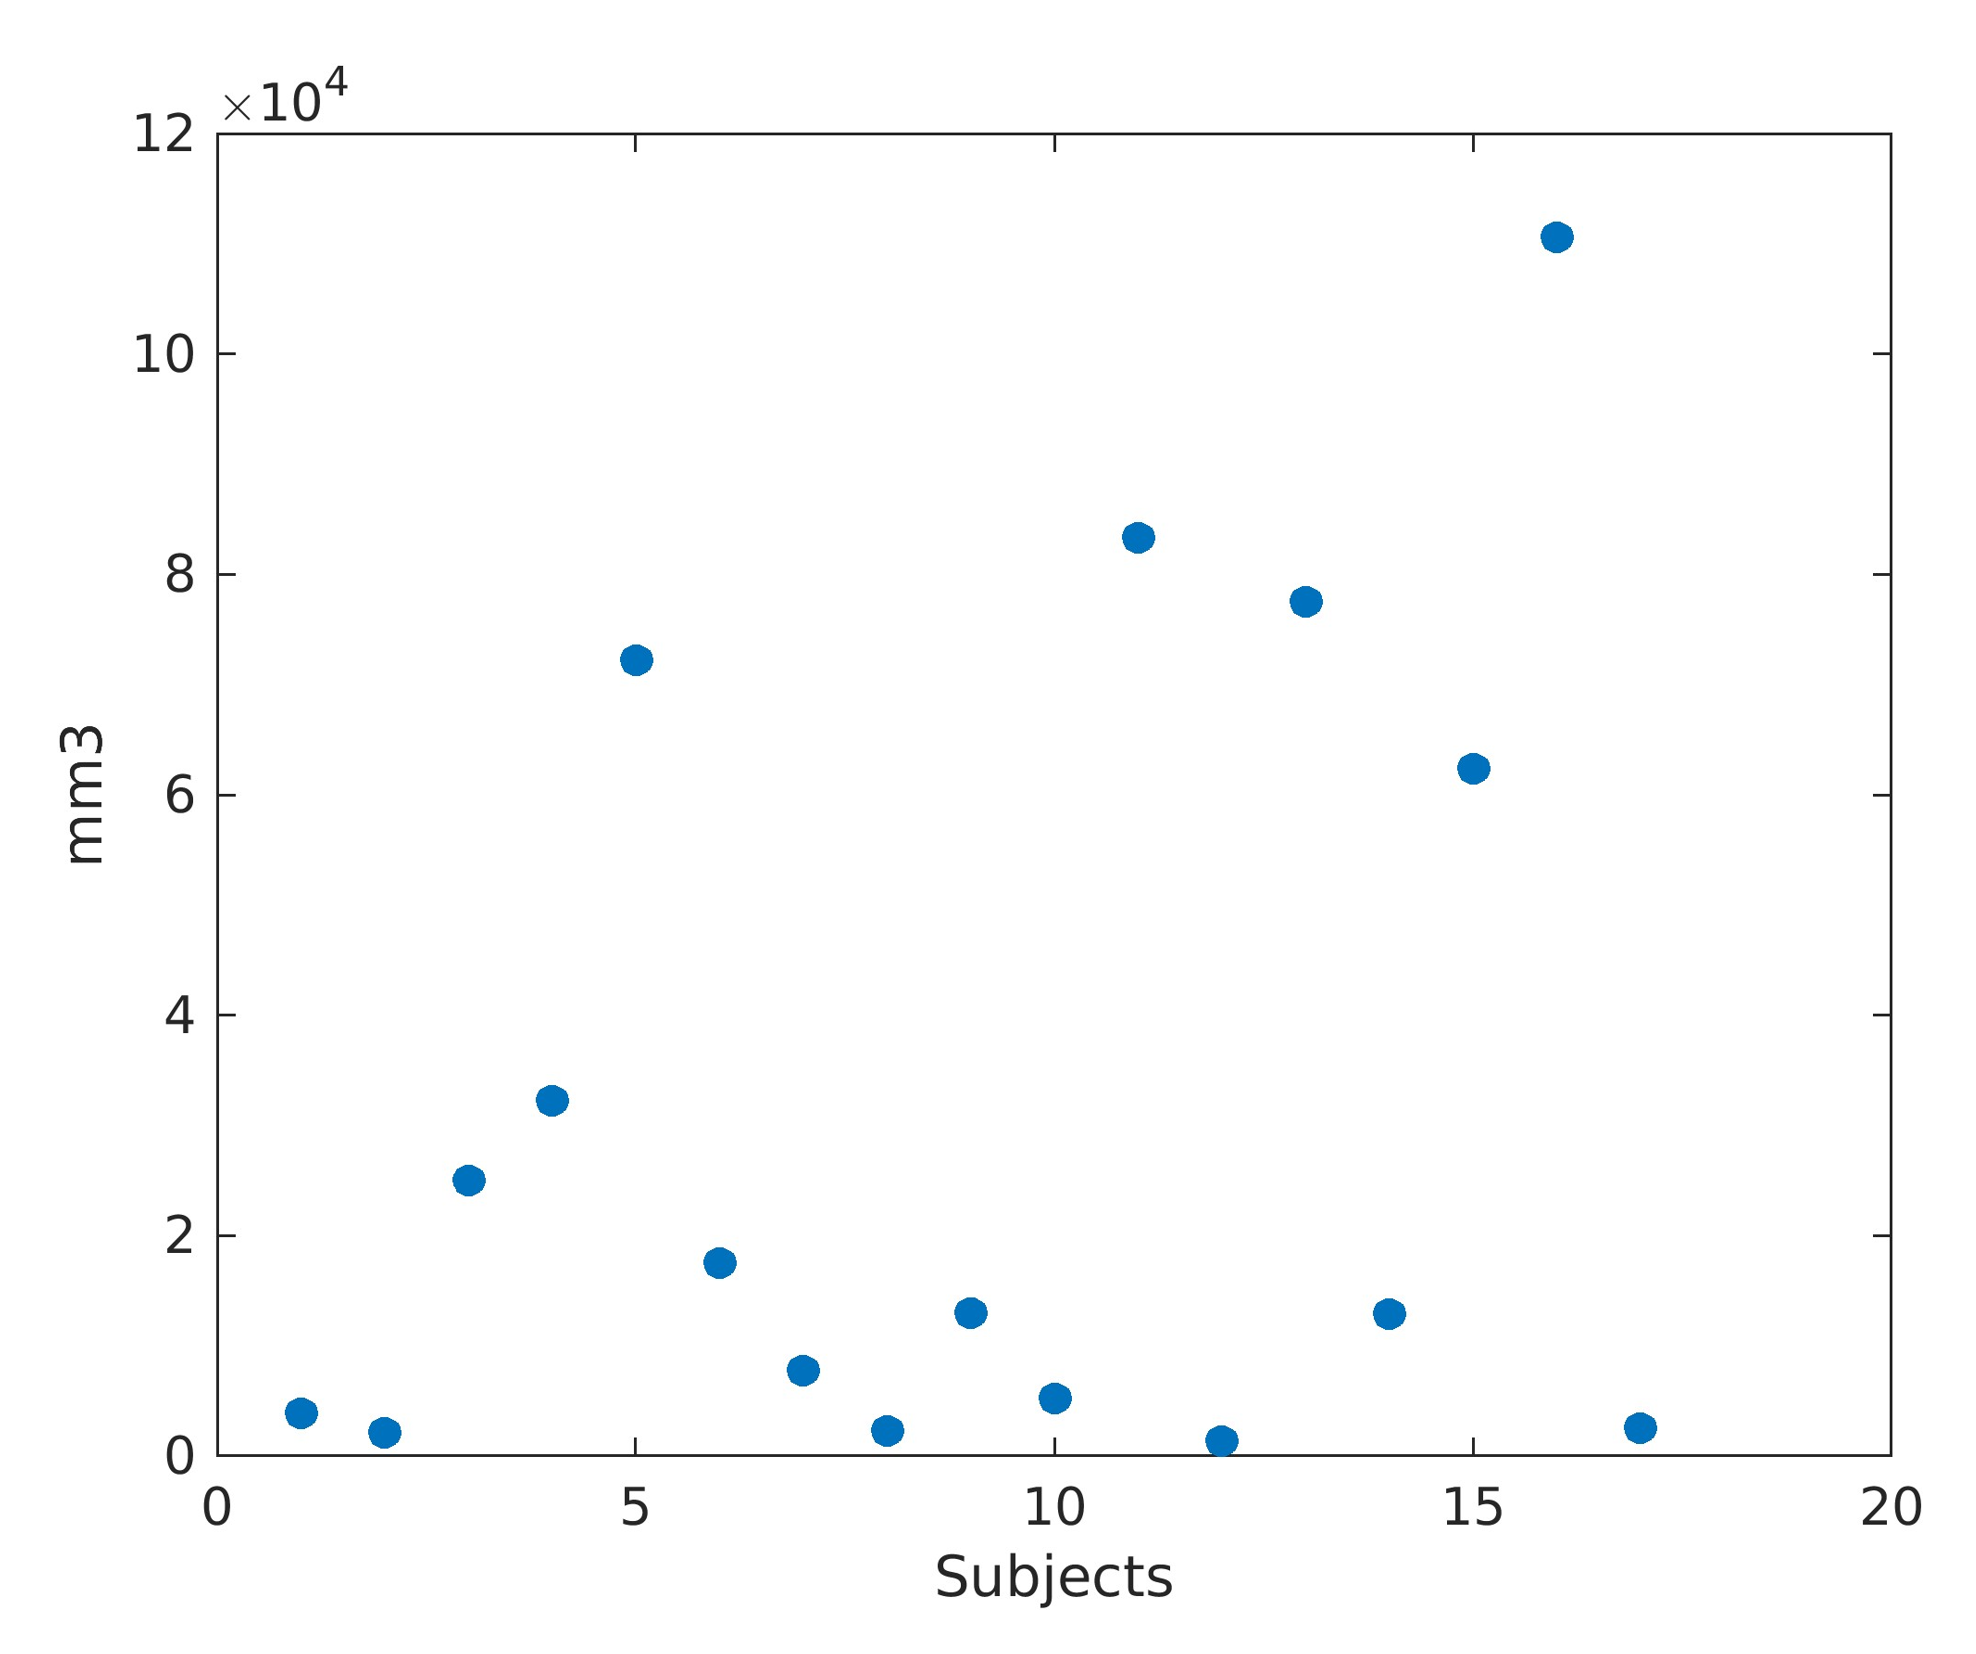
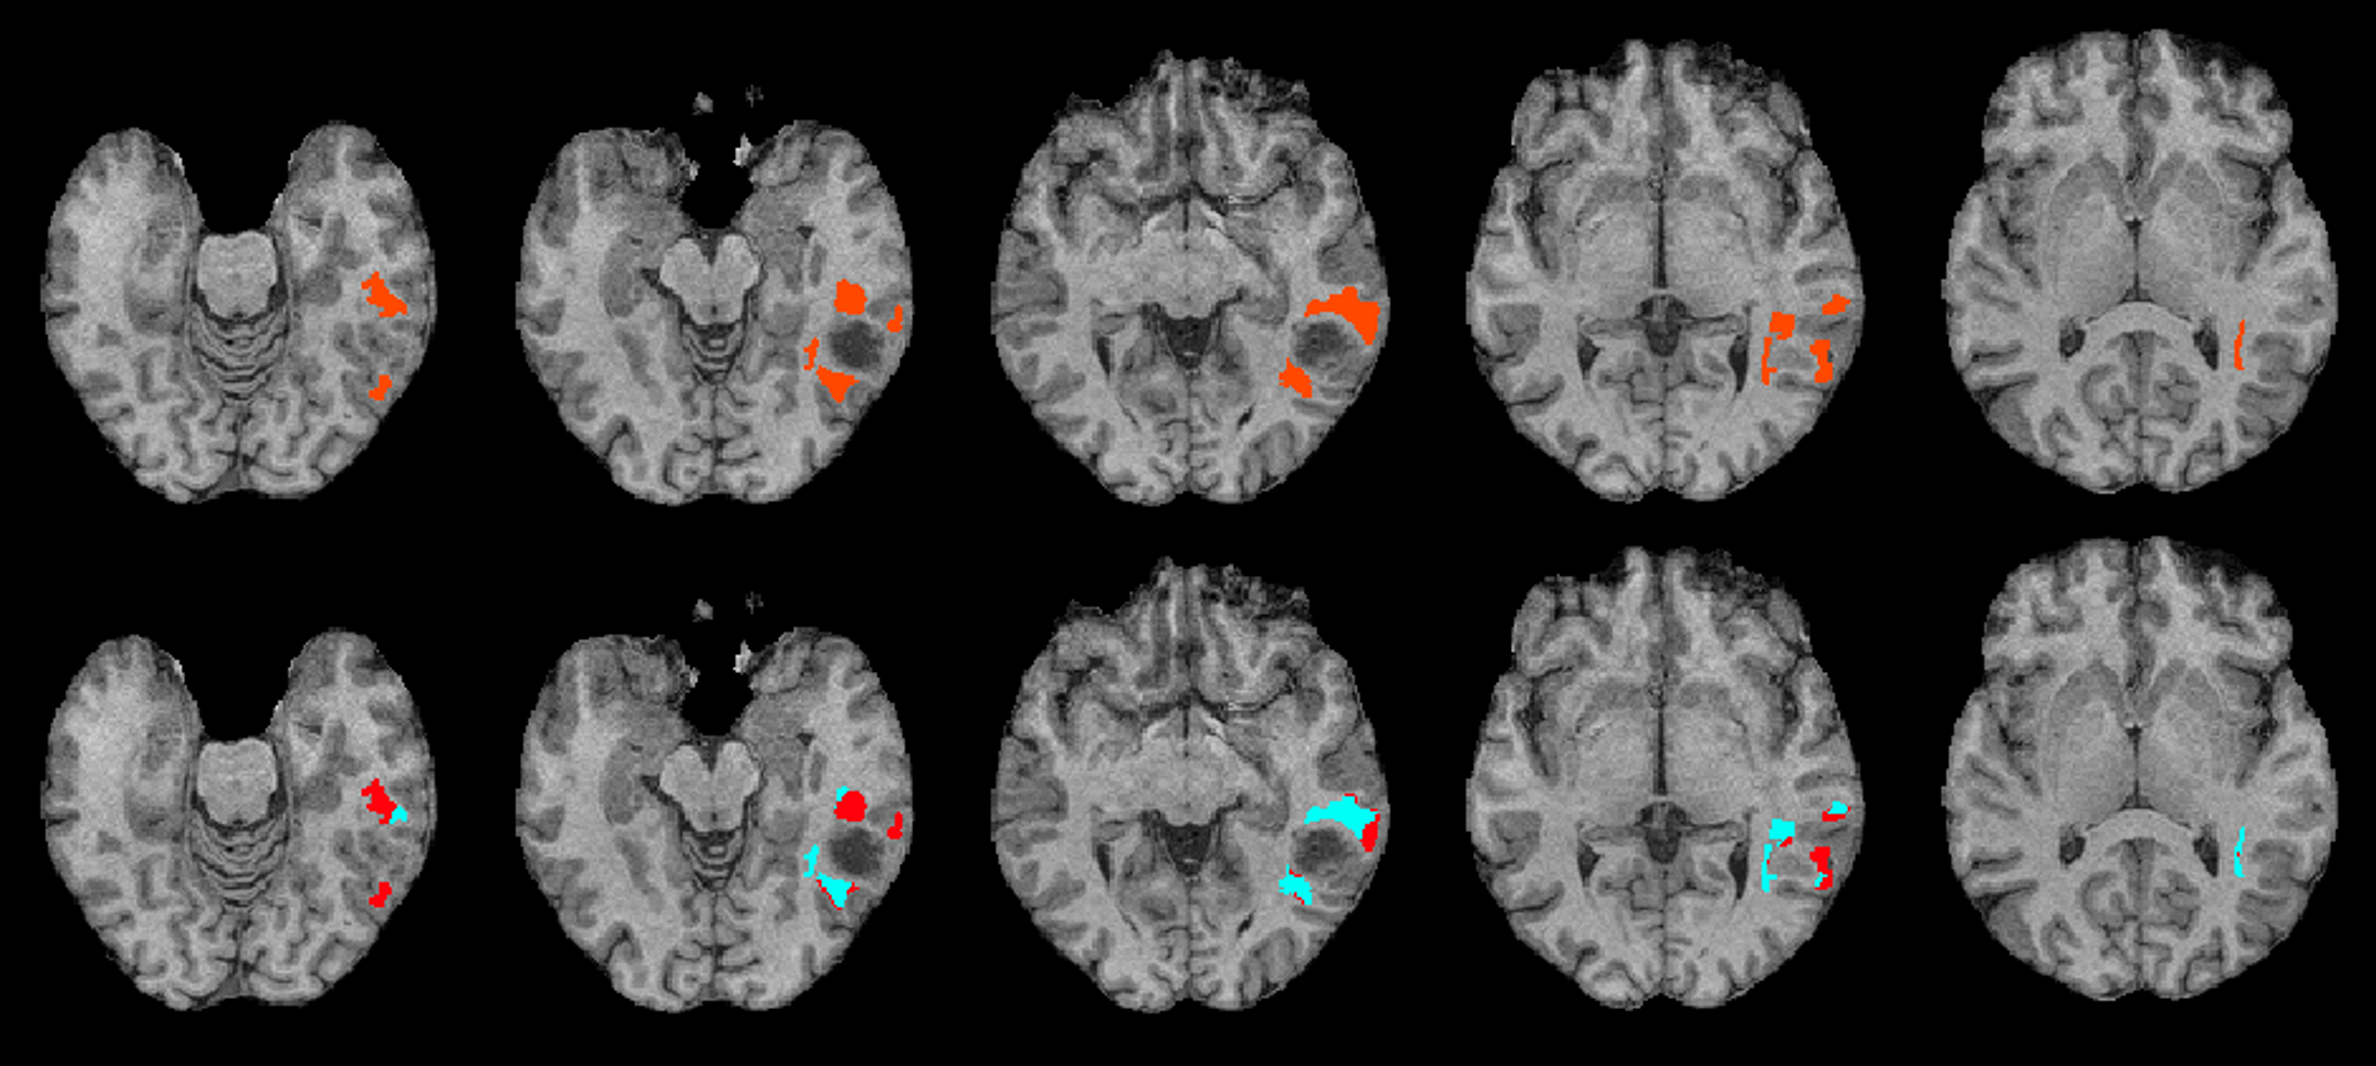
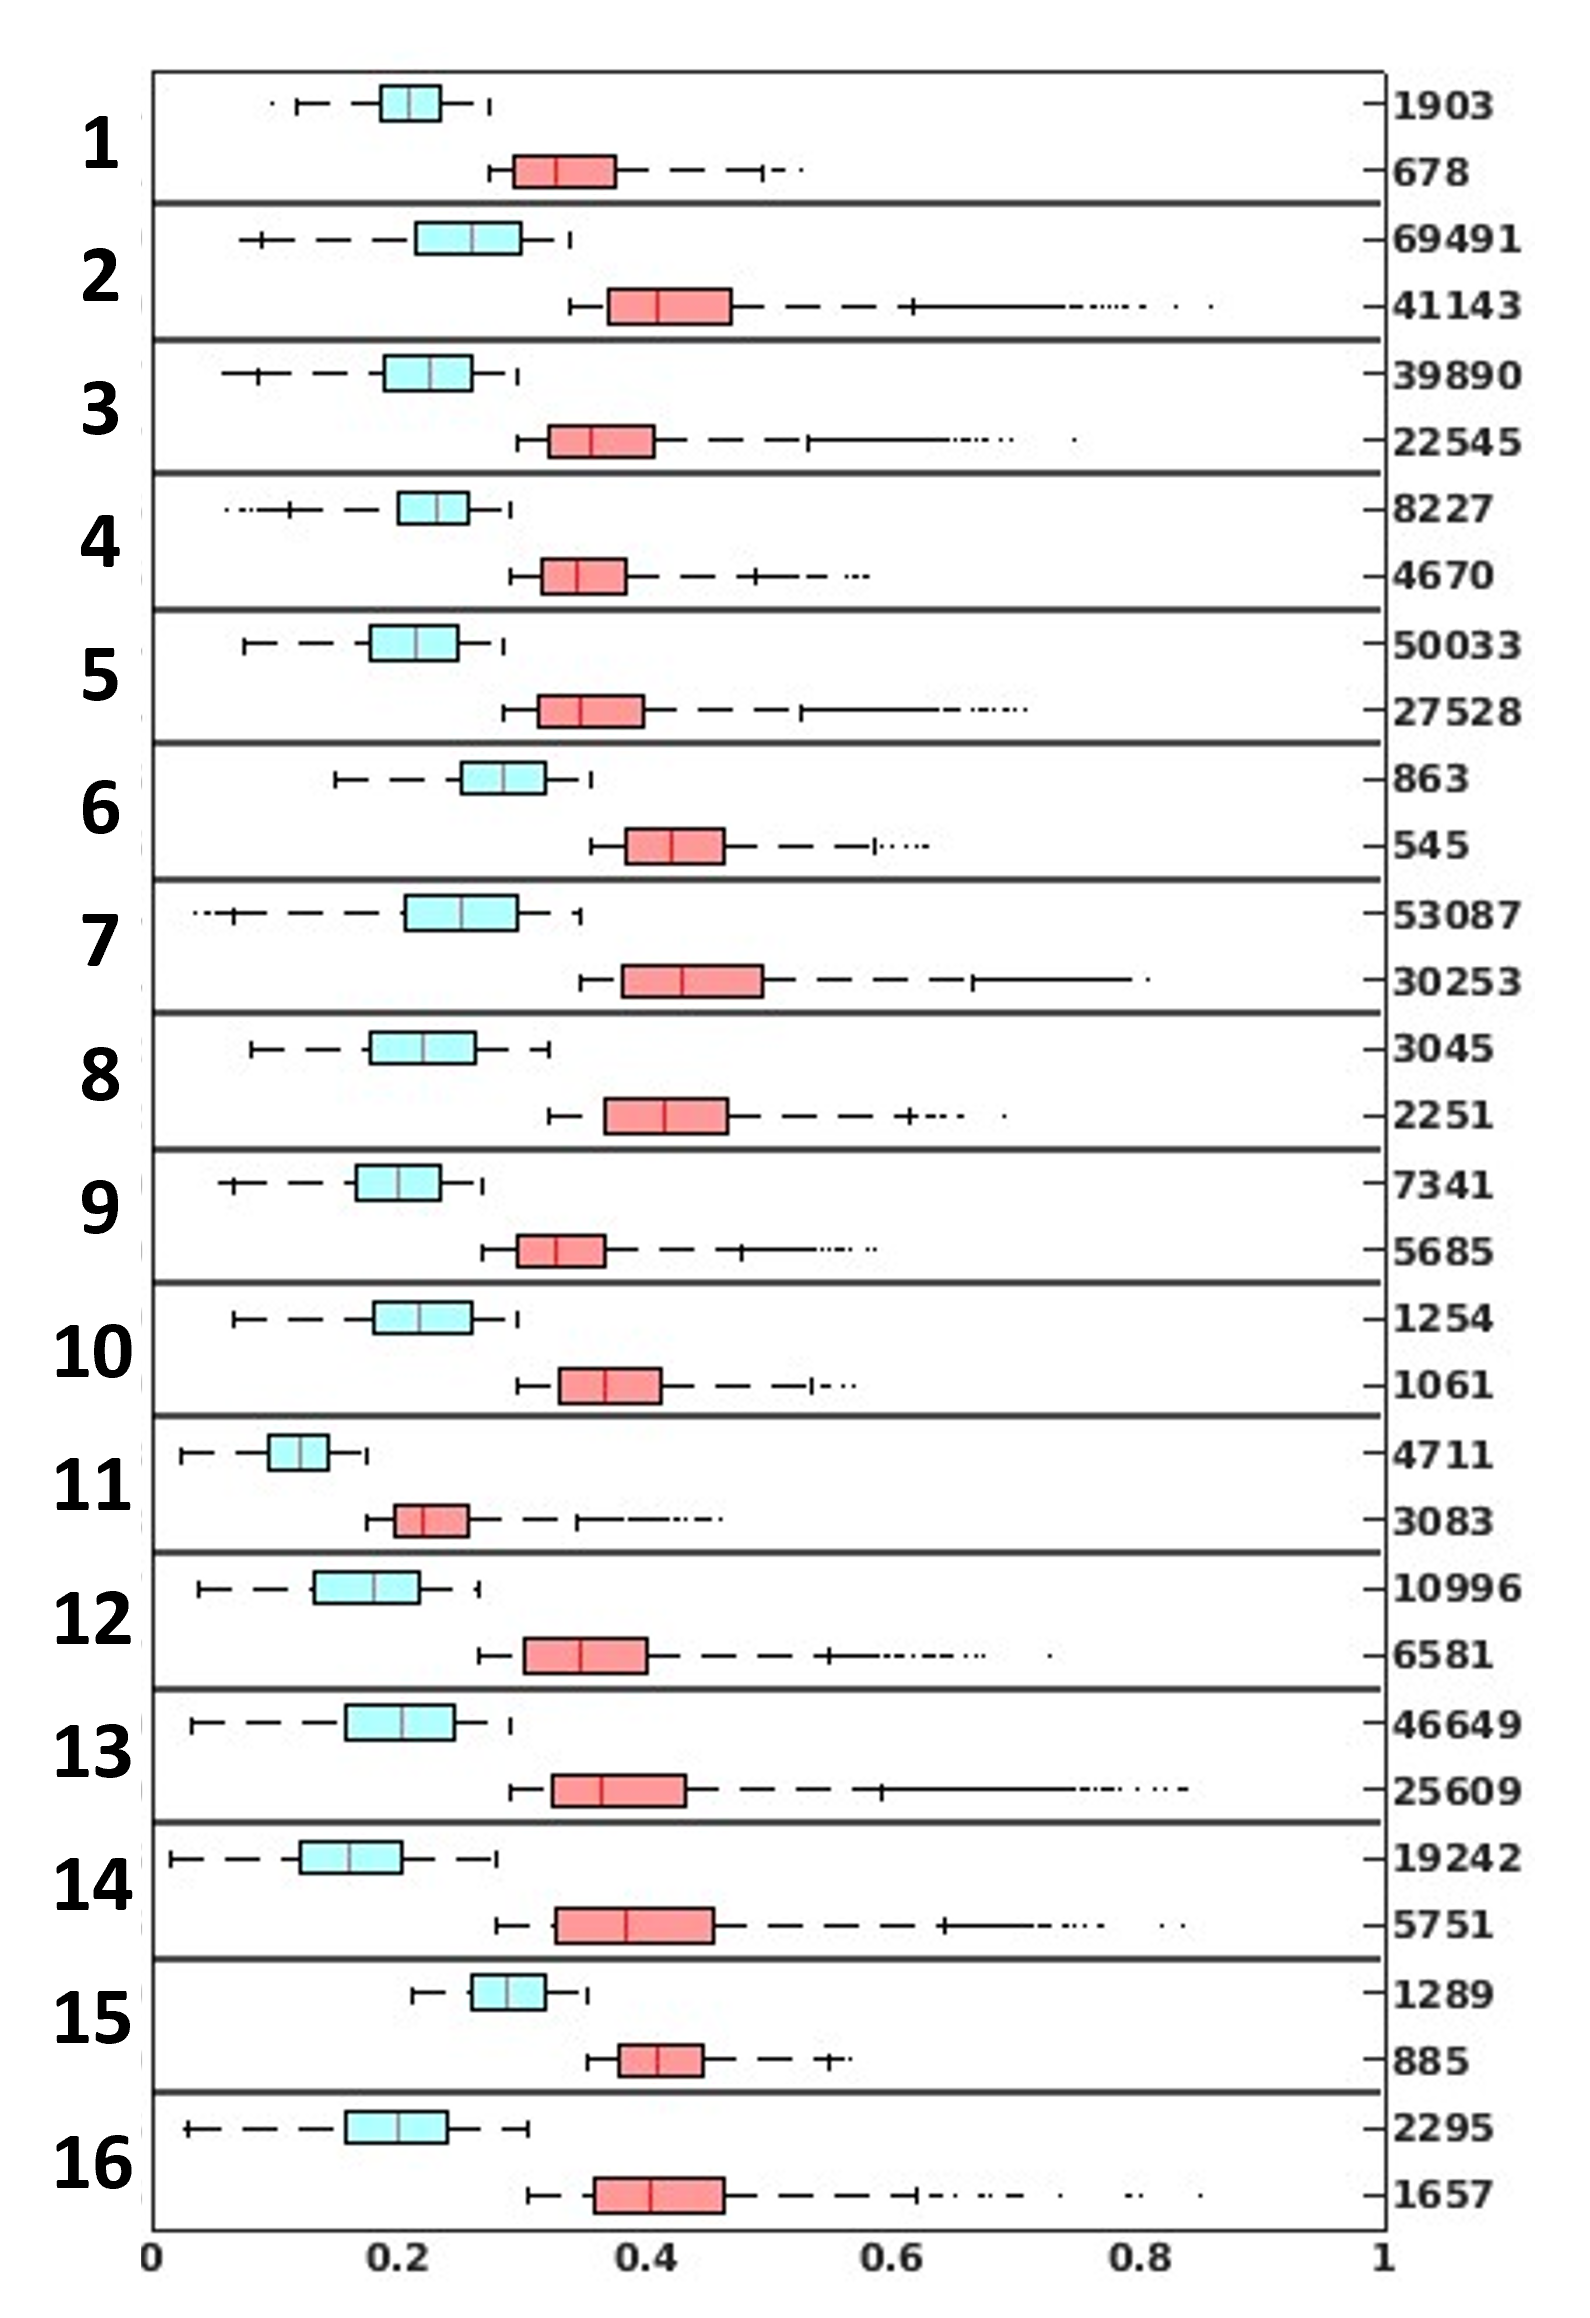
Despite the heterogeneity of edema volumes (reported in Figure 1), clustering analysis revealed that the optimal number of clusters is equal to two, for all subjects. As shown in Figure 2, resulting clusters do not present scattered spatial distribution. On the contrary, they are spatially separated and well-defined. In Figure 3, for each subject are depicted the distributions of ODI values of the resulting clusters, together with the number of voxels of which they are composed of. Statistically significant differences (p<0.05, FDR corrected) were found between the two cluster distributions for all subjects.Discussion
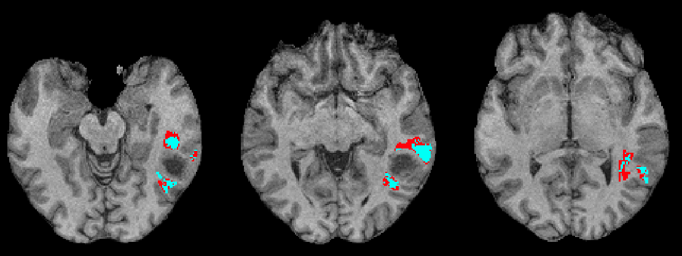
It is known that edema is a complex tissue, though it is hard to identify its main components. The clustering analysis performed on the ODI values of the edema resulted in two spatially separated clusters for all subjects. One could argue that this is not sufficient to show edema heterogeneity since the algorithm searched for the optimal number of clusters according to a predefined list, starting from a number of clusters equal to two. To address this issue a non-parametric statistical test confirmed the difference between the two resulting clusters. In addition, to investigate the nature of the clusters that have been found, clustering was repeated on structural images but, as shown in Figure 4, resulting clusters were not well-spatially distributed, suggesting that the structural composition of the tissue is not the main factor to lead to the differentiation. A limitation of the present study is the small sample size, which could be addressed by future work.Conclusion
Clustering analysis of ODI values within edema successfully confirmed that this tissue is heterogeneous. It is possible to define sub-areas that could be further investigated and that could provide clinical support and could be used for pre-surgical planning.Acknowledgements
No acknowledgement found.References
1. Louis DN, Perry A, Wesseling P, et al. The 2021 WHO Classification of Tumors of the Central Nervous System: a summary. Neuro Oncol. 2021 Aug 2;23(8):1231-1251.
2. Klatzo I. Pathophysiological aspects of brain edema. Acta Neuropathol. 1987;72(3):236-9.
3. Hasanzadeh A, Moghaddam HS, Shakiba M, et al. The Role of Multimodal Imaging in Differentiating Vasogenic from Infiltrative Edema: A Systematic Review. Indian J Radiol Imaging. 2023 Aug 21;33(4):514-521.
4. Yang J, Zhang X, Gao X, et al. Fiber Density and Structural Brain Connectome in Glioblastoma Are Correlated With Glioma Cell Infiltration. Neurosurgery. 2023 Jun 1;92(6):1234-1242.
5. Chiu FY, Yen Y. Efficient Radiomics-Based Classification of Multi-Parametric MR Images to Identify Volumetric Habitats and Signatures in Glioblastoma: A Machine Learning Approach. Cancers (Basel). 2022 Mar 14;14(6):1475.
6. Okita Y, Takano K, Tateishi S, et al. Neurite orientation dispersion and density imaging and diffusion tensor imaging to facilitate distinction between infiltrating tumors and edemas in glioblastoma. Magn Reson Imaging. 2023 Jul;100:18-25.
7. Zhang H, Schneider T, Wheeler-Kingshott CA, et al. NODDI: practical in vivo neurite orientation dispersion and density imaging of the human brain. Neuroimage. 2012 Jul 16;61(4):1000-16.
8. Bezdek JC. Pattern Recognition with Fuzzy Objective Function Algorithms. Boston, MA: Springer US, 1981.
Figures