3849
Arterial Spin Labeling measured baseline perfusion stratifies survival in glioblastoma1Department of Radiology, UT Southwestern Medical Center, Dallas, TX, United States, 2Advanced Imaging Research Center, UT Southwestern Medical Center, Dallas, TX, United States, 3Philips Healthcare, Shanghai, China, 4Department of Neurology, UT Southwestern Medical Center, Dallas, TX, United States, 5Department of Hematology and Oncology, UT Southwestern Medical Center, Dallas, TX, United States
Synopsis
Keywords: Tumors (Pre-Treatment), Translational Studies, Treatment response, Survival prediction, Glioblastoma (GBM), Perfusion, Quantitative Imaging
Motivation: Quantitative measurements at baseline, prior to chemoradiation, can inform prognosis and optimal treatment strategies for patients with glioblastoma (GBM), however, such measurements using ASL are currently lacking.
Goal(s): To investigate ASL measured quantitative perfusion prior to chemoradiation for survival prediction in GBM patients.
Approach: Twenty-three newly diagnosed GBM patients were enrolled in this prospective IRB-approved study. Baseline scans with ASL and survival information were obtained.
Results: ASL measured baseline perfusion aids in survival prediction and stratification between groups with long (mean: 717 days) and short (mean: 361 days) survival in GBM.
Impact: Early and accurate survival stratification by ASL measured perfusion prior to chemoradiation treatment provides valuable opportunities for therapeutic interventions, including personalized and biologically driven radiation treatment planning and strategic discontinuation of traditional treatments for enrollment in promising clinical trials.
Introduction
Despite active research and advancements in therapeutic strategies, glioblastoma (GBM) persists as an aggressive tumor with a dismal prognosis. Early and accurate survival stratification before traditional treatments such as chemoradiation (CRT) is pivotal for personalized and optimal treatment planning. Literature suggested increased perfusion of gliomas is associated with shorter survival [1, 2] and Dynamic Susceptibility Contrast (DSC) was utilized to measure perfusion offering prognostic value [3, 4]. However, measurements with DSC are challenging and often contaminated by superimposing vessels. Furthermore, DSC requires contrast, which can be contraindicated in certain populations and less feasible for longitudinal assessments.Arterial Spin Labeling (ASL) MRI presents an advantageous alternative. As a non-contrast imaging modality, ASL is ideal for longitudinal monitoring. Despite its potential, applications of ASL in the context of survival prediction for GBM has been minimally explored [5, 6]. Most notably, there is no research investigating the implications of baseline ASL measurements performed post-surgery and before CRT treatment — a critical window for therapeutic intervention. This study aims to fill this gap, evaluating the utility of ASL measured baseline perfusion for survival prediction to inform prognosis and optimal treatment strategies in the management of GBM.
Methods
Subjects: This is a prospective, IRB-approved, single-institution study. Twenty-three newly diagnosed GBM patients without prior treatment except for surgery were recruited. A baseline MRI scan was performed prior to CRT treatment and after surgery, adhering to the Brain Tumor Imaging Protocol (BTIP) [7] recommendations and utilizing a 3D ASL sequence. All scans were performed on a 3T MR scanner (Ingenia, Philips Healthcare) with a 32-channel head coil.Image acquisition: ASL scans were acquired with label duration (LD)/post-label delay (PLD) = 1.8/1.8 s, acquired resolution = 3.5×3.5×6 mm3, reconstructed resolution = 3×3×3 mm3, 4 background suppression pulses and 5 inflow saturation pulses, TR/TE = 6000/14 ms, echo spacing = 2.8 ms, TSE factor = 80, 1 repetition, CASPR view ordering [8], and acquisition time = 3:10 minutes. A M0 image was acquired in 1:30 minutes.
Image analysis: Structural images were co-registered to the T1 post-contrast images. Tumor ROIs like enhancing tumor (ET), and tumor core were manually drawn by an experienced neuroradiologist (M. P.) in Figure 1A. The entire processing pipeline (Figure 1B) for ASL included format conversion from DICOM to NIfTI followed by skull stripping and co-registration to T1 post-contrast images. Cerebral blood flow (CBF) maps were calculated based on the ASL consensus paper recommendations [9]. Mean perfusion values within ET ROIs were extracted for further analysis.
Statistical Analysis: Scatter plot of mean perfusion values and Kaplan-Meier graphs were generated using GraphPad Prism.
Results
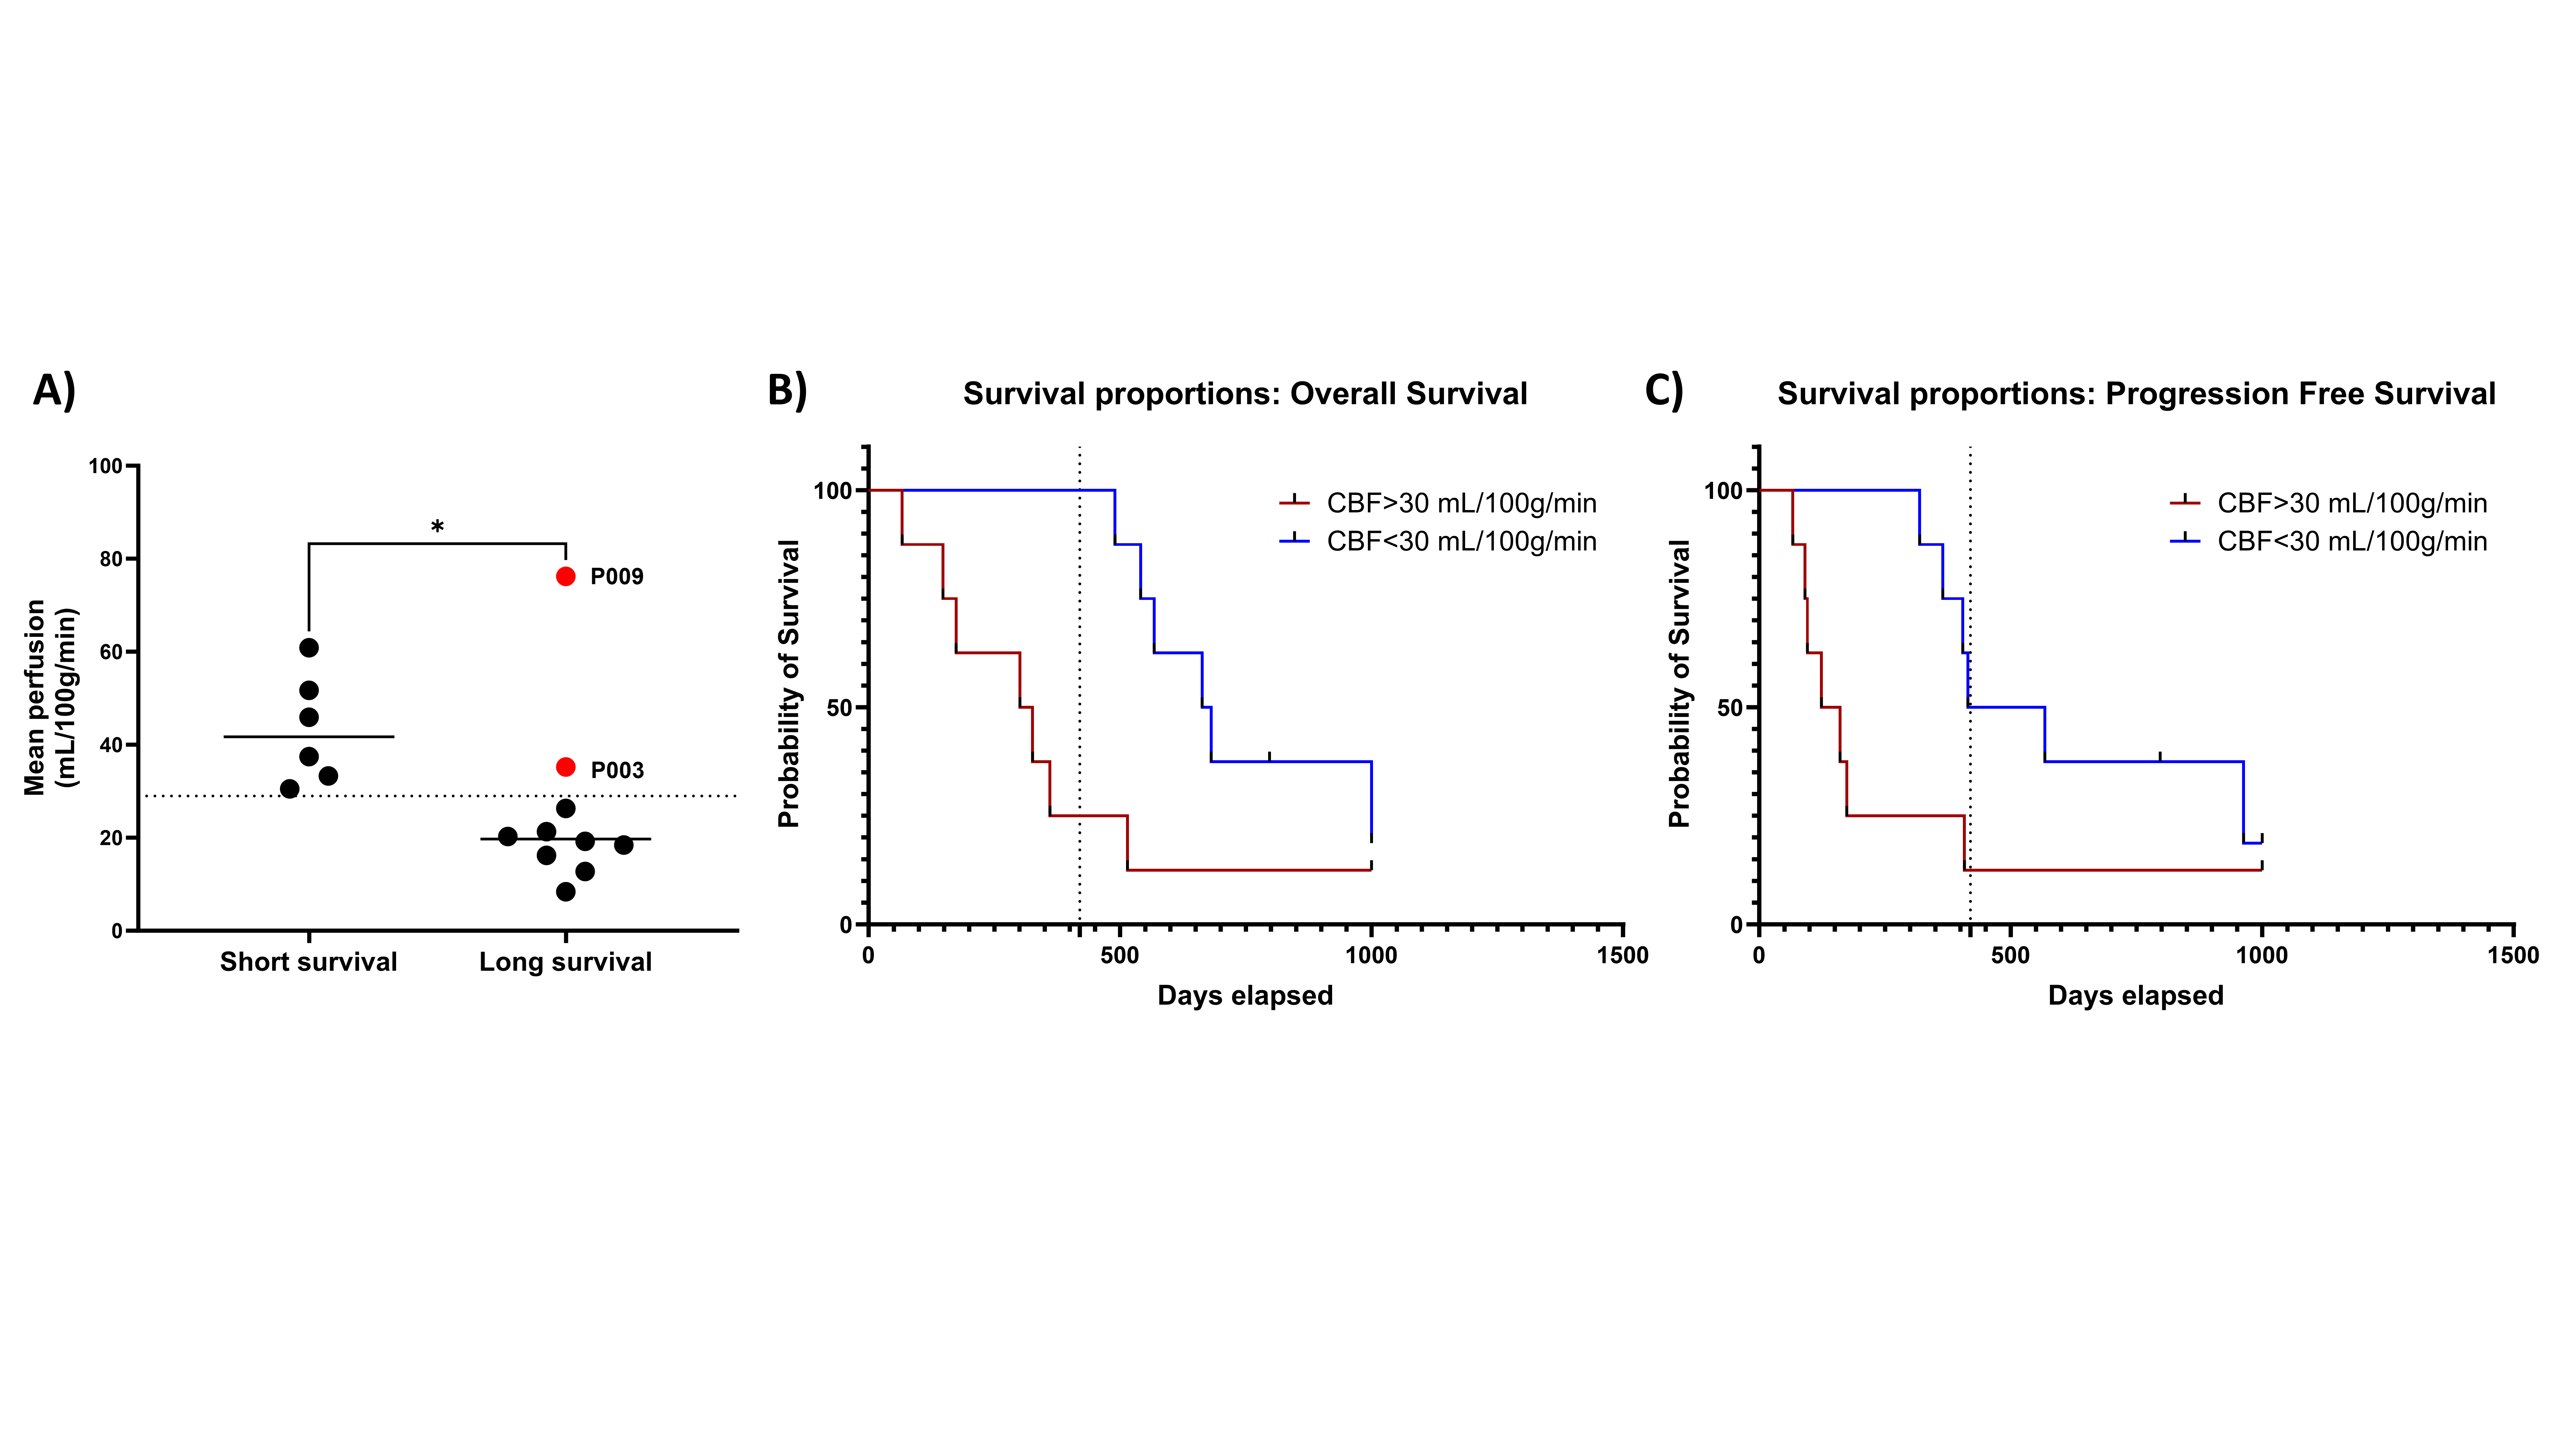
Among 23 enrolled patients, first 17 patients (13 men, 4 women) were included for this study with mean age of the 57 ± 14 years, ranging from 28 to 81 years. The overall survival (OS), progression-free survival (PFS), and mean CBF values within ET ROIs are provided in Table 1. Based on median survival of 420 days, OS and PFS were categorized into short (<= 420 days) or long (>420 days) survival. Two perfusion patterns were observed (Figure 2). ASL maps with hyper-perfusion (top row) were associated with shorter OS (148 days for this patient), while ASL maps with hypo-perfusion (bottom row) were associated with longer OS (797 days for this patient).Scatter plot of mean perfusion values between two survival groups showed similar results (Figure 3A). Higher perfusion values were observed in short survival group, compared to that of long survival group, with 30 mL/100g/min (dash line) as an optimal threshold to differentiate between these two survival groups. The Kaplan–Meier curves using this threshold were able to stratify OS (Figure 3B) and PFS (Figure 3C) between the two groups significantly (p< 0.015, Hazard ratio= 3.056).
Discussion
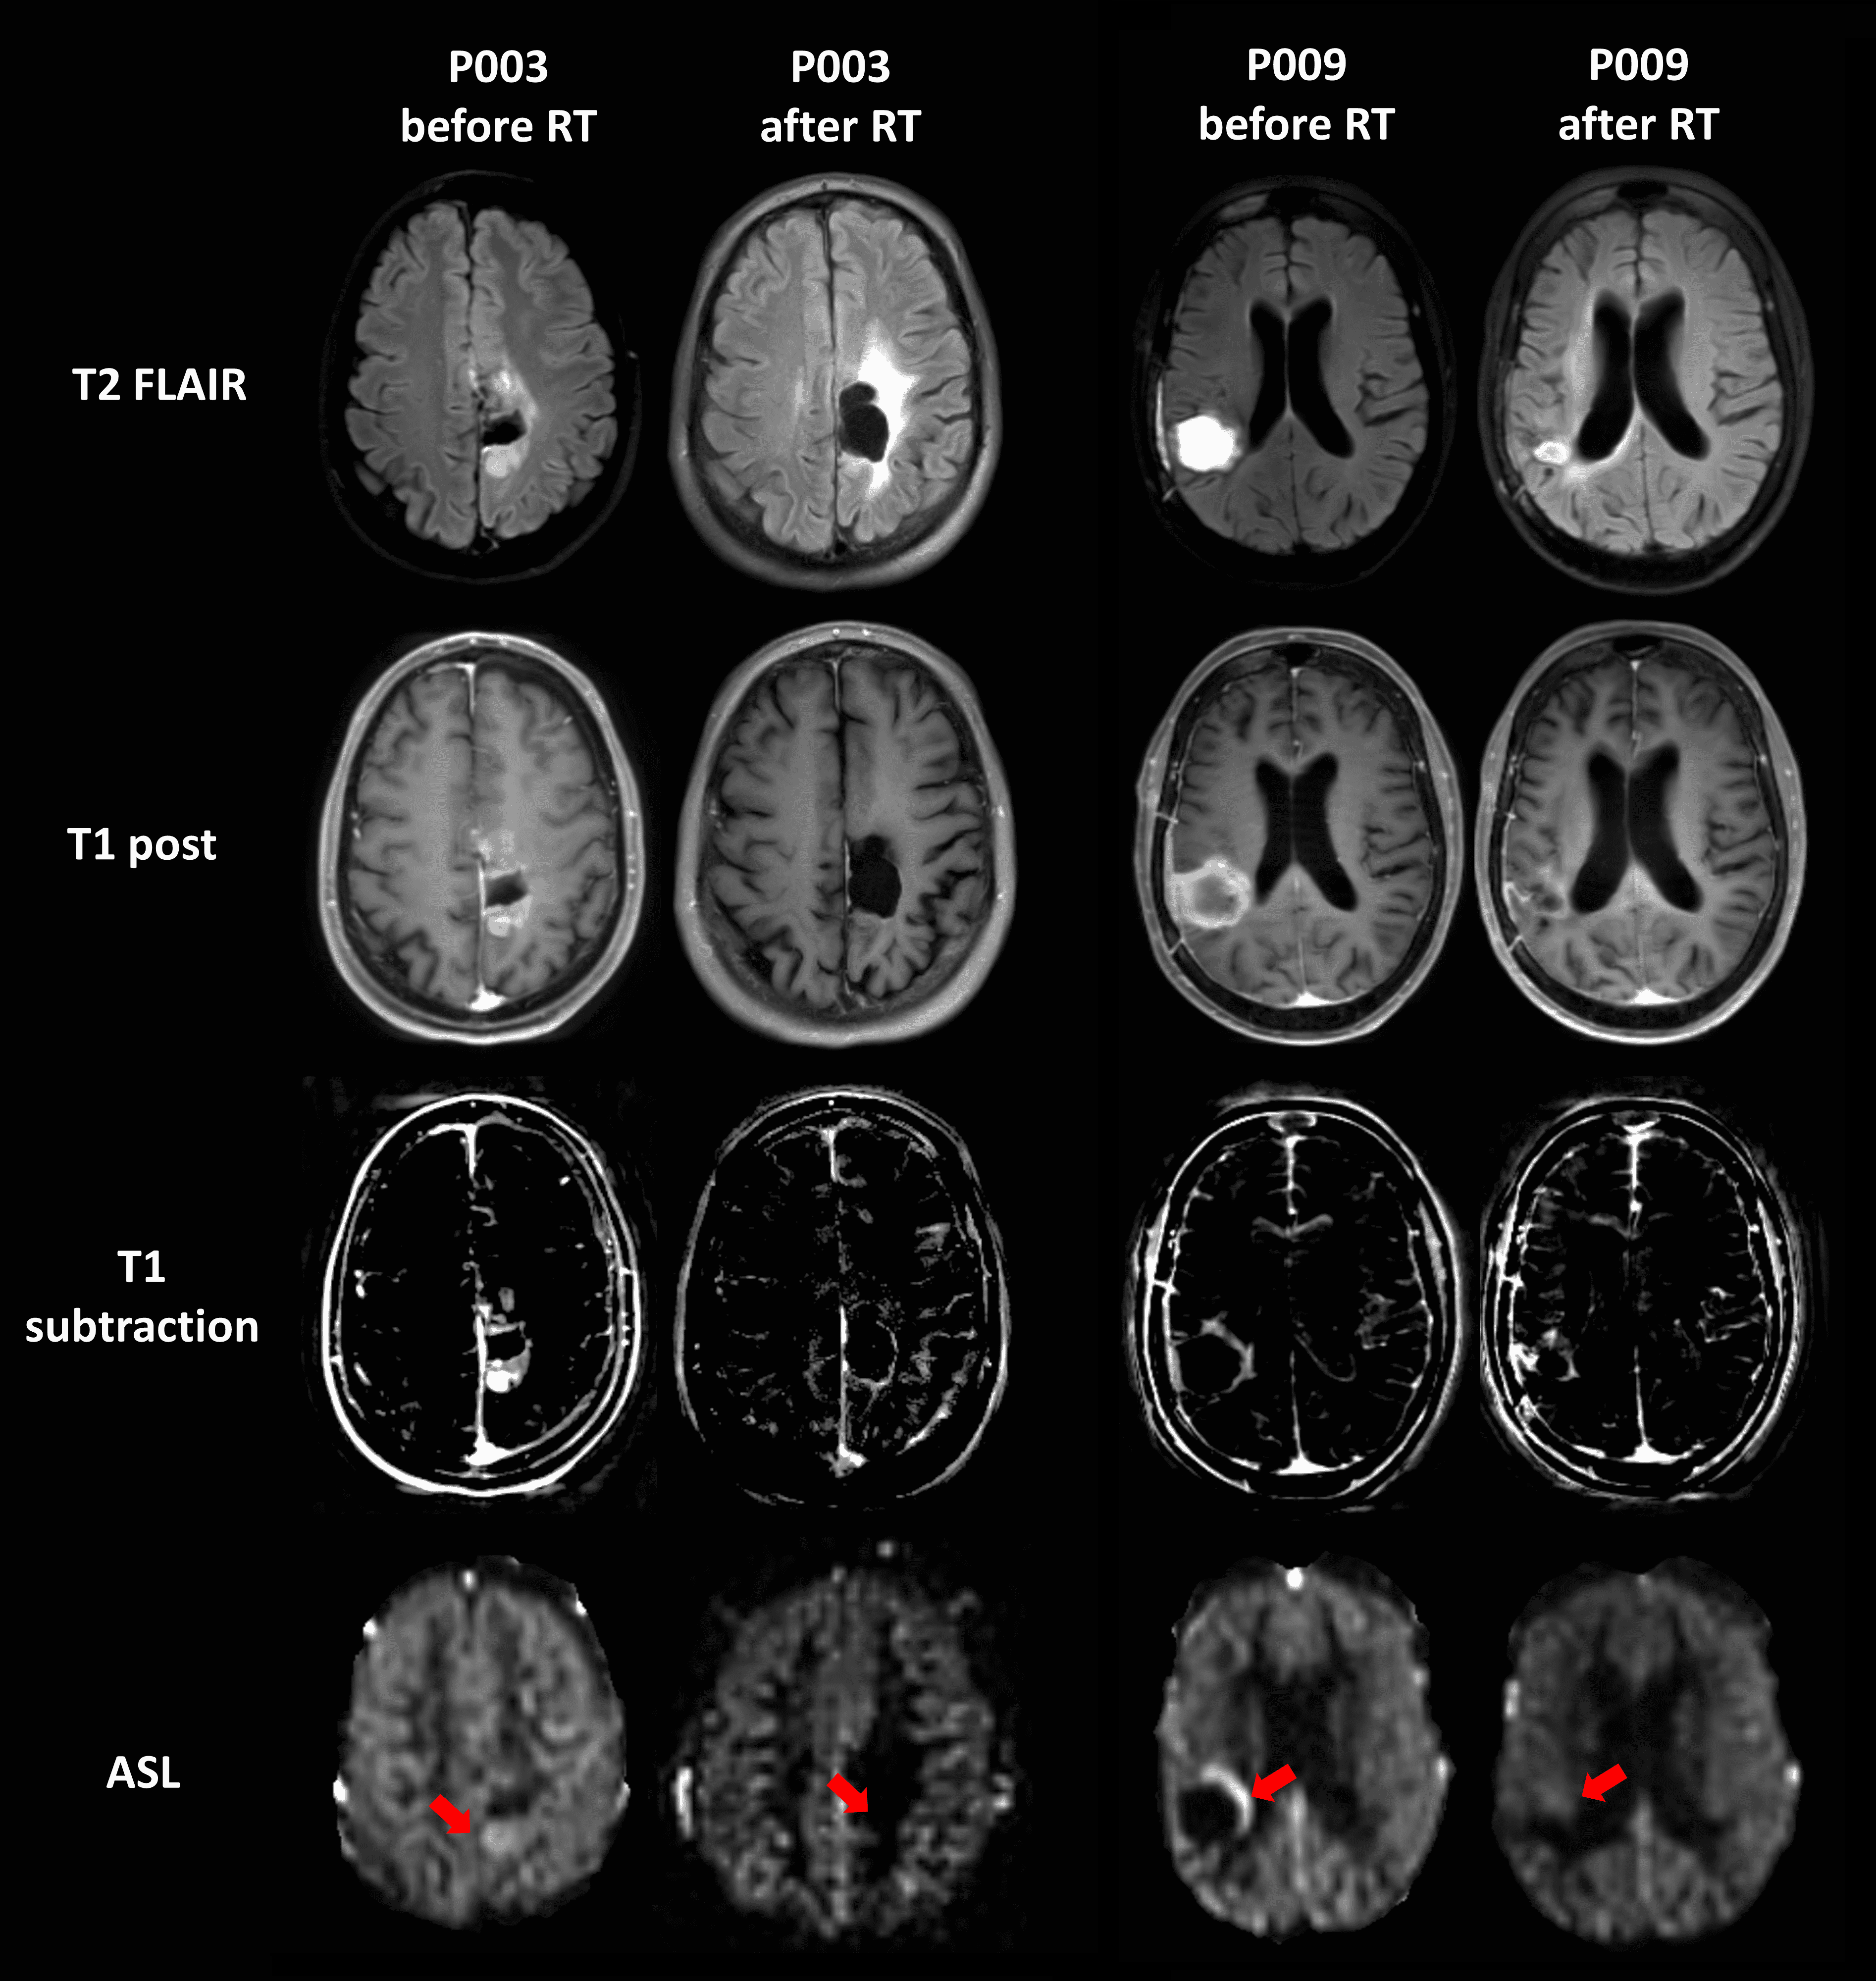
A single threshold of ASL measured quantitative perfusion value of 30 mL/100g/min stratified patient survival, however, was not able to differentiate the two groups entirely (e.g., Fig. 3A). However, incorporation of longitudinal imaging provided additional information to substantiate exceptions. For example in in patients P003 and P009 (Figure 4), despite high baseline perfusion, both patients showed a favorable response to treatment with decreased enhancement and perfusion values. Patient P003 exhibited a complete response with hypo-perfusion, correlating with longer survival (>1000 days), while patient P009 had a partial response with slight hyper-perfusion after CRT, and shorter survival (515 days). These findings underscore the potential of perfusion metrics as prognostic indicators in the context of therapeutic response and survival in GBM.Conclusion
ASL measured baseline perfusion, after surgery and before radiation treatment, can aid in survival prediction and stratification in glioblastoma patients.Acknowledgements
This work was supported by NIH/NCI grant U01CA207091. The authors would like to thank all patients for their invaluable participation in this study. The authors also thank Abey Thomas, RT(MR), Courtney Dawson, RT(MR), Michael Fulkerson, AS, LVN, and Camille Harry, for their help in human imaging, and Ben Wagner, MSEE, for his help with image database and analysis routines.
References
1. Hu, L.S., et al., Correlations between perfusion MR imaging cerebral blood volume, microvessel quantification, and clinical outcome using stereotactic analysis in recurrent high-grade glioma. AJNR Am J Neuroradiol, 2012. 33(1): p. 69-76.
2. Law, M., et al., Glioma grading: sensitivity, specificity, and predictive values of perfusion MR imaging and proton MR spectroscopic imaging compared with conventional MR imaging. AJNR Am J Neuroradiol, 2003. 24(10): p. 1989-98.
3. Law, M., et al., Gliomas: predicting time to progression or survival with cerebral blood volume measurements at dynamic susceptibility-weighted contrast-enhanced perfusion MR imaging. Radiology, 2008. 247(2): p. 490-8.
4. Jain, R., et al., Outcome prediction in patients with glioblastoma by using imaging, clinical, and genomic biomarkers: focus on the nonenhancing component of the tumor. Radiology, 2014. 272(2): p. 484-93.
5. Qiao, X.J., et al., Arterial spin-labeling perfusion MRI stratifies progression-free survival and correlates with epidermal growth factor receptor status in glioblastoma. AJNR Am J Neuroradiol, 2015. 36(4): p. 672-7.
6. Yoo, R.E., et al., Arterial spin labeling perfusion-weighted imaging aids in prediction of molecular biomarkers and survival in glioblastomas. Eur Radiol, 2020. 30(2): p. 1202-1211.
7. Ellingson, B.M., et al., Consensus recommendations for a standardized Brain Tumor Imaging Protocol in clinical trials. Neuro Oncol, 2015. 17(9): p. 1188-98.
8. Greer, J.S., et al., Robust pCASL perfusion imaging using a 3D Cartesian acquisition with spiral profile reordering (CASPR). Magn Reson Med, 2019. 82(5): p. 1713-1724.
9. Alsop, D.C., et al., Recommended Implementation of Arterial Spin-Labeled Perfusion MRI for Clinical Applications: A Consensus of the ISMRM Perfusion Study Group and the European Consortium for ASL in Dementia. Magnetic Resonance in Medicine, 2015. 73(1): p. 102-116.
Figures
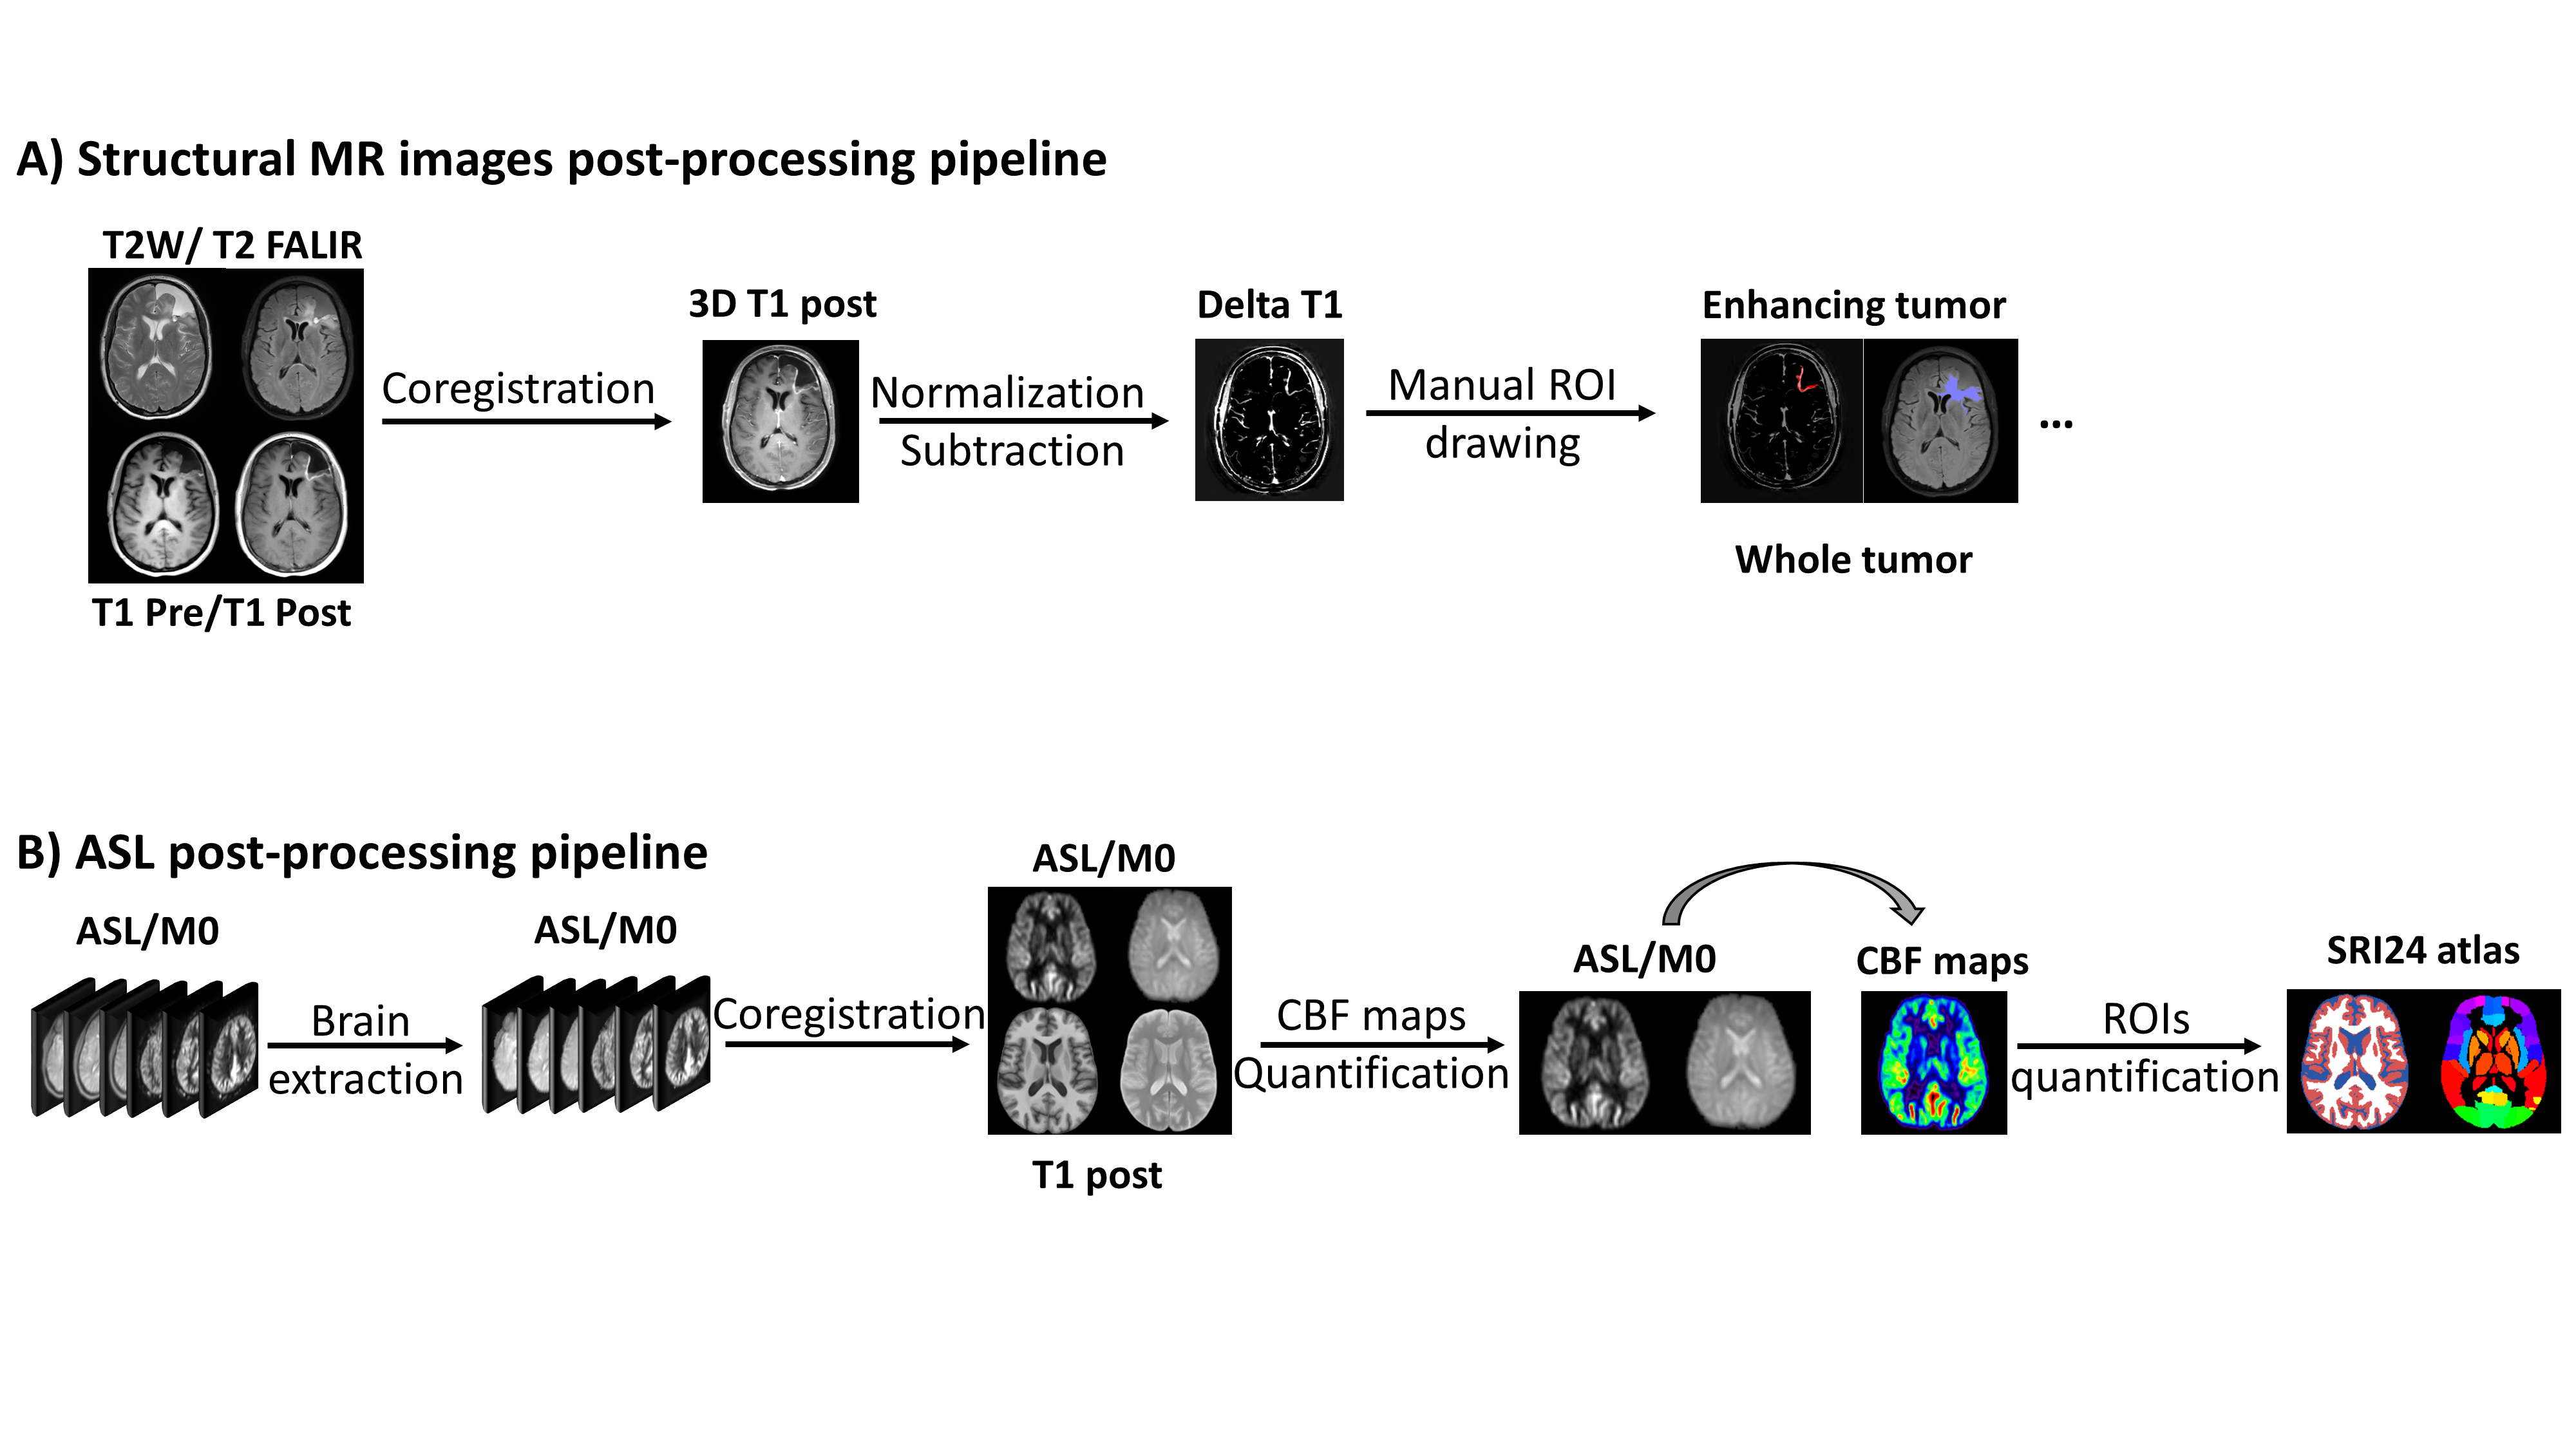
Figure 1: Post-processing pipelines for baseline MR scans in patients with glioblastoma. (A) All structural MR images were co-registered to T1 post contrast images and manual ROIs related to tumor were drawn by an experienced neuroradiologist (M.P.) for analysis. (B) ASL post-processing pipeline included skull stripping, co-registration, cerebral blood flow (CBF) quantification and mean perfusion value extraction.
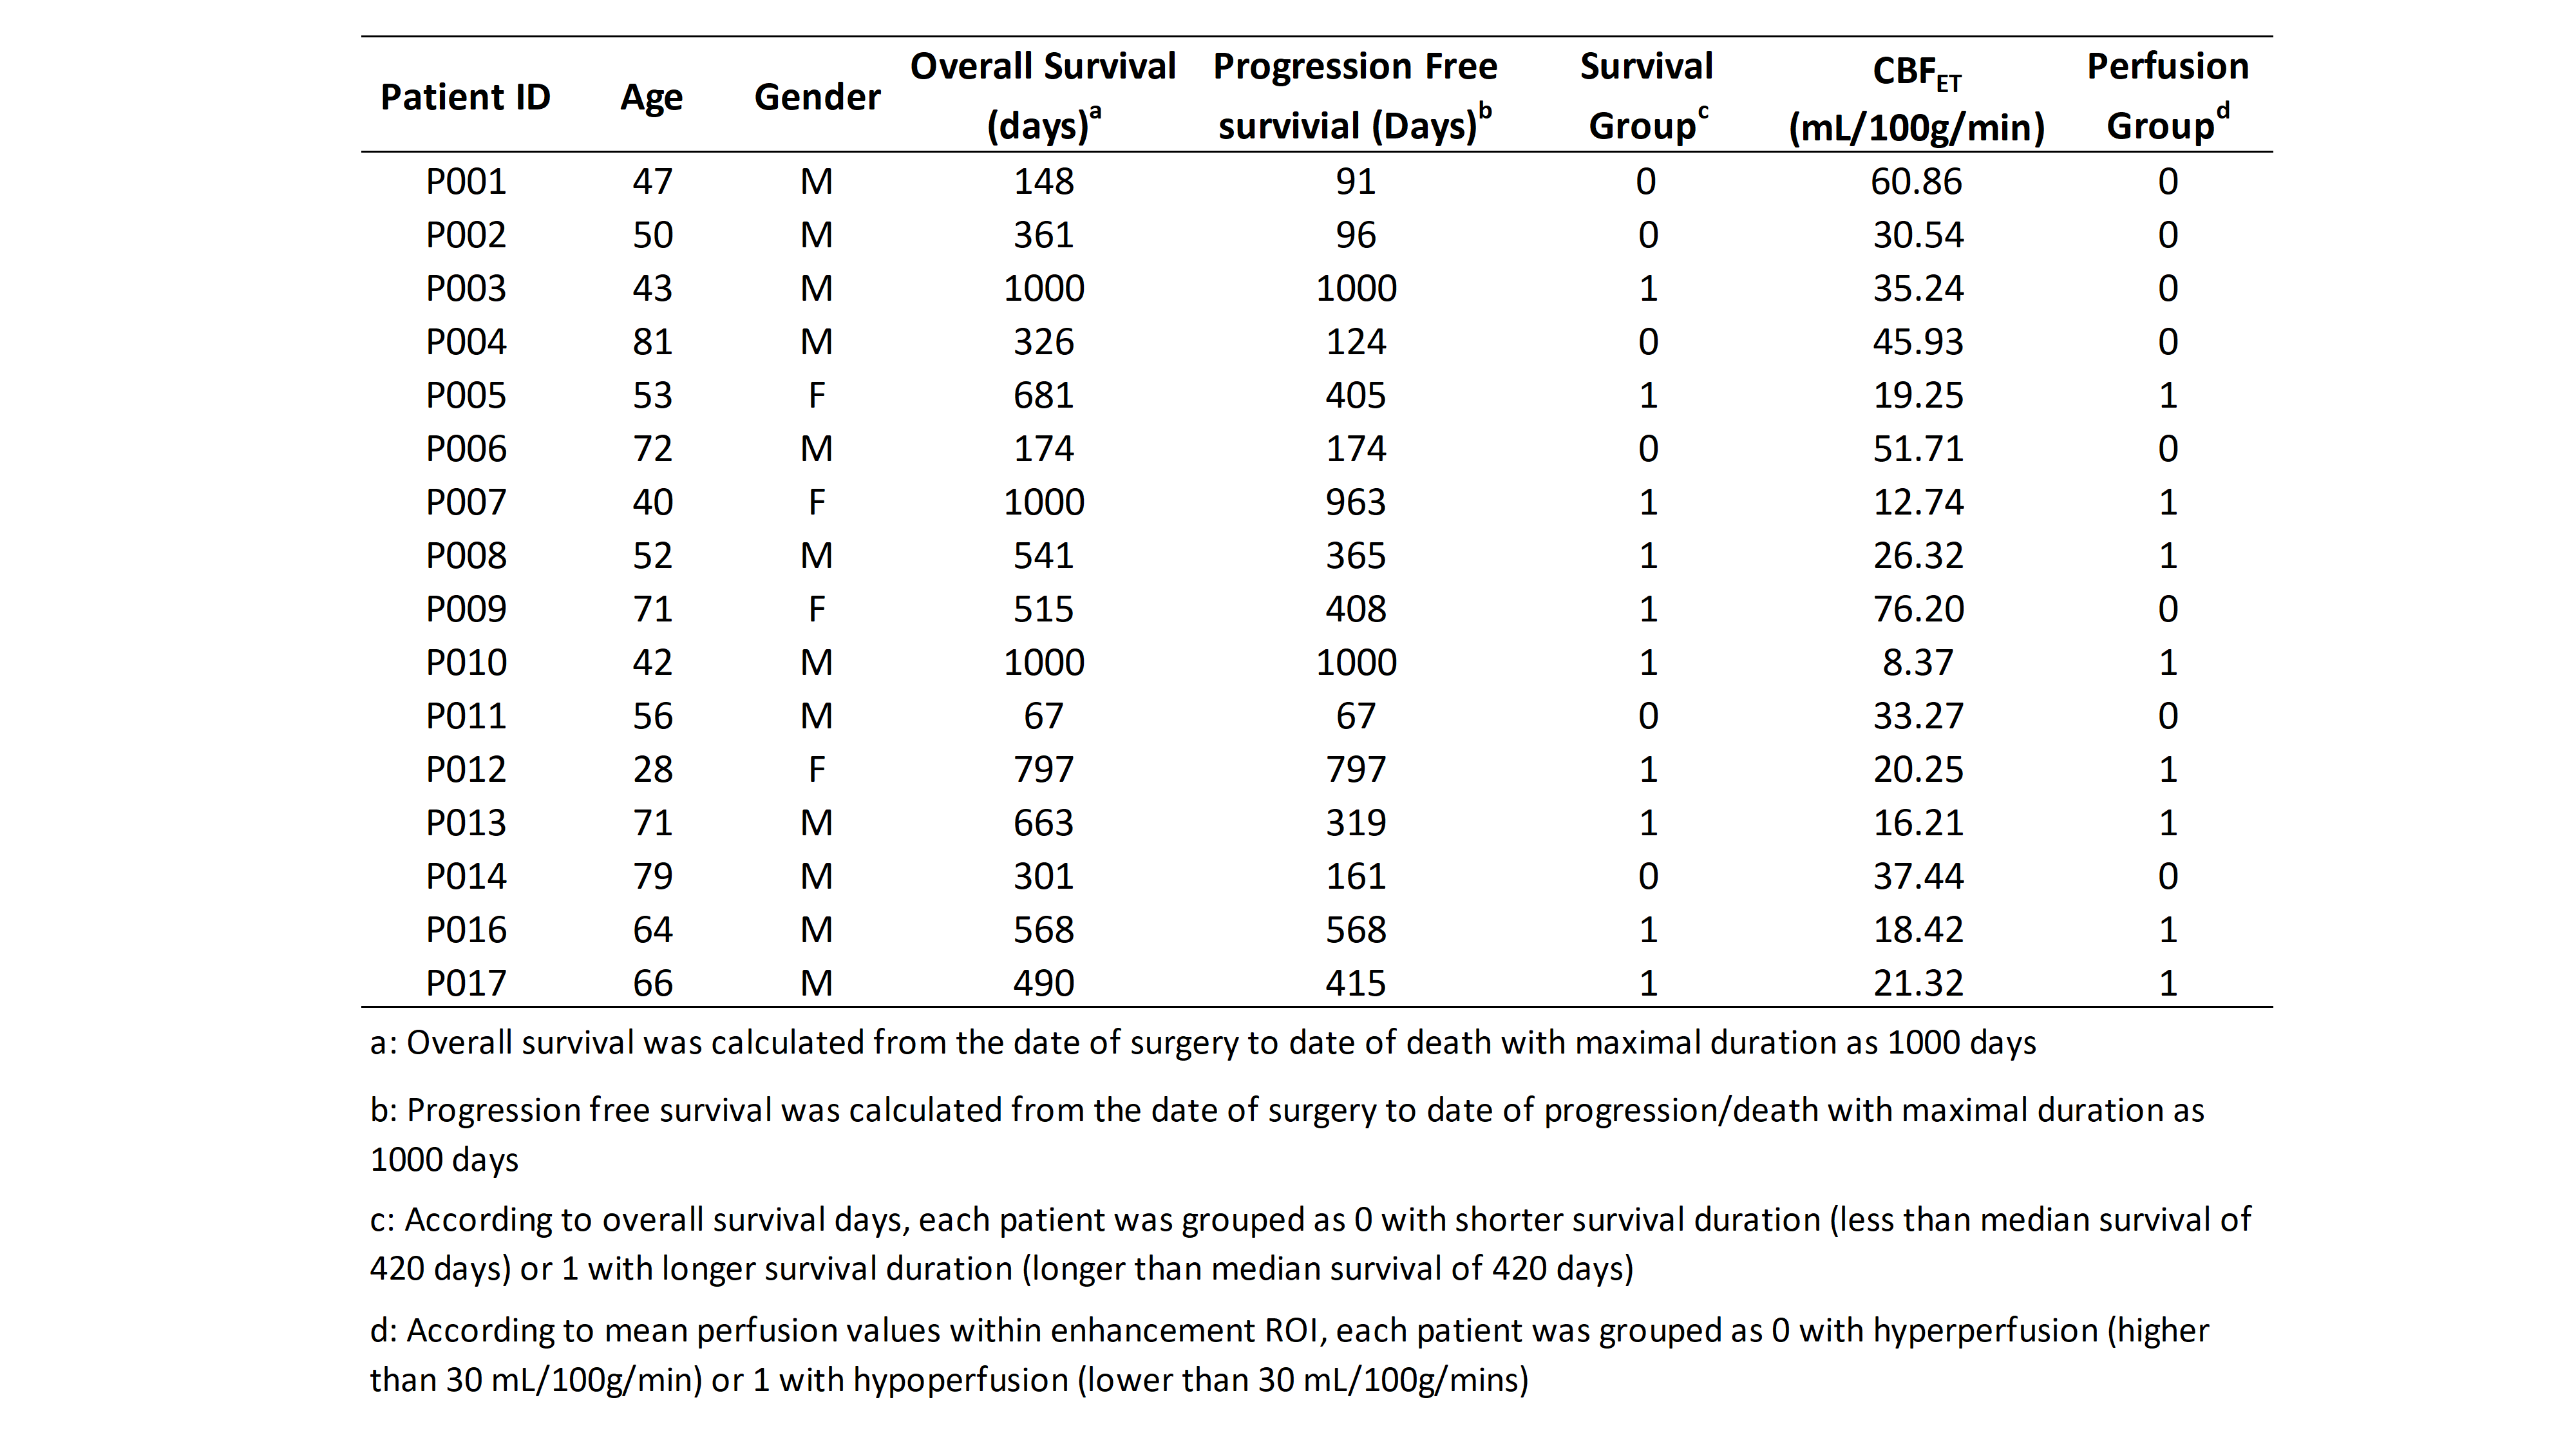
Table 1: Patient demographics including age, gender, survival, mean perfusion values within enhancing tumor (ET) ROIs and corresponding categorized groups by either survival or perfusion values. Note that two patients (P003 and p009) had higher perfusion (>30 mL/100g/min) and longer survival (>420 days) and hence are mismatched between categorized survival group and perfusion group.
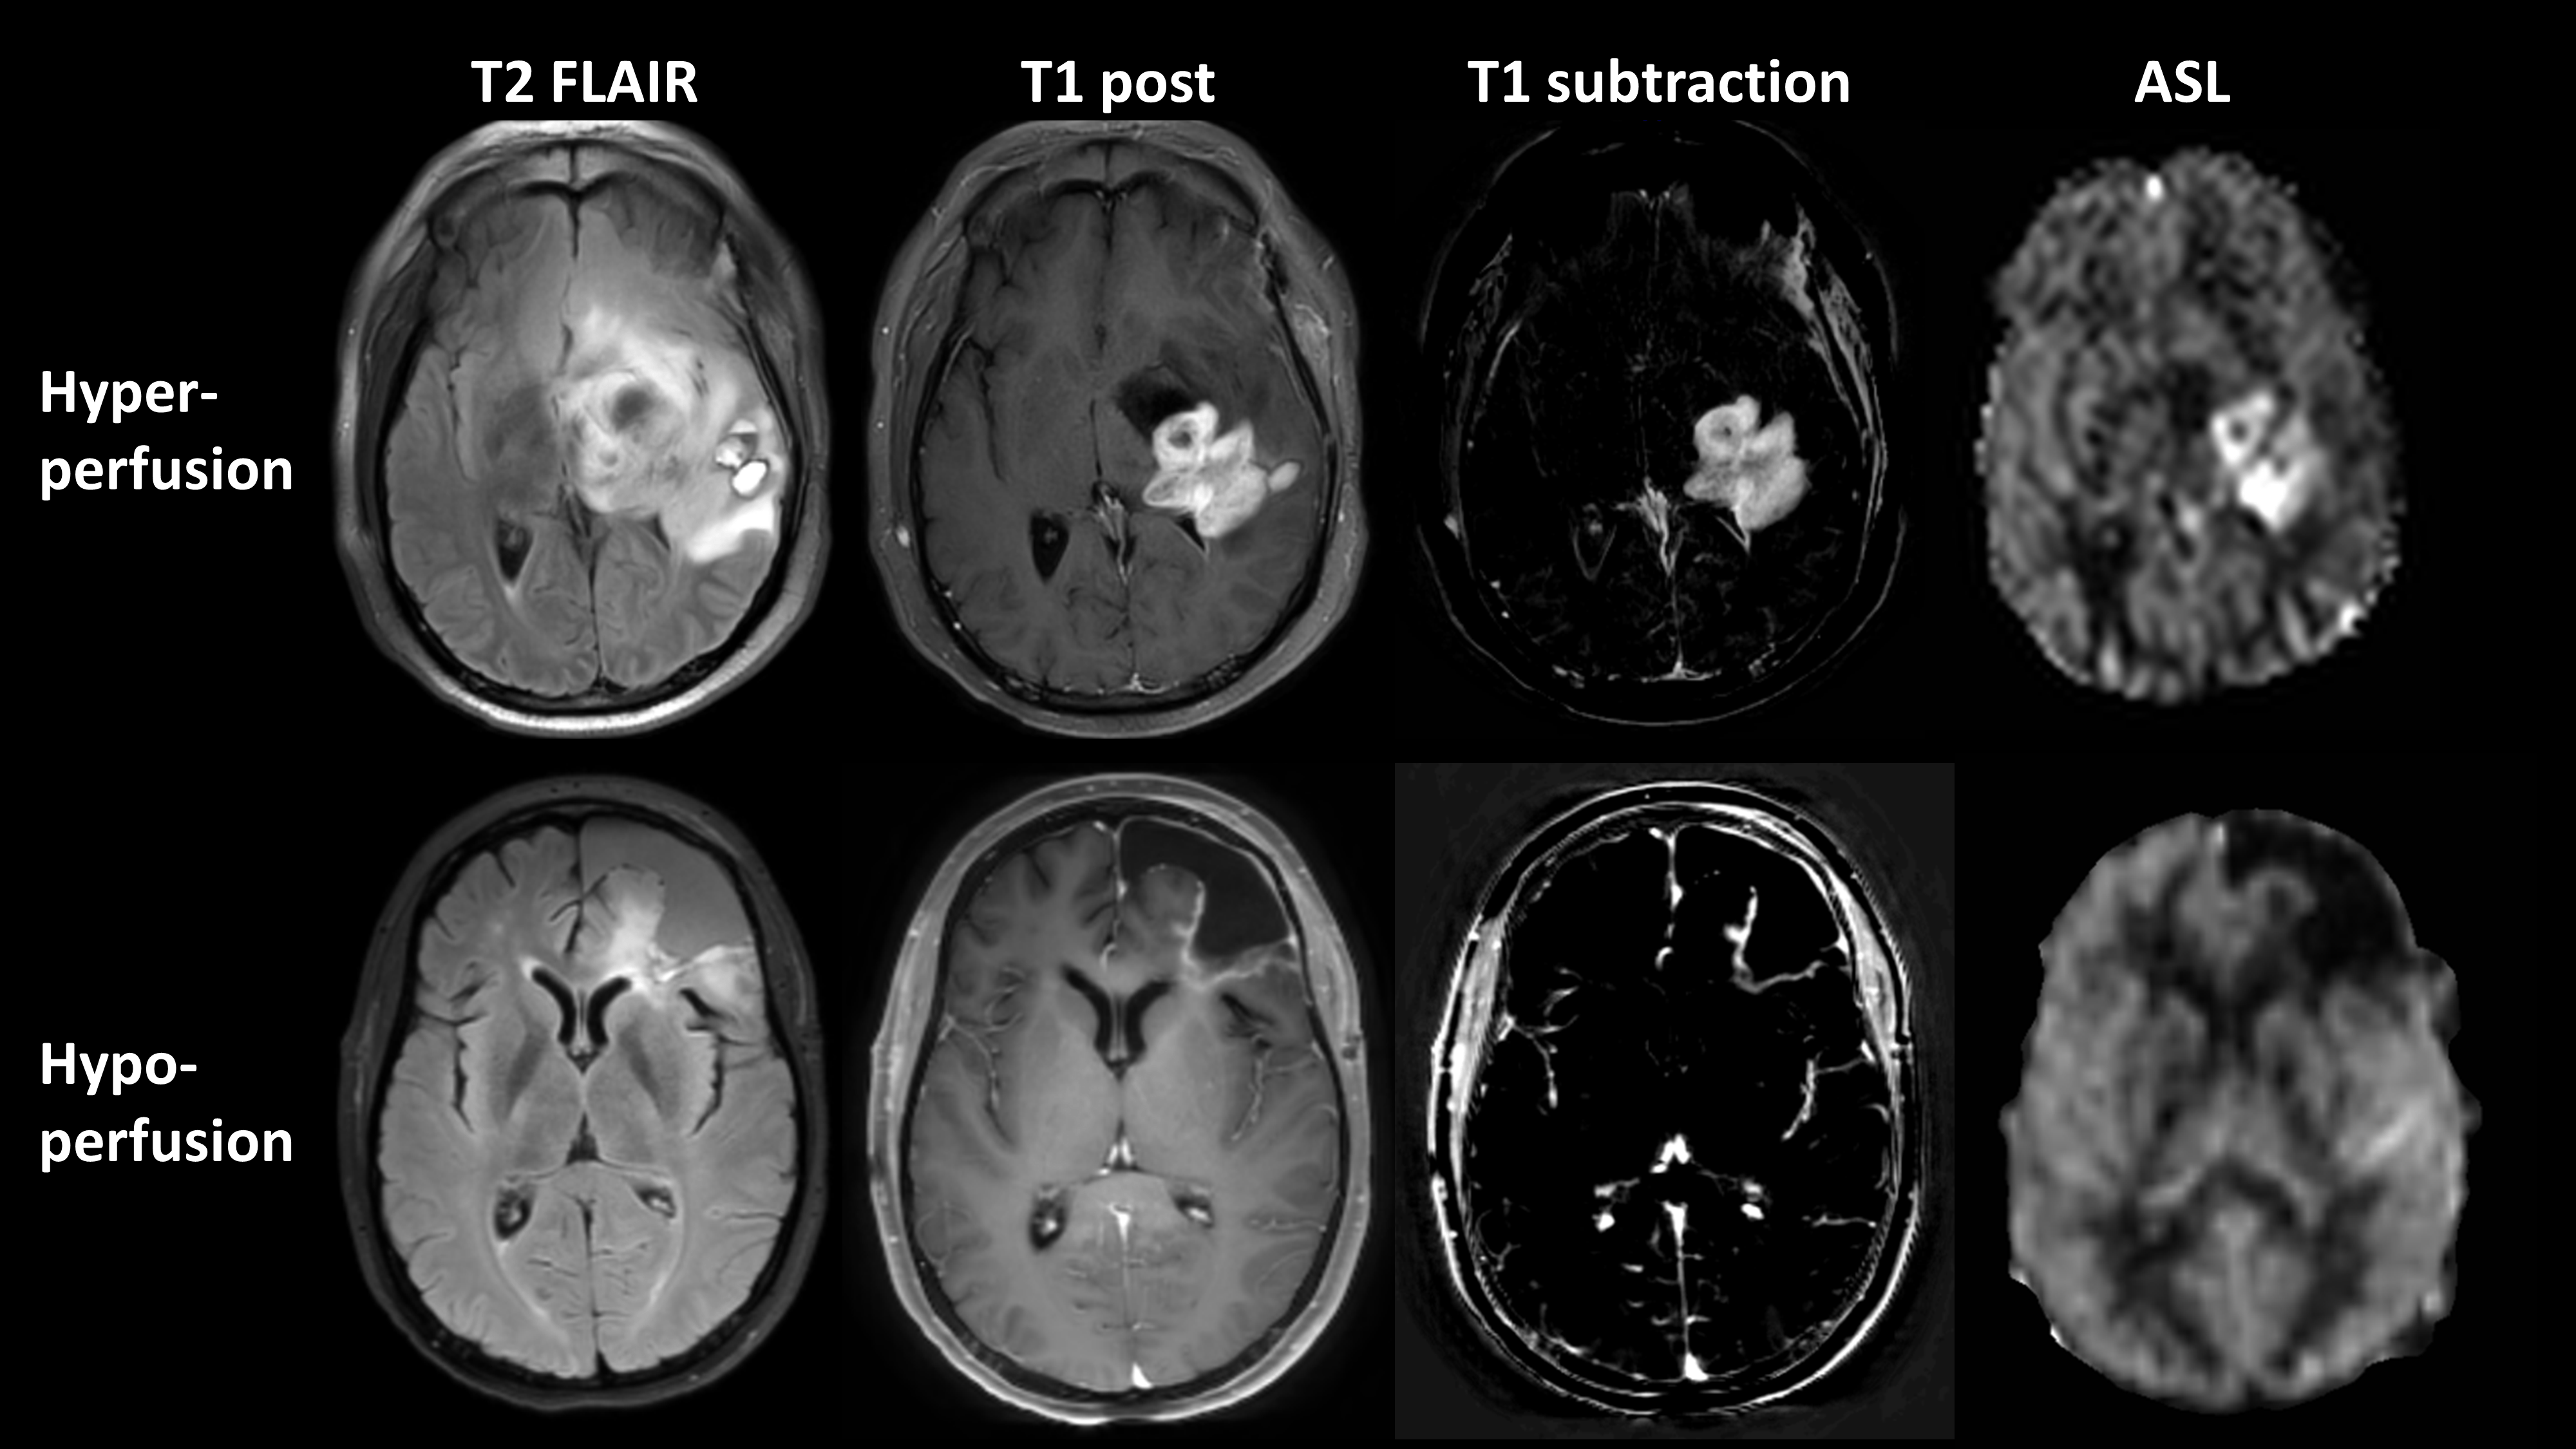
Figure 2: Representative slices of two different patterns (hyper-perfusion and hypo-perfusion) for quantitative ASL CBF maps along with structural MR images. Top row: 47-year old GBM patient (P001) with hyper-perfusion and shorter overall survival of 148 days. Bottom row: 28-year old GBM patient (P012) with hypo-perfusion and longer overall survival of 797 days. ASL CBF maps were displayed with an intensity range of 0 to 100 mL/min/100g.