3847
The Value of CEST MRI of Peritumoral Regions in Post-Therapy Malignant Glioma Assessment1Department of Computer Science, Johns Hopkins University, Baltimore, MD, United States, 2Department of Radiology, Johns Hopkins University, Baltimore, MD, United States, 3Department of Electrical and Computer Engineering, Johns Hopkins University, Baltimore, MD, United States, 4Department of Data Science, Johns Hopkins University, Baltimore, MD, United States, 5Department of Biomedical Engineering, Johns Hopkins University, Baltimore, MD, United States
Synopsis
Keywords: Tumors (Post-Treatment), CEST & MT
Motivation: Monitoring post-chemoradiotherapy malignant gliomas is a persistent challenge in neuro-oncology. The peritumoral region, closely related to tumor recurrence, has been infrequently examined in the imaging pattens and the potential mechanism.
Goal(s): Our objective was to explore whether CEST MRI could distinguish tumor recurrence from treatment effects and uncover potential mechanisms behind high-grade gliomas' invasive behavior.
Approach: We investigated the CEST effects at 3.5ppm and 2.0ppm, as well as T1 and T2 values from the peritumoral regions of malignant gliomas with histogram analysis.
Results: Significant higher CEST effects across chemical shift offsets were presented in peritumoral regions in recurrent tumor compared with treatment effects.
Impact: The different progressive patterns in peritumoral regions between treatment effects and tumor recurrence are assessable by CEST MRI. It provides a potential imaging maker matrix to unveil the mechanism of invasive behavior of malignant gliomas.
Introduction
Glioblastoma and anaplastic astrocytoma are the most dismal primary brain tumors in adults. Peritumoral edema region (PER) promotes the diffusion of glioma cells into neighboring brain tissues. Despite their criticality, the PER—known to be highly aggressive in post-therapy malignant gliomas—has received minimal attention in research. Chemical exchange saturation transfer (CEST) MRI is a promising molecular imaging tool that allows the specific detection of metabolites that contain exchangeable protons. Amide proton transfer-weighted (APTw) MRI, targeting the CEST effect of mobile proteins and peptides at 3.5ppm,1-4 and the CEST effect at 2ppm (CEST@2ppm), likely correlating with creatine and guanidinium protons,5 are increasingly implemented in translational studies. In our study, we analyze APTw and CEST@2ppm, as well as T1 and T2 values extracted in PER. Our objective is to investigate whether CEST MRI is capable of providing any distinguishable patterns regarding tumor recurrence vs. treatment effect and to unveil the underlaying mechanism of maliciously invasive behavior of high-grade gliomas.Methods
Patients enrollmentThe study included a dataset comprising 48 scans collected from a total of 46 patients. Each patient had all study-related MRI data after their standard chemoradiation regimen completion. Patients were diagnosed as tumor recurrence vs. treatment effects based on histopathologic diagnosis or the longitudinal MRI analysis according to the updated RANO criteria.6
MRI protocol
All patients were scanned on a Philips 3T Achieva MRI system. The sequences performed for each patient included T1 mapping; T2 mapping; FLAIR; and Gd-T1w. A 3D imaging acquisition scheme was used for volumetric APTw imaging (saturation power = 2 μT; saturation time = 2s).
Data postprocessing
CEST@2ppm images were generated by calculating the magnetization transfer ratio asymmetry (MTR) at an offset of 2ppm from the water frequency. To ensure consistency, both the T1 and T2 maps, APTw, and CEST@2ppm MRI data were uniformly rescaled and aligned through a co-registration process. A researcher manually annotated the peritumoral zones characterized by abnormal FLAIR/T2-weighted signal intensities surrounding gadolinium-enhanced tumor core. Subsequently, for each scan, the region of interest (ROI) of PER is determined by intersecting the peritumoral mask with a 5-pixel expanded zone around the gadolinium-enhanced tumor core. The Z-spectra and MTRasym spectra were plotted and analyzed from two groups, separately.
Statistical analysis
The histogram method was utilized to derive features from the ROI, including mean, mode, kurtosis, skewness, peak values, and percentiles. The differentiation capabilities of these advanced MRI parameters were studied using the U test and receiver operating characteristic (ROC) analysis. Parameters that achieved statistical significance (P<0.05) were then used to construct and train multivariate logistic regression models. 5-fold evaluation method was used with the aim of assessing the efficacy of combined MR images.
Results and Discussion
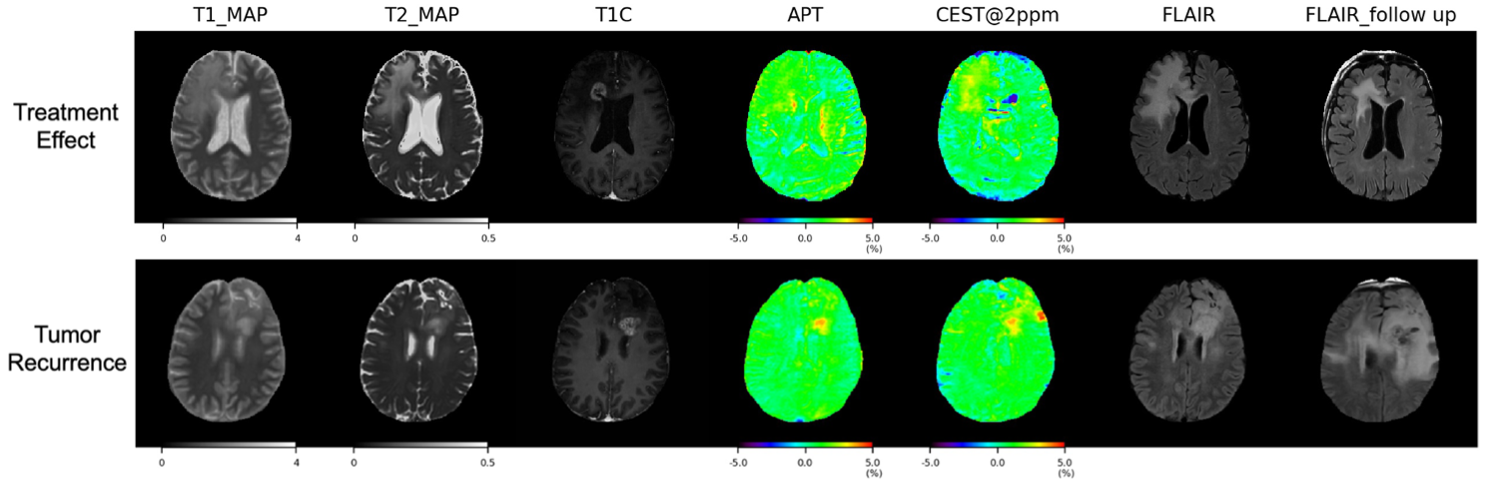
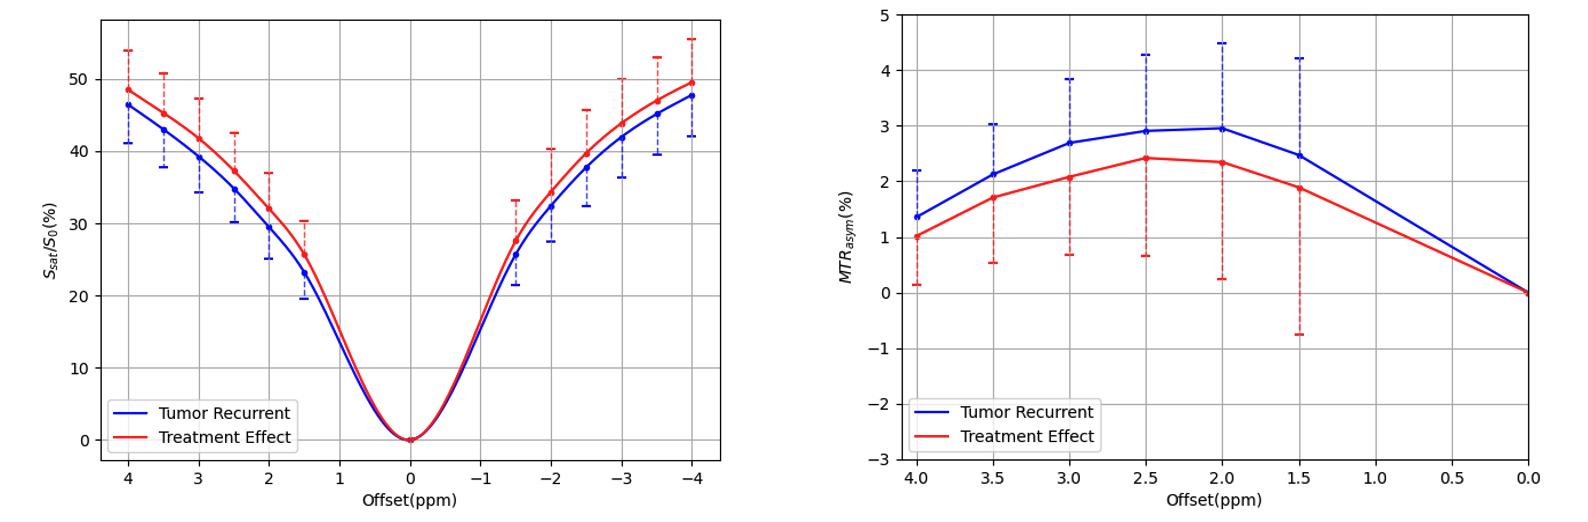
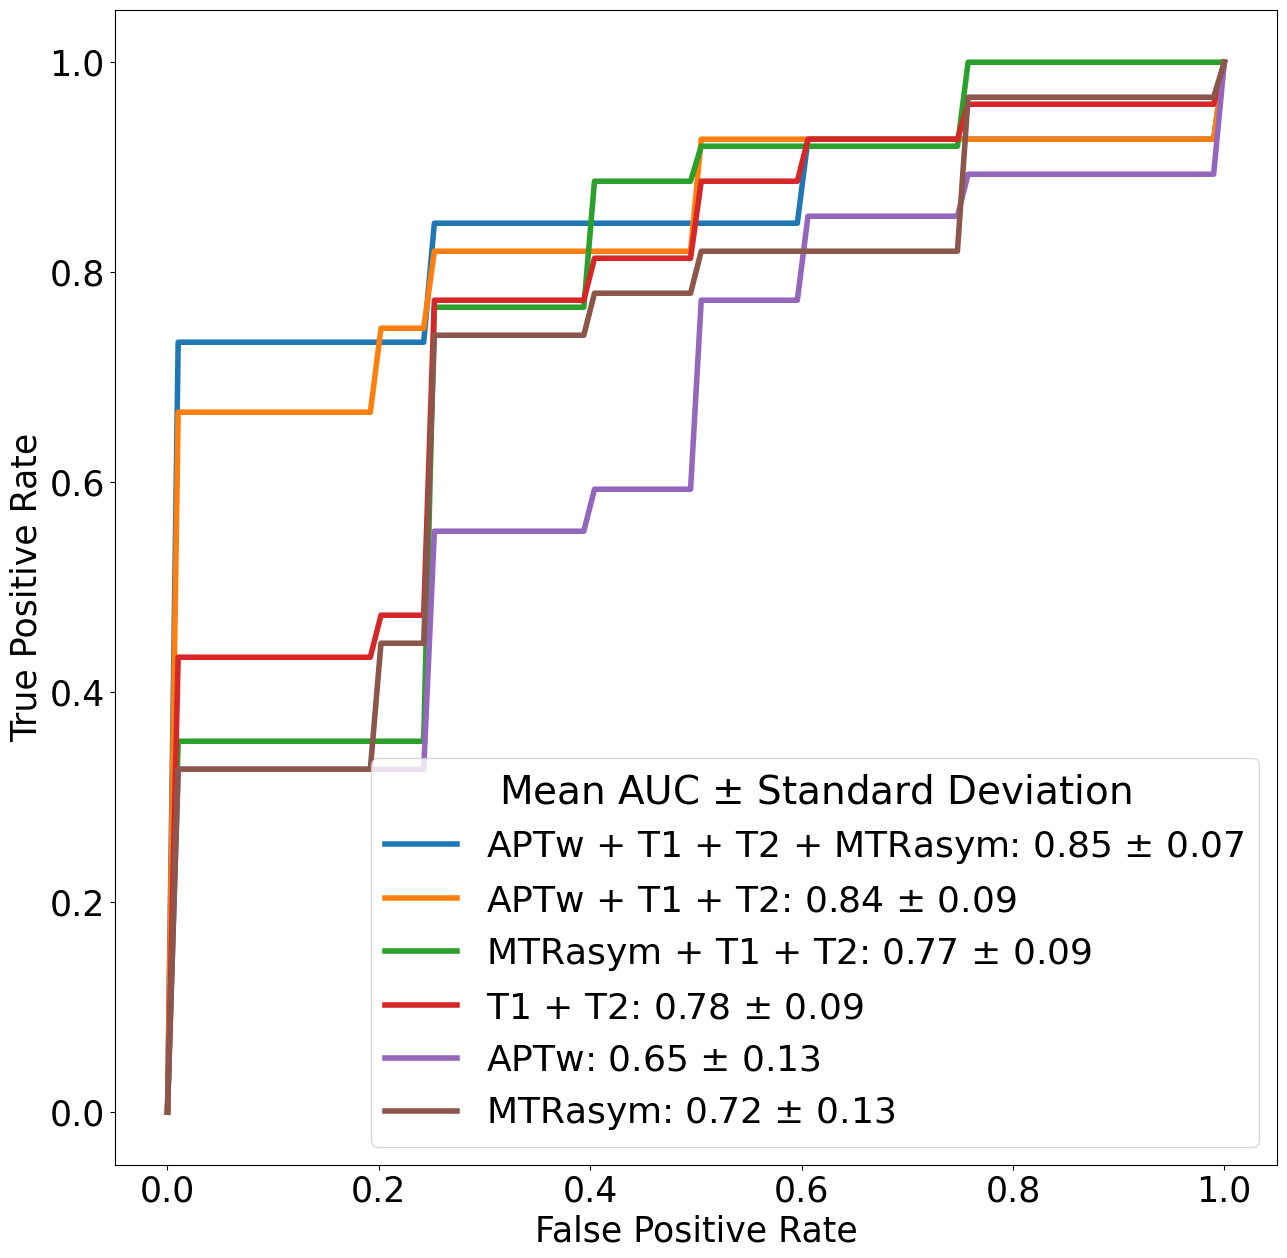
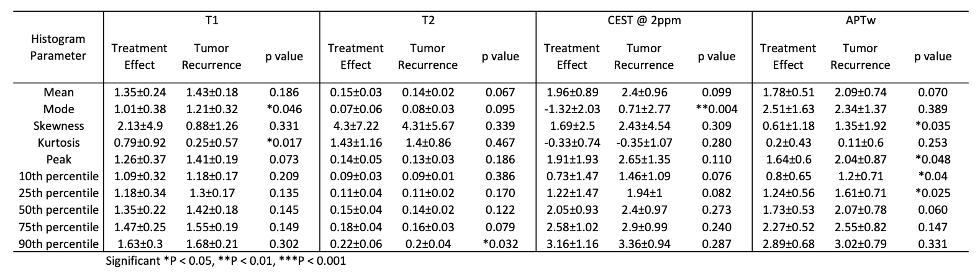
20 scans were confirmed as treatment effects from 19 patients (Fig. 1a), and 28 scans were tumor recurrence from 27 patients (Fig. 1b). Within the treatment effects group (12 male, 7 female), 8 patients were anaplastic astrocytoma, and 11 patients were glioblastoma. In the tumor recurrence group (17 male, 10 female), seven patients had anaplastic astrocytoma, and 20 patients had glioblastoma. The Z-spectra and MTRasym spectra (Fig. 2) exhibit distinct differences between treatment effects and tumor recurrence, with treatment effects showing higher Z-spectra and tumor recurrence demonstrating higher MTRasym values across chemical shift offsets. Some histogram parameters from T1, T2, CEST@2ppm, and APTw (Table 1) show a significant difference between the two groups especially mode value in CEST@2ppm, Kurtosis in T1, 25th percentile in APTw. The combination of APTw, T1 map, T2 map, and CEST@2ppm yields the highest differentiating performance with a mean AUC of 0.85 ± 0.07, indicating a strong predictive capability. Close to this, the APTw with T1 map and T2 map sequences also show a robust differentiating ability with a mean AUC of 0.84 ± 0.09 (Fig. 3). Combining the MR images, particularly APTw, T1 map, T2 map enhances the model's accuracy in distinguishing treatment effects from recurrent tumor presence. The invasive malignant tumor cells presenting higher active mitosis and anabolic reaction may give rise to higher signal intensities on APTw MRI, which creates imaging contrast predominantly influenced by the presence of proteins. Furthermore, it is reported that creatine promotes invasion and metastasis of multiple cancers.7 Our study found higher CEST@2ppm in recurrent tumors is consistent with the previous findings.Conclusion
APTw and CEST@2ppm MRI show that PER had higher CEST signal intensities in tumor recurrence than treatment treatments. It might be associated with higher protein concentrations from local invasive tumor cells and creatine which promote invasion in the PER.Acknowledgements
This work was supported in part by grants from the National Institutes of Health (R01CA228188, R01CA276221, and R37CA248077).References
1 Jiang, S. et al. Identifying recurrent malignant glioma after treatment using amide proton transfer-weighted MR imaging: A validation study with image-guided stereotactic biopsy. Clin. Cancer Res., doi: 10.1158/1078-0432.CCR-1118-1233 (2018).
2 Park, J. E. et al. Amide proton transfer imaging seems to provide higher diagnostic performance in post-treatment high-grade gliomas than methionine positron emission tomography. Eur Radiol 28, 3285-3295 (2018).
3 Meissner, J. E. et al. Early response assessment of glioma patients to definitive chemoradiotherapy using chemical exchange saturation transfer imaging at 7 T. J Magn Reson Imaging 50, 1268-1277 (2019).
4 Ma, B. et al. Applying amide proton transfer-weighted MRI to distinguish pseudoprogression from true progression in malignant gliomas. J. Magn. Reson. Imaging 44, 456-462 (2016).
5. Cai, K., et al. CEST signal at 2ppm (CEST@2ppm) from Z-spectral fitting correlates with creatine distribution in brain tumor. NMR Biomed. 28, 1–8 (2015).
6 Eisele, S. C., Wen, P. Y. & Lee, E. Q. Assessment of brain tumor response: RANO and its offspring. Curr. Treat. Options Oncol. 17, 35 (2016).
7 Zhou, J. et al. Three-dimensional amide proton transfer MR imaging of gliomas: Initial experience and comparison with gadolinium enhancement. J. Magn. Reson. Imaging 38, 1119-1128 (2013).
Figures