3845
Comparing DSC-CBV, DSC-CBF and ASL for Detecting Residual and Recurrent Glioblastoma with Deep Learning and multishell Diffusion MRI1Laval University, Quebec City, QC, Canada, 2UCSD, San Diego, CA, United States, 3Cortechs.ai, San Diego, CA, United States, 4Pacific Neuroscience Institute, Santa Monica, CA, United States
Synopsis
Keywords: Tumors (Post-Treatment), Tumor
Motivation: Differentiating recurrent tumor from post-treatment changes is challenging in post-operative glioblastoma MRI.
Goal(s): To compare the performance of DSC-CBV, DSC-CBF, and ASL perfusion MRI to differentiate recurrent tumor from treatment-related changes using a Deep Learning segmentation model together with multishell Diffusion MRI.
Approach: 138 post-operative scans were manually segmented for enhancing and non-enhancing cellular tumor volume. A Deep Learning segmentation was trained to segment cellular tumor and then tested to differentiate recurring disease from post-treatment changes from the segmentations.
Results: DSC-CBV and DSC-CBF improved the detection of residual/recurrent cellular tumor with Deep Learning while ASL perfusion did not.
Impact: Our work re-demonstrates the importance of including a DSC perfusion method in clinical brain tumor MRI protocols.
Introduction
Multimodal MRI is used for the evaluation of tumor burden in glioblastoma (GBM) patients after surgical resection, radiation, and chemotherapy. Despite technological advances, it remains difficult to distinguish between residual/recurrent tumor and treatment-related changes.1 Perfusion MR methods can be used to better differentiate these two entities2. Here, we compared the performance of Dynamic Susceptibility Contrast Cerebral Blood Volume (DSC-CBV), DSC Cerebral Blood Flow (DSC-CBF) and Arterial Spin Labeling (ASL) perfusion MRI to differentiate recurrent tumor from treatment-related changes using a Deep Learning segmentation model in post-operative glioblastoma MRI.Methods
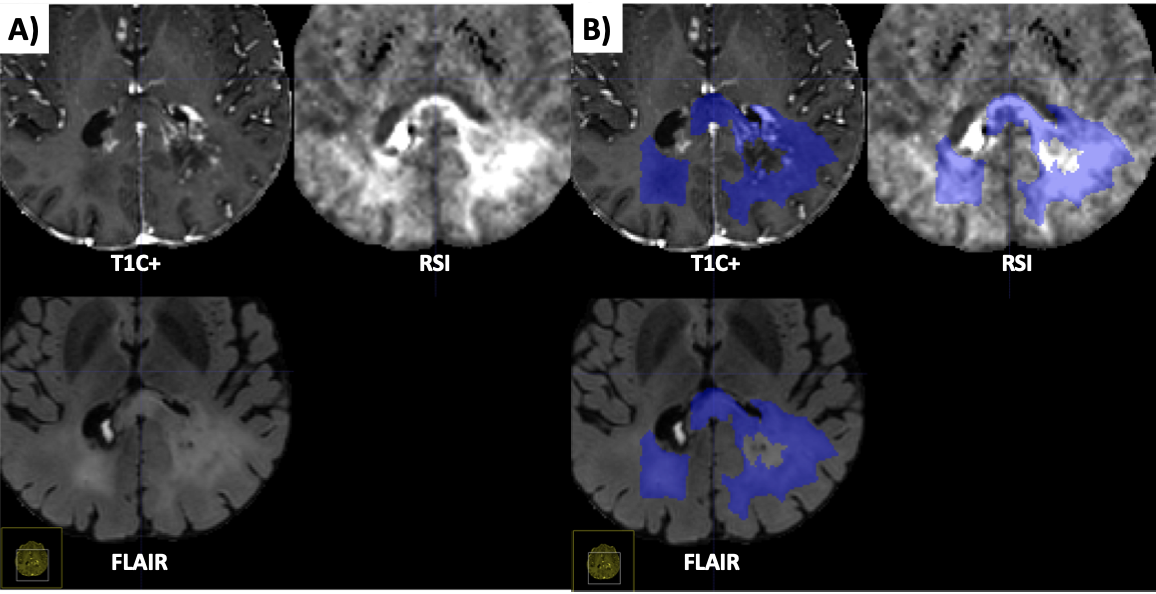
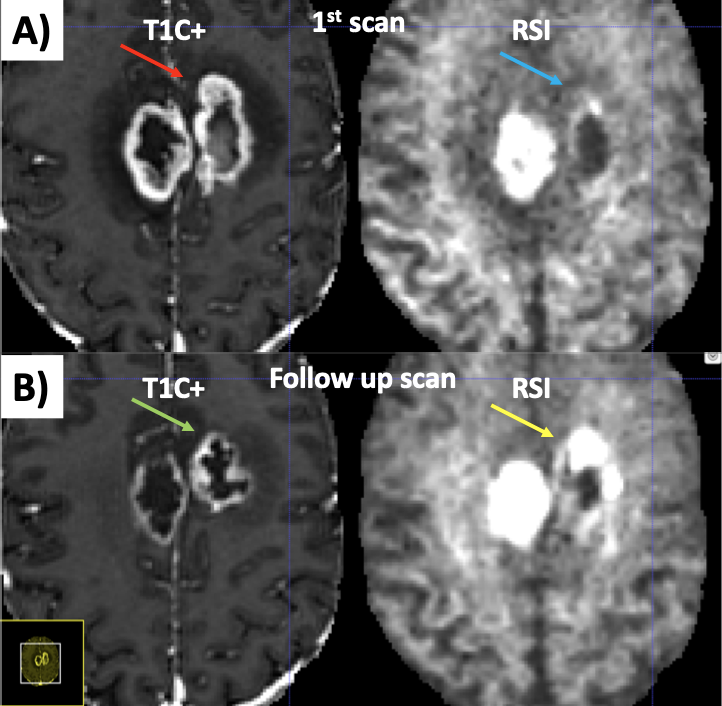
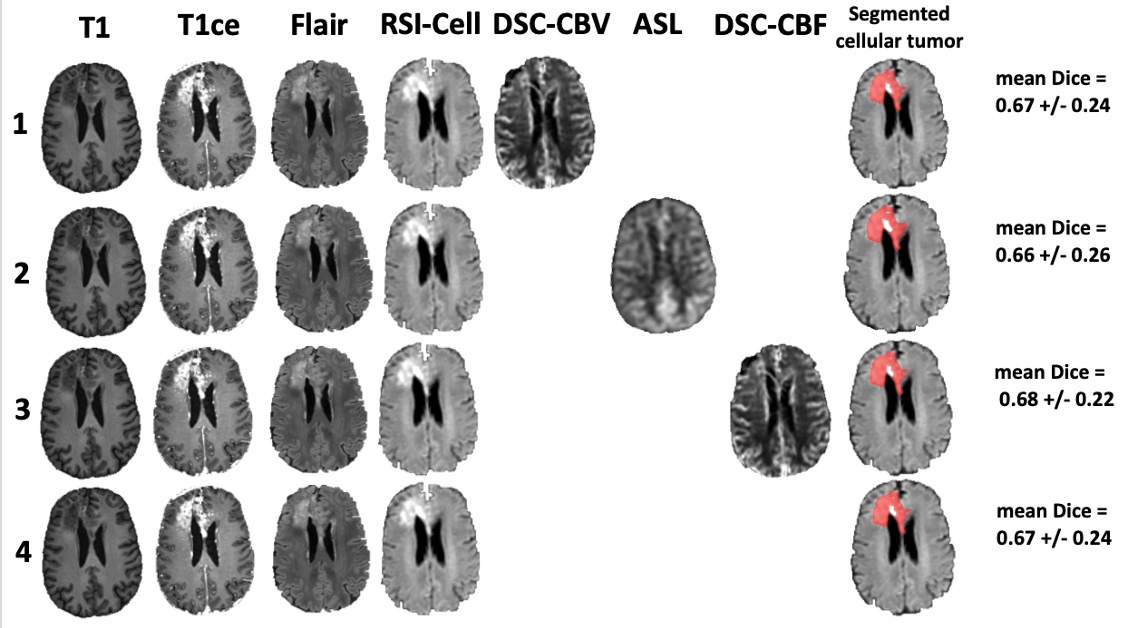
A cohort of 107 GBM patients with both DSC and ASL sequences were identified from January 2018 to December 2022 at UC San Diego Health. 138 post-operative scans were manually segmented for enhancing and non-enhancing cellular tumor volume by a neuroradiologist and by a radiology fellow. All cases with post-treatment changes only were assessed by a 2nd neuroradiologist. A subset of 50 out of the 138 scans had histological diagnosis from biopsy. Segmentations were performed based on extensive chart review and longitudinal imaging using T1, T1 contrast-enhanced (T1ce), fluid-attenuated inversion recovery (FLAIR), Restriction Spectrum Imaging (RSI)3 multi-shell diffusion sequence, Dynamic Susceptibility Contrast (DSC) and Arterial Spin Labeling (ASL). An example of segmentation for a cellular non-enhancing tumor case is shown in Fig 1. An example of segmentation for a case with only post-treatment changes is shown in Fig. 2. DSC images were processed using the Matlab DSC toolbox4 to compute CBV and CBF using a leakage correction algorithm2. ASL perfusion maps were computed inline from our MRI scanner. Images from all modalities were registered and resampled to a 256x256x256 1 mm isotropic resolution MNI brain atlas. We then trained a nnU-Net5 neural network to segment cellular tumor using 98 randomly selected cases. The deep learning model was subsequently tested on the 40 remaining cases (13 negative, 27 positive) from unique patients. Different combinations of the model inputs (T1, T1ce, FLAIR, RSI, DSC-CBV, DSC-CBF, ASL) were tested and the performance of each model to segment cellular tumor with Dice score and Volume Similarity (VS). We tested the performance of each model to distinguish residual/recurrent disease from post-treatment changes only using the area under the curve (AUC) of the receiver operating characteristic (ROC) curve and a random permutation test (n=10 000).Results
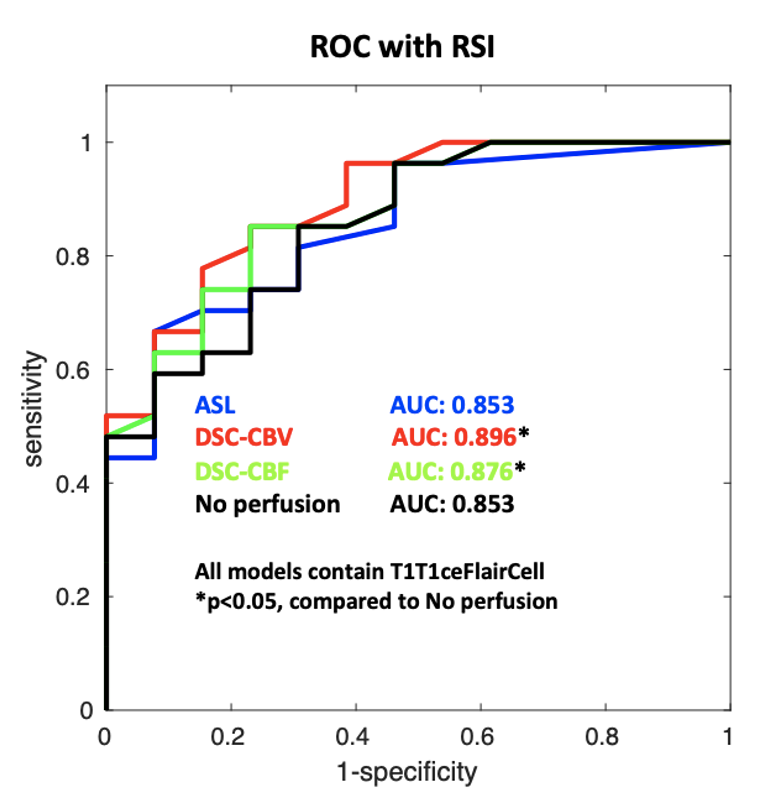
The mean Dice score and VS obtained across the test set are shown in Tab. 1 and were similar for each model. No statistical difference in Dice or VS was detected (DSC-CBV: p=0.94, DSC-CBF: 0.39 and ASL: 0.62, two-tailed paired t-test) between the model with perfusion and without perfusion. The AUC under the ROC curve for each model are shown in Fig. 4 and were higher for DSC-CBV (0.90 vs 0.85, p<0.05) and DSC-CBF (0.87 vs 0.85, p<0.05) compared to when no perfusion was used. The AUC of the ROC curve for ASL was not statistically different compared to when no perfusion method was used (0.85 vs 0.85, p= 0.21).Discussion
Our preliminary results show that while all model iterations perform equally based on segmentation metrics, DSC perfusion (both CBV and CBF) improved the detection of recurring/residual tumor over post-treatment changes only while ASL perfusion did not. This finding indicates that DSC perfusion may contain information relevant for tumor identification that is not present in ASL perfusion. The explanation for this finding remains unclear and more validation will be required. One hypothesis is that the pre-processing steps for ASL were sub-optimal, as they were performed inline by the scanner without the possibility to test different sets of parameters. Another hypothesis is that the generally higher conspicuity of the DSC signal compared to ASL makes it easier to detect by the Deep Learning model.Conclusions
These findings re-demonstrate the importance of including a DSC perfusion method in brain tumor MRI protocol. Future work will include a 5-fold cross validation to improve statistical power and testing the calibrated CBF maps computed from the ASL perfusion data.Acknowledgements
This research was funded by an NIH SBIR grant.References
1. Taylor, C., Ekert, J. O., Sefcikova, V., Fersht, N. & Samandouras, G. Discriminators of pseudoprogression and true progression in high-grade gliomas: A systematic review and meta-analysis. Sci Rep-uk 12, 13258 (2022).
2. Boxerman, J. L., Schmainda, K. M. & Weisskoff, R. M. Relative cerebral blood volume maps corrected for contrast agent extravasation significantly correlate with glioma tumor grade, whereas uncorrected maps do not. Ajnr Am J Neuroradiol 27, 859–67 (2006).
3. White, N. S., Leergaard, T. B., D’Arceuil, H., Bjaalie, J. G. & Dale, A. M. Probing tissue microstructure with restriction spectrum imaging: Histological and theoretical validation. Hum Brain Mapp 34, 327–346 (2013).
4. Peruzzo, D., Bertoldo, A., Zanderigo, F. & Cobelli, C. Automatic selection of arterial input function on dynamic contrast-enhanced MR images. Comput Meth Prog Bio 104, e148–e157 (2011).
5. Isensee, F., Jaeger, P. F., Kohl, S. A. A., Petersen, J. & Maier-Hein, K. H. nnU-Net: a self-configuring method for deep learning-based biomedical image segmentation. Nat Methods 18, 203–211 (2021).
Figures