3844
Pixel-wise correlation among DCE/DSC metrics in brain tumor with Multitasking-based dynamic imaging for cerebrovascular evaluation (MT-DICE)1Radiology, University of Southern California, Los Angeles, CA, United States, 2University of Southern California, Los Angeles, CA, United States
Synopsis
Keywords: Tumors (Post-Treatment), Tumor
Motivation: DCE and DSC-derived Ktrans, ve, CBV, and kio are measures of microcirculatory function, perfusion, and water channel in brain tumors. They have shown clinical values in tumor grading, treatment response, and prognosis evaluation. However, their pixel-wise inter-correlation remains unclear, partially due to separate scans in conventional protocol or having one of them omitted.
Goal(s): To investigate the pixel-wise correlation of Ktrans, ve, CBV, and kio in patients with brain tumors using MT-DICE.
Approach: The multiparametric maps simultaneously quantified by MT-DICE were analyzed pixel-by-pixel within the slice showing the largest enhancing tumor.
Results: Ktrans and ve correlate well with kio in the spatial distribution.
Impact: MR multitasking-based dynamic imaging for cerebrovascular evaluation (MT-DICE) provides spatial quantitative maps of BBB permeability, tumor perfusion, and water channel. The information helps better understand intra-tumor heterogeneity and may assist in selecting biopsy sites and precisely monitoring treatment response.
Introduction
Brain tumors tend to impact blood-brain barrier (BBB) integrity, angiogenesis, vascularity, and transmembrane water transporter1. In the meantime, these features contribute to the infiltration and different treatment responses. As a complement to conventional MRI, dynamic contrast-enhanced (DCE) MRI is used to quantify BBB permeability-related properties, such as transfer constant (Ktrans) and fractional extravascular-extracellular volume (ve). Dynamic susceptibility contrast MRI (DSC) is used to quantify perfusion-related properties, such as cerebral blood volume (CBV). Recently, a study has shown that an intracellular-to-extracellular water-efflux-rate constant kio, which characterizes the major water channel aquaporin channel 4, could also be obtained from DCE2. These parameters each represent distinct pathophysiologic conditions and tumor heterogeneity; they also provide diagnostic and prognostic values and may serve as biomarkers for targeted therapy. We recently developed an MR multitasking-based dynamic imaging for cerebrovascular evaluation (MT-DICE) technique that uses a single-dose gadolinium injection to simultaneously quantify DCE and DSC parameters (Ktrans, ve, CBV, and kio) in brain tumors3. The aim is to utilize MT-DICE to investigate the pixel-wise correlation of the above parameters in patients with brain tumors.Methods
Patients who met the following criteria were included in our study: (1) diagnosed with primary or secondary brain tumor; (2) had undergone standard treatment; (3) previous brain MRI showed contrast-enhanced lesion(s) left.All imaging examinations were performed on a 3 Tesla MR scanner (MAGNETOM Vida; Siemens Healthcare) with a 20-channel head-neck coil. The MT-DICE sequence was obtained right after a pre-contrast clinical protocol using the following imaging parameters: oblique transverse orientation as clinical axial post-contrast T1WI, pulse repetition time = 19.30 ms, echo times = 2.46/4.92/7.38/9.84/12.30/17.22 ms, flip angle = 10◦, field-of-view = 216 × 216 × 128 mm3, spatial resolution = 1.5 × 1.5 × 4.0 mm3, scan time = 8 minutes. A single dose (0.1 mmol/kg of body weight) of contrast agent (MultiHance; Bracco Imaging) was administered 90 seconds into the scan at the rate of 3.0 mL/s, followed by a saline flush.
All images were analyzed by a reader who was blinded to patients’ clinical information on the largest lesion slice on post-contrast T1WI. Regions of interest were plotted around the enhanced tumor region, avoiding necrotic tissue and large vessels, and then automatically transformed into the Ktrans, ve, CBV, and kio maps generated from MT-DICE. Metrics information about the parameters was calculated on a pixel-by-pixel basis.
Data normality was examined at voxel level with histogram. Wilcoxon ranking score was used to transform the data within each tumor followed by Spearman correlation. Mixed model with random slope was used to assess the weighted average of the correlation coefficient across subjects.
Results
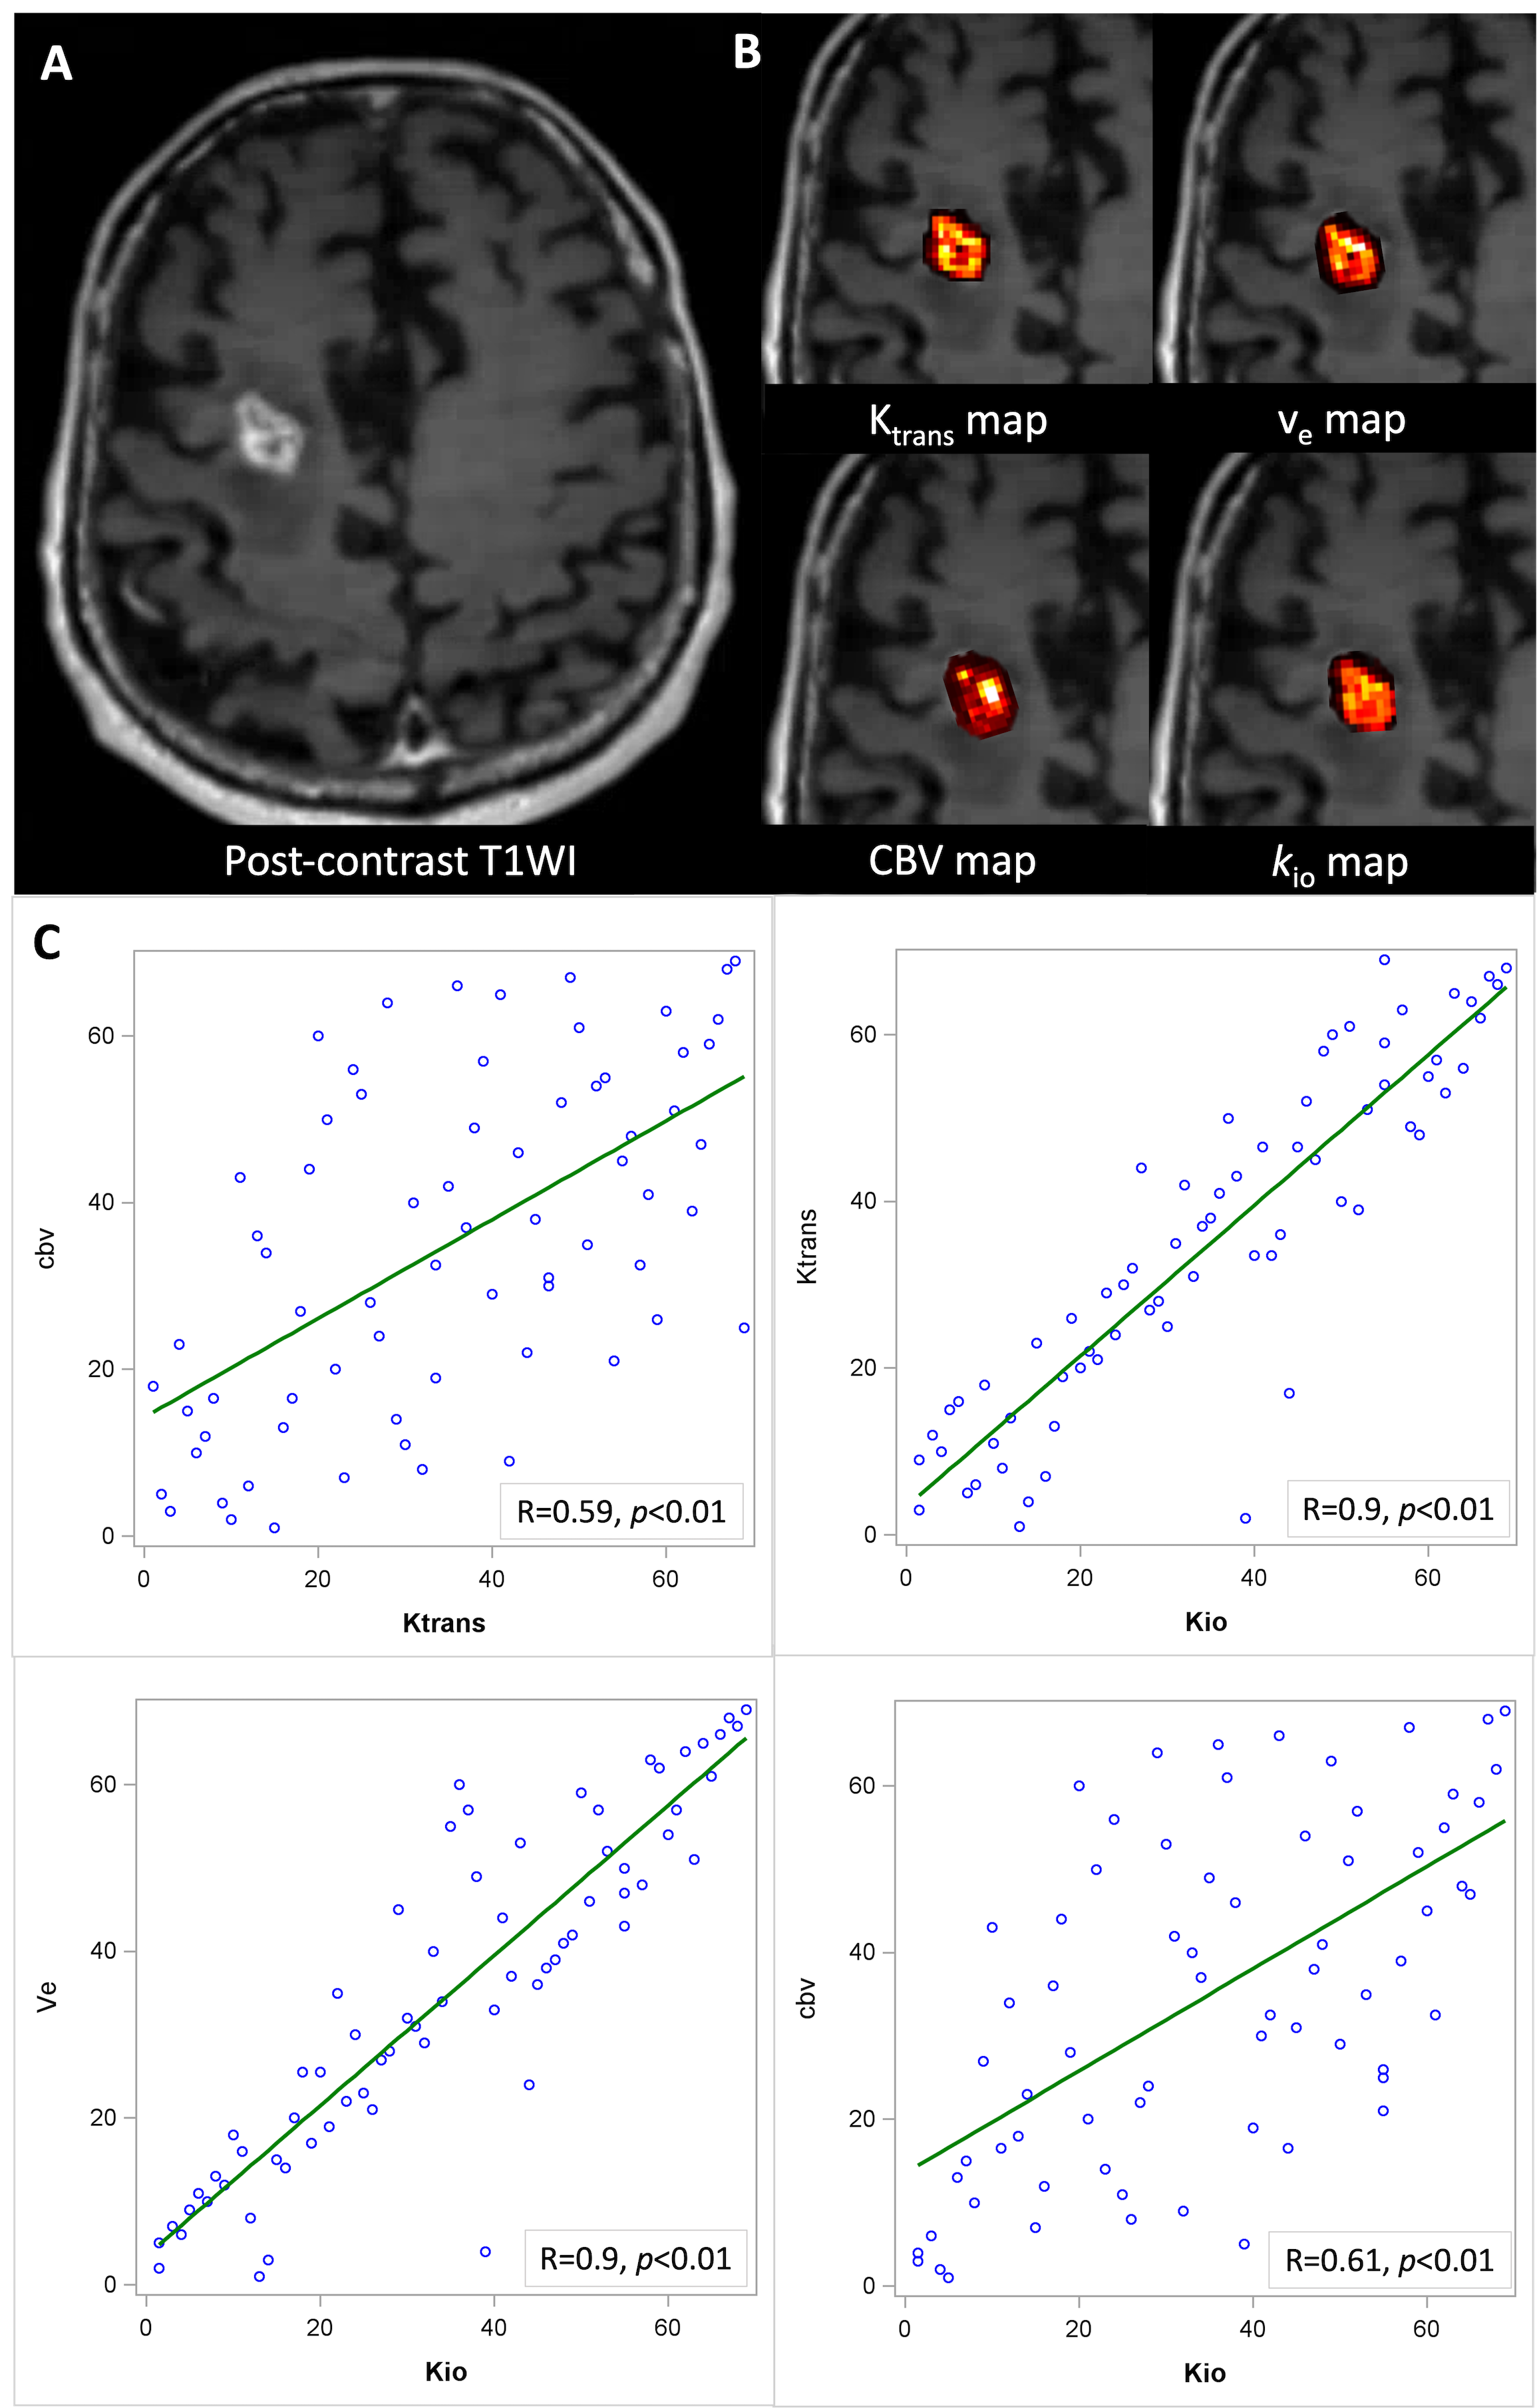
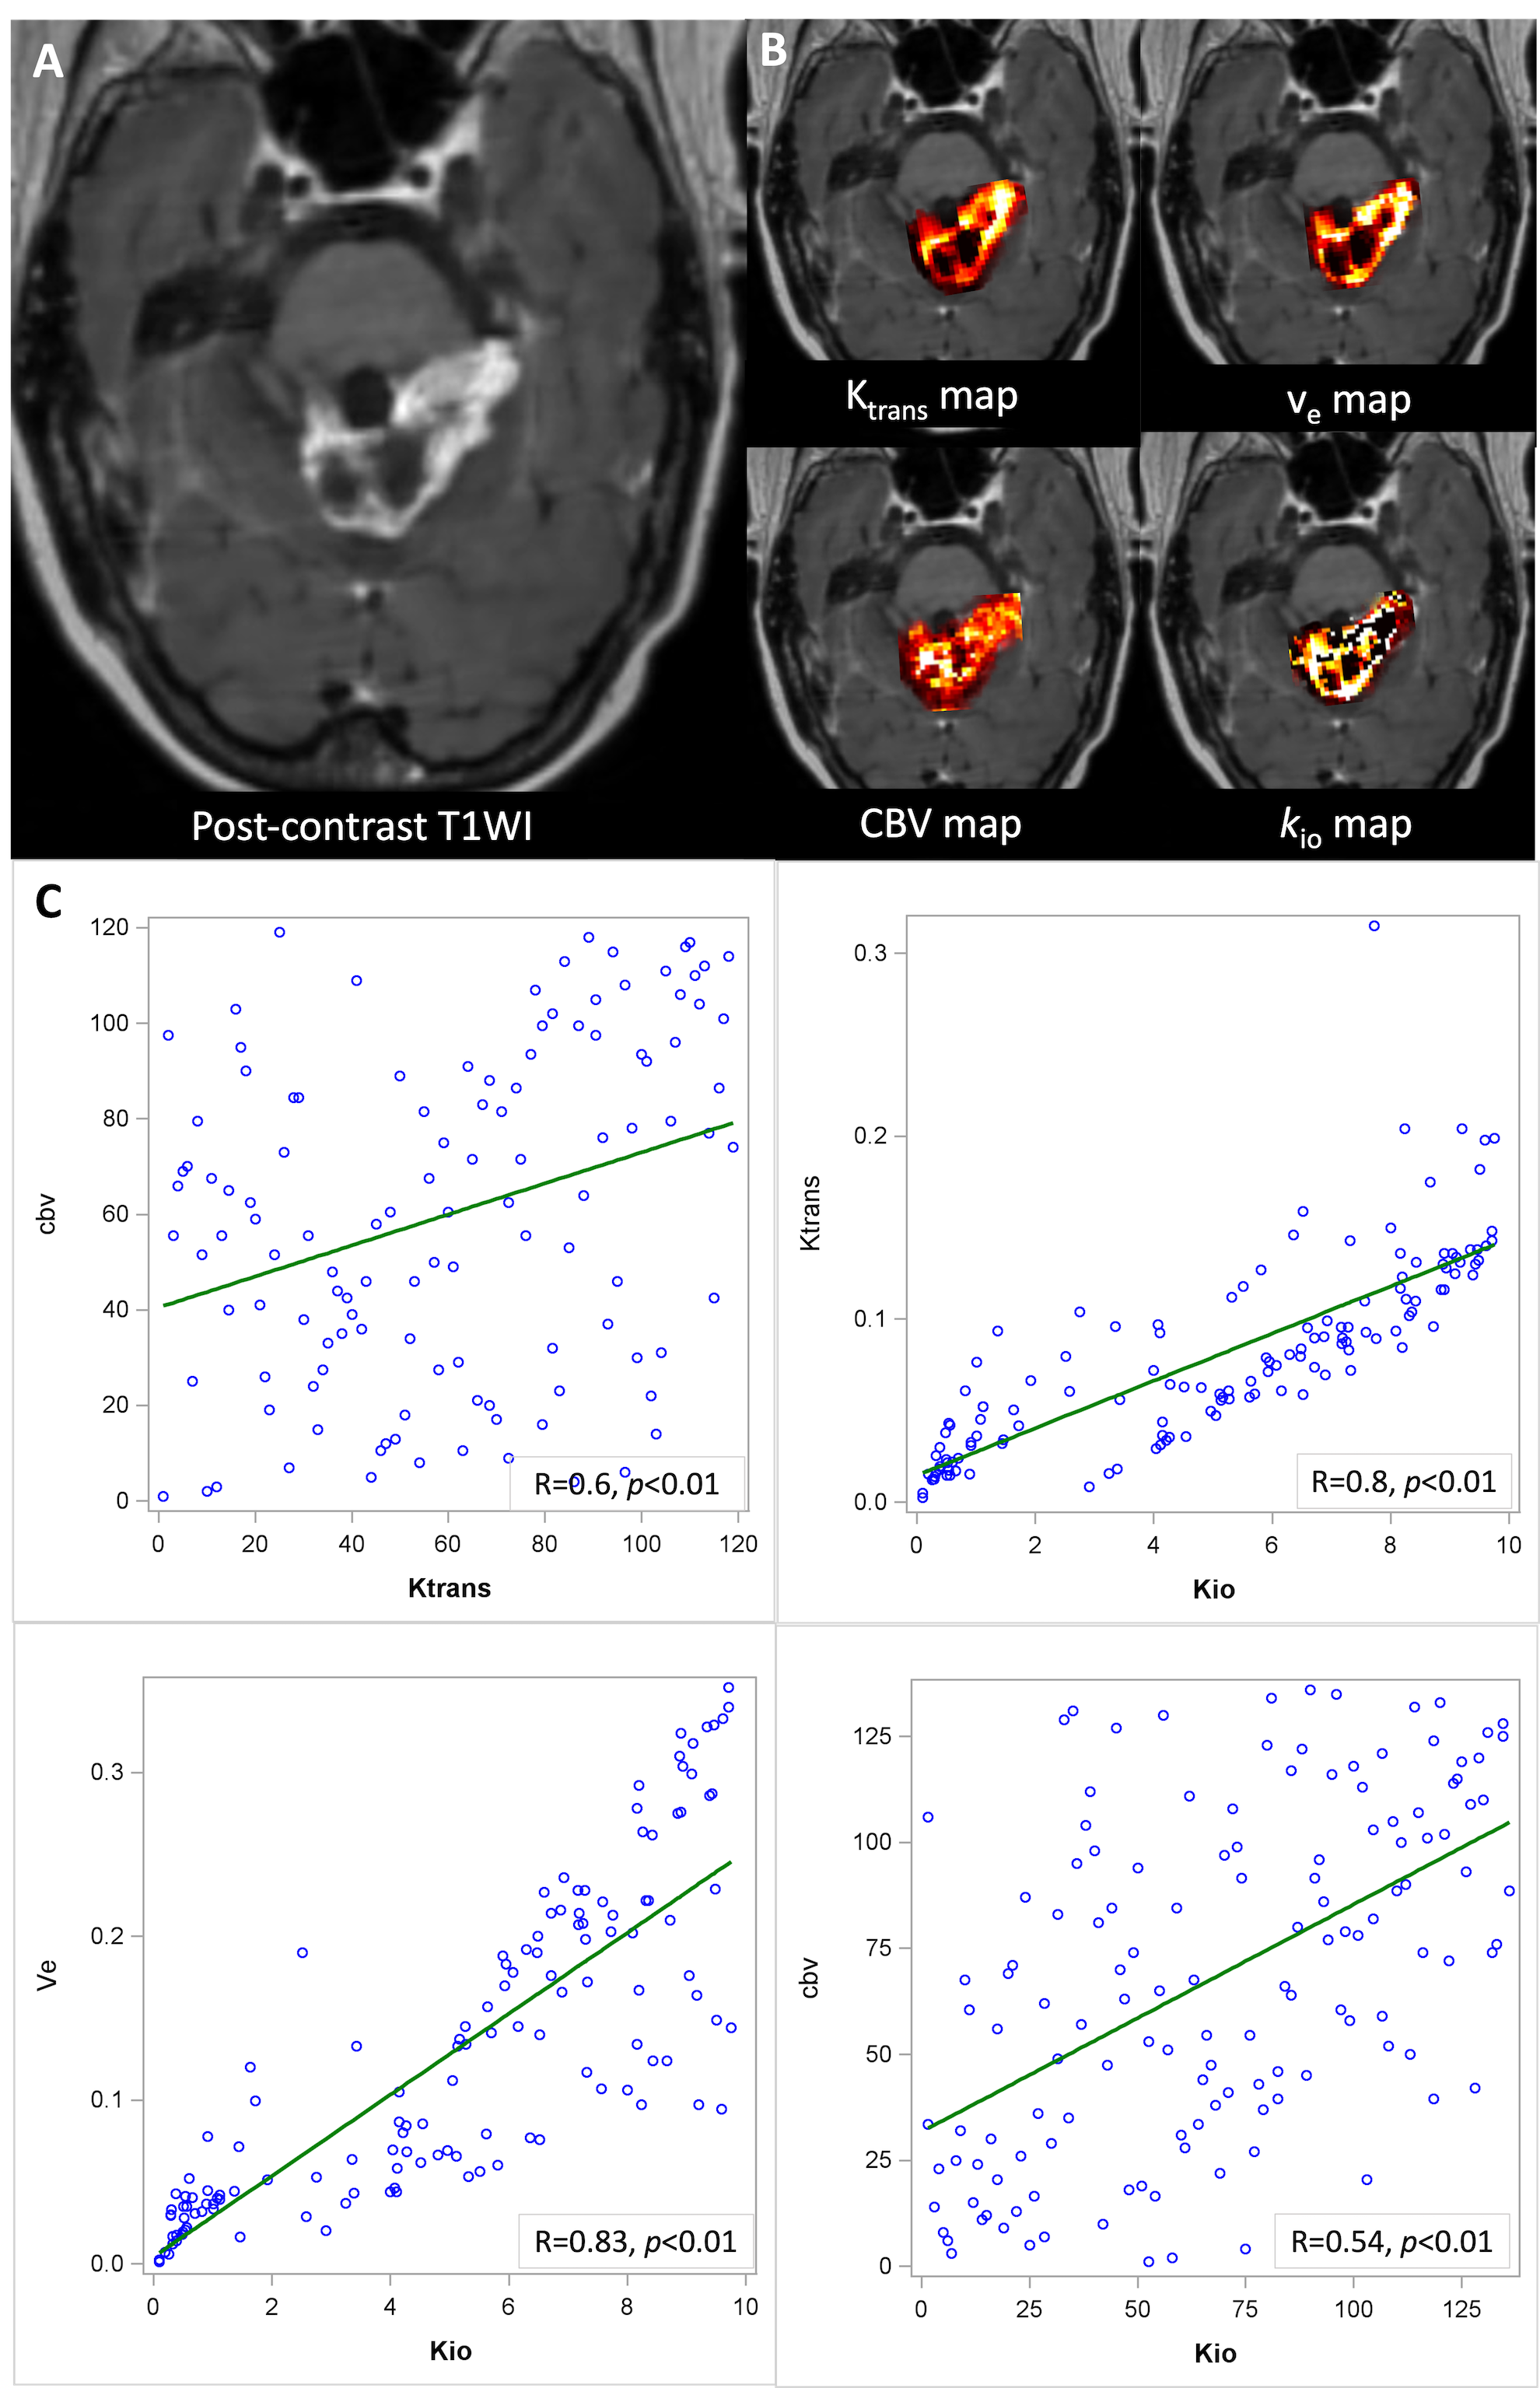
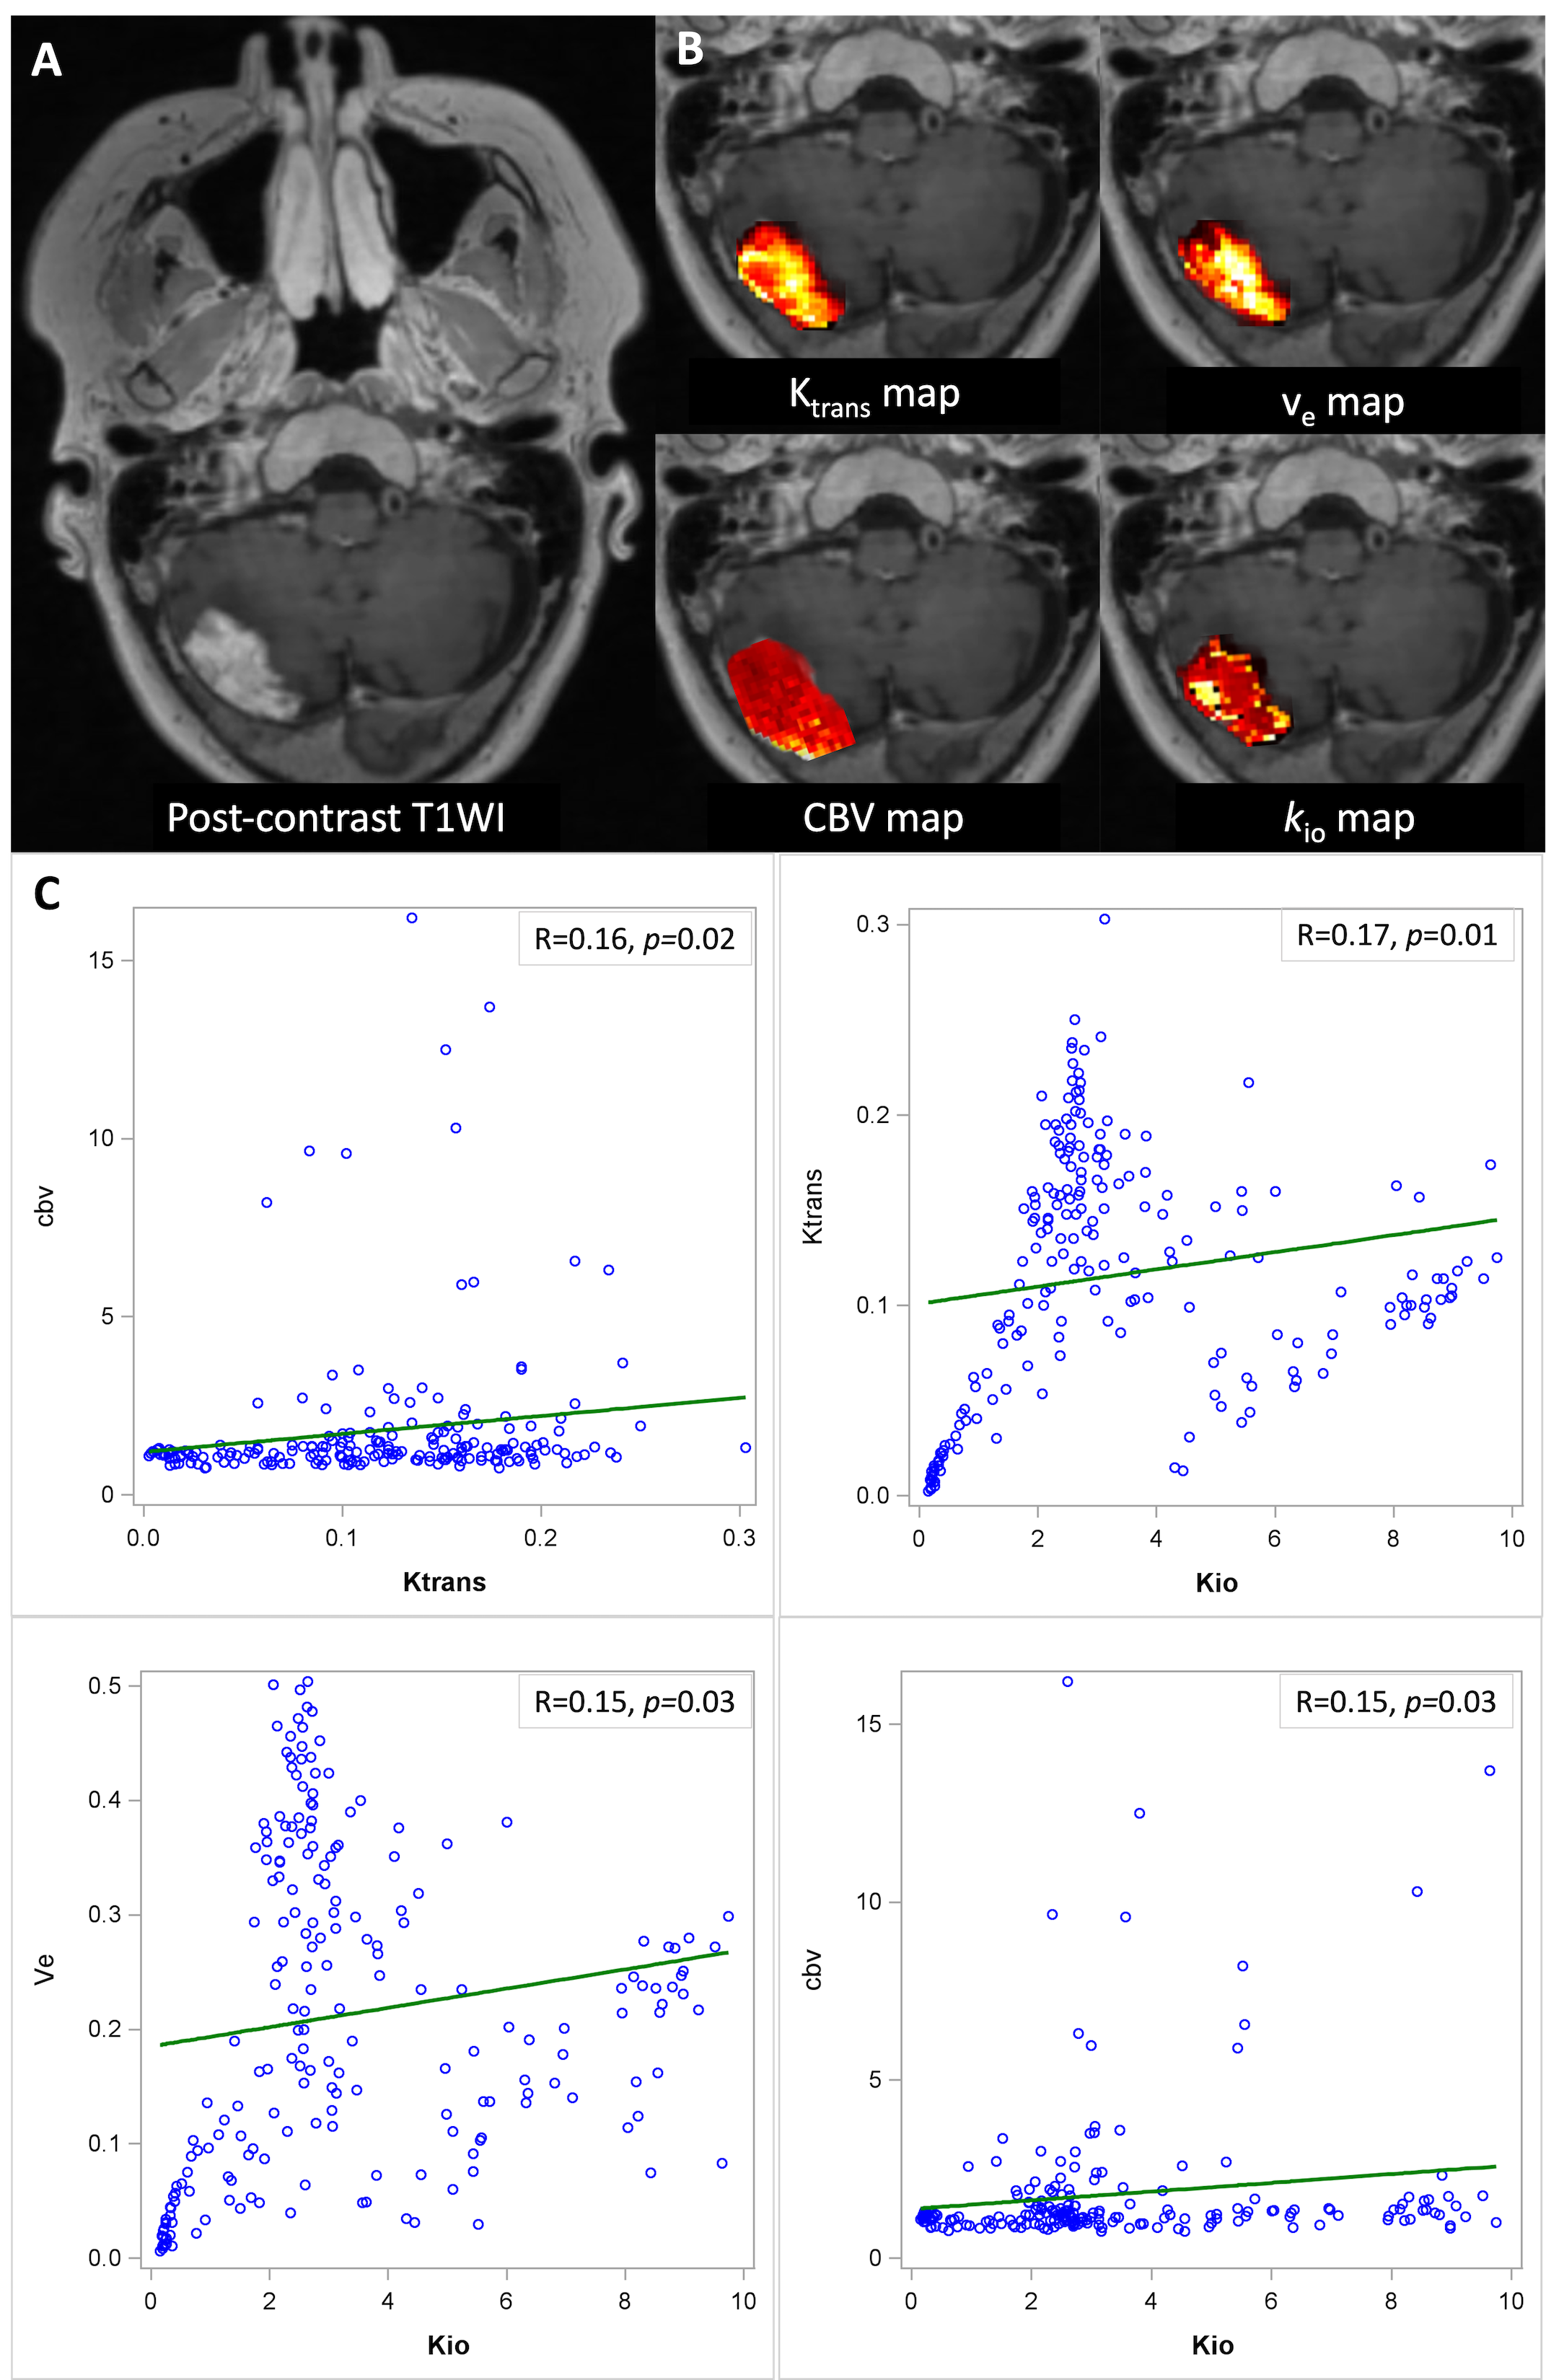
We enrolled 13 patients (aged 50–81 years, 5 males), including 3 glioblastoma and 10 brain metastases (3 secondary to breast cancer, 1 secondary to gastroesophageal junction adenocarcinoma, 4 secondary to lung cancer, and 2 secondary to renal cell carcinoma). Within the time window, a second scan was performed on 1 patient with glioblastoma and 1 patient with brain metastases secondary to lung cancer two and three months later, respectively.The mixed model showed that Ktrans (r= 0.65, 95% CI: 0.56, 0.74) and ve (r= 0.68, 95% CI: 0.6, 0.76) were linearly correlated with kio, respectively. Weak correlations were observed between CBV and kio (r= 0.25, 95% CI: 0.14, 0.37) and Ktrans and CBV (r= 0.34, 95% CI: 0.22, 0.45).
Figures 1, 2, and 3 show examples of multiparametric MR images and corresponding correlations in three patients with brain metastases. They demonstrate three typical patterns (strong, moderate, and weak) in correlation among the parameters.
Discussion
Treatment response and outcomes are directly impacted by intra-tumor heterogeneity. We successfully generated Ktrans, ve, CBV, and kio maps with a single-dose injection to evaluate the spatial distribution of DCE and DSC parameters within the tumor. Our results show that the BBB permeability parameters Ktrans and ve have strong correlations with the water channel imaging biomarker kio; meanwhile, the correlations between the perfusion parameter CBV and Ktrans and kio are not as strong. It suggests that DCE- and DSC-derived metrics each play an important role in describing the pathophysiological manifestations of brain tumors. An accurate quantitative map has the potential to help identify the “hot spot” for biopsy and closely monitor treatment response. In conclusion, our novel biomarker kio is well correlated with but not redundant from traditional markers Ktrans and ve. The finding is consistent across different tumor types.Acknowledgements
No acknowledgement found.References
1. Arvanitis CD, Ferraro GB, Jain RK. The blood-brain barrier and blood-tumour barrier in brain tumours and metastases. Nat Rev Cancer. 2020 Jan;20(1):26-41.
2. Jia Y, Xu S, Han G, et al. Transmembrane water-efflux rate measured by magnetic resonance imaging as a biomarker of the expression of aquaporin-4 in gliomas. Nat Biomed Eng. 2023 Mar;7(3):236-252.
3. Hu Z, Christodoulou AG, Wang N, et al. MR multitasking-based dynamic imaging for cerebrovascular evaluation (MT-DICE): Simultaneous quantification of permeability and leakage-insensitive perfusion by dynamic T1/T2* mapping. Magn Reson Med. 2023 Jan;89(1):161-176.
Figures