3840
Comparing methods of biomarker quantification for contrast clearance analysis in patients with brain metastases1Department of Radiotherapy and Imaging, Institute of Cancer Research, London, United Kingdom, 2Neuro-oncology Unit, The Royal Marsden NHS Foundation Trust, London, United Kingdom, 3Department of Radiology, The Royal Marsden NHS Foundation Trust, London, United Kingdom, 4Department of Neuroradiology, St George’s University Hospital, London, United Kingdom
Synopsis
Keywords: Tumors (Pre-Treatment), Cancer, brain metastases, contrast clearance analysis (CCA)
Motivation: Differentiating tumour progression and treatment-induced changes in brain metastases is challenging, and quantitative measures of tumour burden and response are needed.
Goal(s): To develop and compare quantitative contrast clearance analysis (CCA) mapping techniques with conventional qualitative approaches in 9 patients with brain metastases.
Approach: We assessed the correlation of Relative Enhancement and Fractional Enhancement methods with conventional CCA in the brain and within detected tumour regions.
Results: Fractional Enhancement mapping was superior to relative enhancement in terms of its statistical properties and correlation with conventional CCA.
Impact: Quantitative enhancement fraction mapping of contrast clearance analysis (CCA) data is clinically feasible and demonstrates good correlation with conventional CCA. When used in combination with conventional radiological CCA, it may help quantify post-treatment changes in brain metastases following treatment.
Introduction
Contrast-enhanced magnetic resonance (MR) is the most commonly used technique for detecting and monitoring change in brain metastases during treatment. However, it can be difficult to differentiate between tumor progression and treatment-related enhancement, complicating the interpretation of images during or after radiation therapy1,2. Contrast clearance analysis (CCA) 3,4 interrogates the difference between late (~1 hour) and early phase (~5 minutes) signal intensity differences on T1-weighted imaging after contrast injection. The technique has shown good correlation with tumor burden and histopathological response3, providing indication of tumour presence in the regions with contrast clearance. However, the subtraction maps produced are non-quantitative and thus may be affected by scanner variation at different centers. It is also difficult to detect change prospectively. A quantitative marker is essential, particularly one that can be used for monitoring treatment in prospective treatment trials5. In this preliminary work we compare two approaches for creating quantitative CCA images with the conventional approach.Materials and Methods
Nine patients (females/males=6/3, mean age 56.3 ± 12.9 years) diagnosed with brain metastases participated in this research ethics committee approved study. Informed consent was obtained from all participants. Images were acquired at 1.5T or 3T (MAGNETOM Sola/Aera/Skyra, Siemens AG, Germany) using a standard T1-weighted 3D magnetization-prepared rapid gradient-echo sequence (3D MP-RAGE) 6,7 after contrast injection, once at 5 minutes (early) and another between 65 and 105 minutes (late). All patients had tumours present, but in three patients they were too small to outline (patients 2, 3, and 9).Rigid registration of the early and late-phase images was accomplished with ITK-SNAP8, using a cross-correlation image similarity metric. Skull stripping and brain extraction were subsequently performed using the Brain Extraction Tool (BET)9; Cerebrospinal fluid (CSF) was delineated using FMRIB's Automated Segmentation Tool (FAST)10, as implemented in FSL11. Signal in late phase images, $$$S_{late}$$$, was normalized to early phase images, $$$S_{early}$$$:
$$S_{late}^{*}=\frac{Med(S_{early})}{Med(S_{late})}S_{late}$$
where $$$Med(x)$$$ represent the median of signal $$$x$$$ in brain tissue only.
Three maps were generated then generated: Difference ($$$\bigtriangleup$$$) to emulate the standard CCA map, Relative Enhancement (RE), and Fractional Enhancement (EF)12:
$$\bigtriangleup=S_{late}^{*}-S_{early}$$
$$RE=\frac{S_{late}^{*} -S_{early}}{S_{early}}\times 100\%$$
$$EF=\frac{S_{late}^{*}-S_{early}}{S_{early}+S_{late}^{*}}\times100\%$$
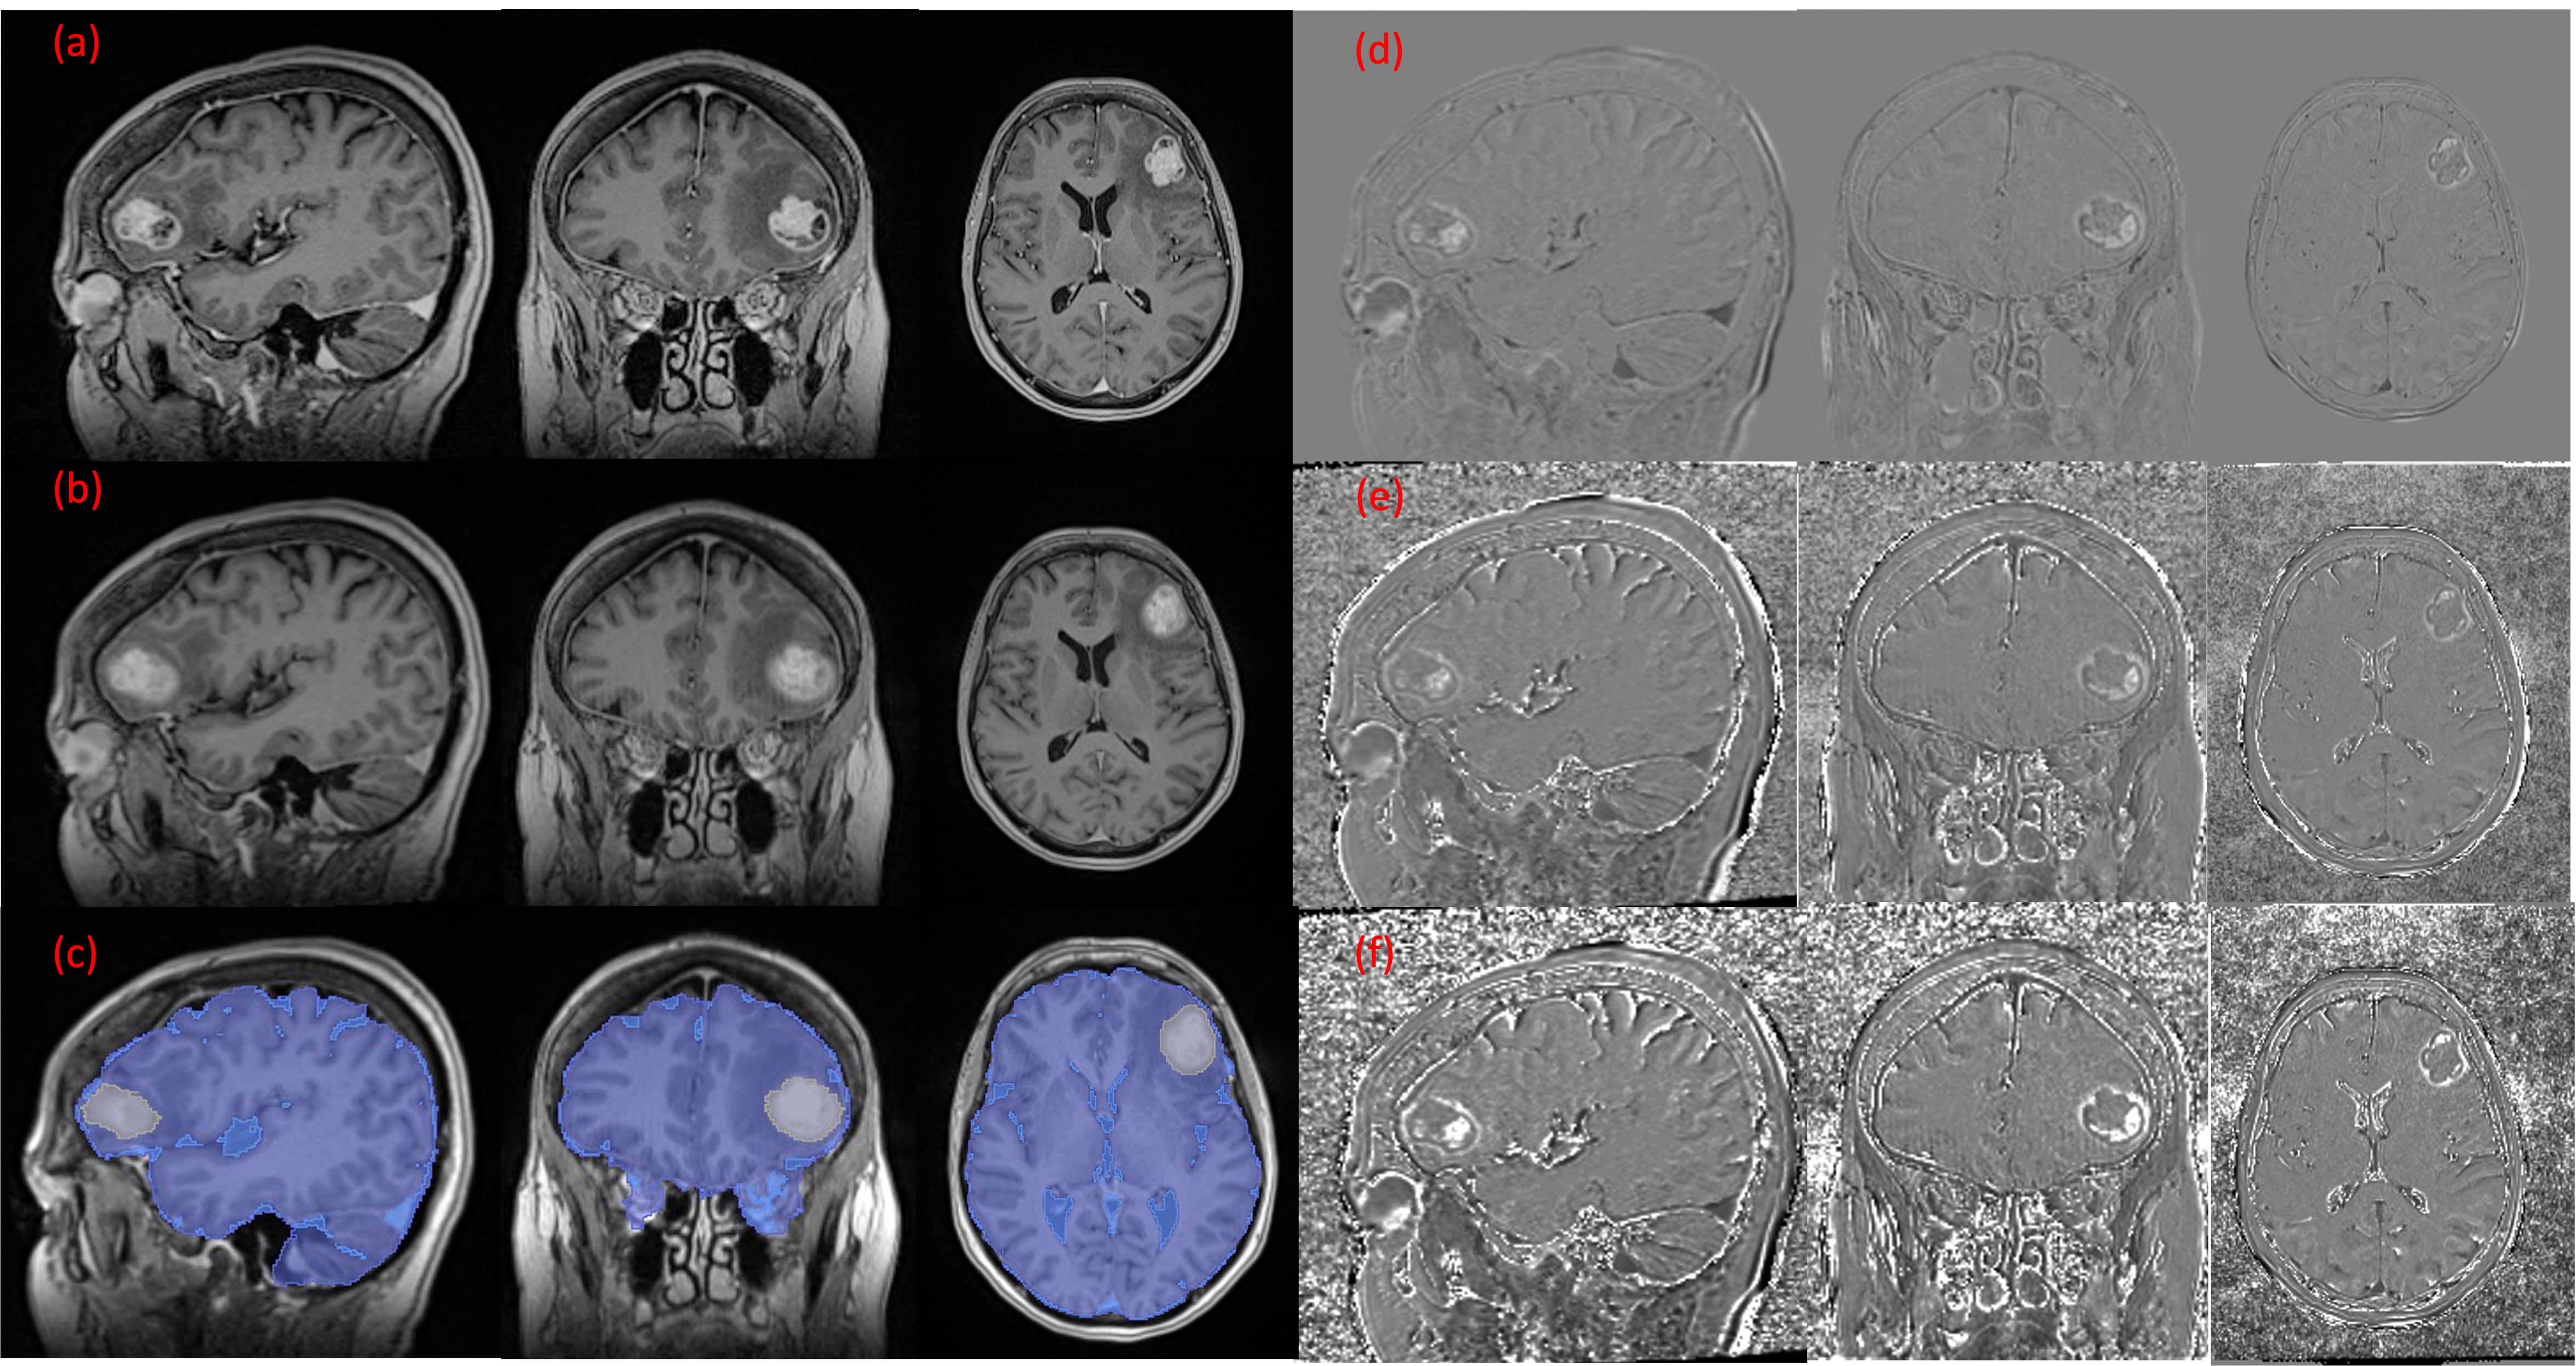
A Key advantage to the latter two is that they provide quantification of contrast change: $$$RE\in\left[ -100\%,\infty\right)$$$ and $$$EF\in\left[-100\%,100\%\right] $$$ (see Figure 1 for examples of all images).
We derived voxel values of $$$\bigtriangleup$$$, RE and EF from tumour regions and healthy brain (removing tumor and CSF masks) and compared the correlation of RE and EF with $$$\bigtriangleup$$$. We also compared the overlap between all possible pairs of distributions in brain and tumour regions for all three image kinds, by computing the overlapping index13:
$$\eta_{z}=\int_{-\infty }^{\infty} min\left [\widehat{f_{x}}(z'),\widehat{f_{y}}(z')\right]dz'$$
where $$$\widehat{f_{x}}(z')$$$ and $$$\widehat{f_{y}}(z')$$$ represent kernel density estimates of the underlying distributions for image values $$$z$$$ for patients $$$x$$$ and $$$y$$$ respectively, and $$$z\in\left\{\Delta, RE, EF\right\}$$$.
Results
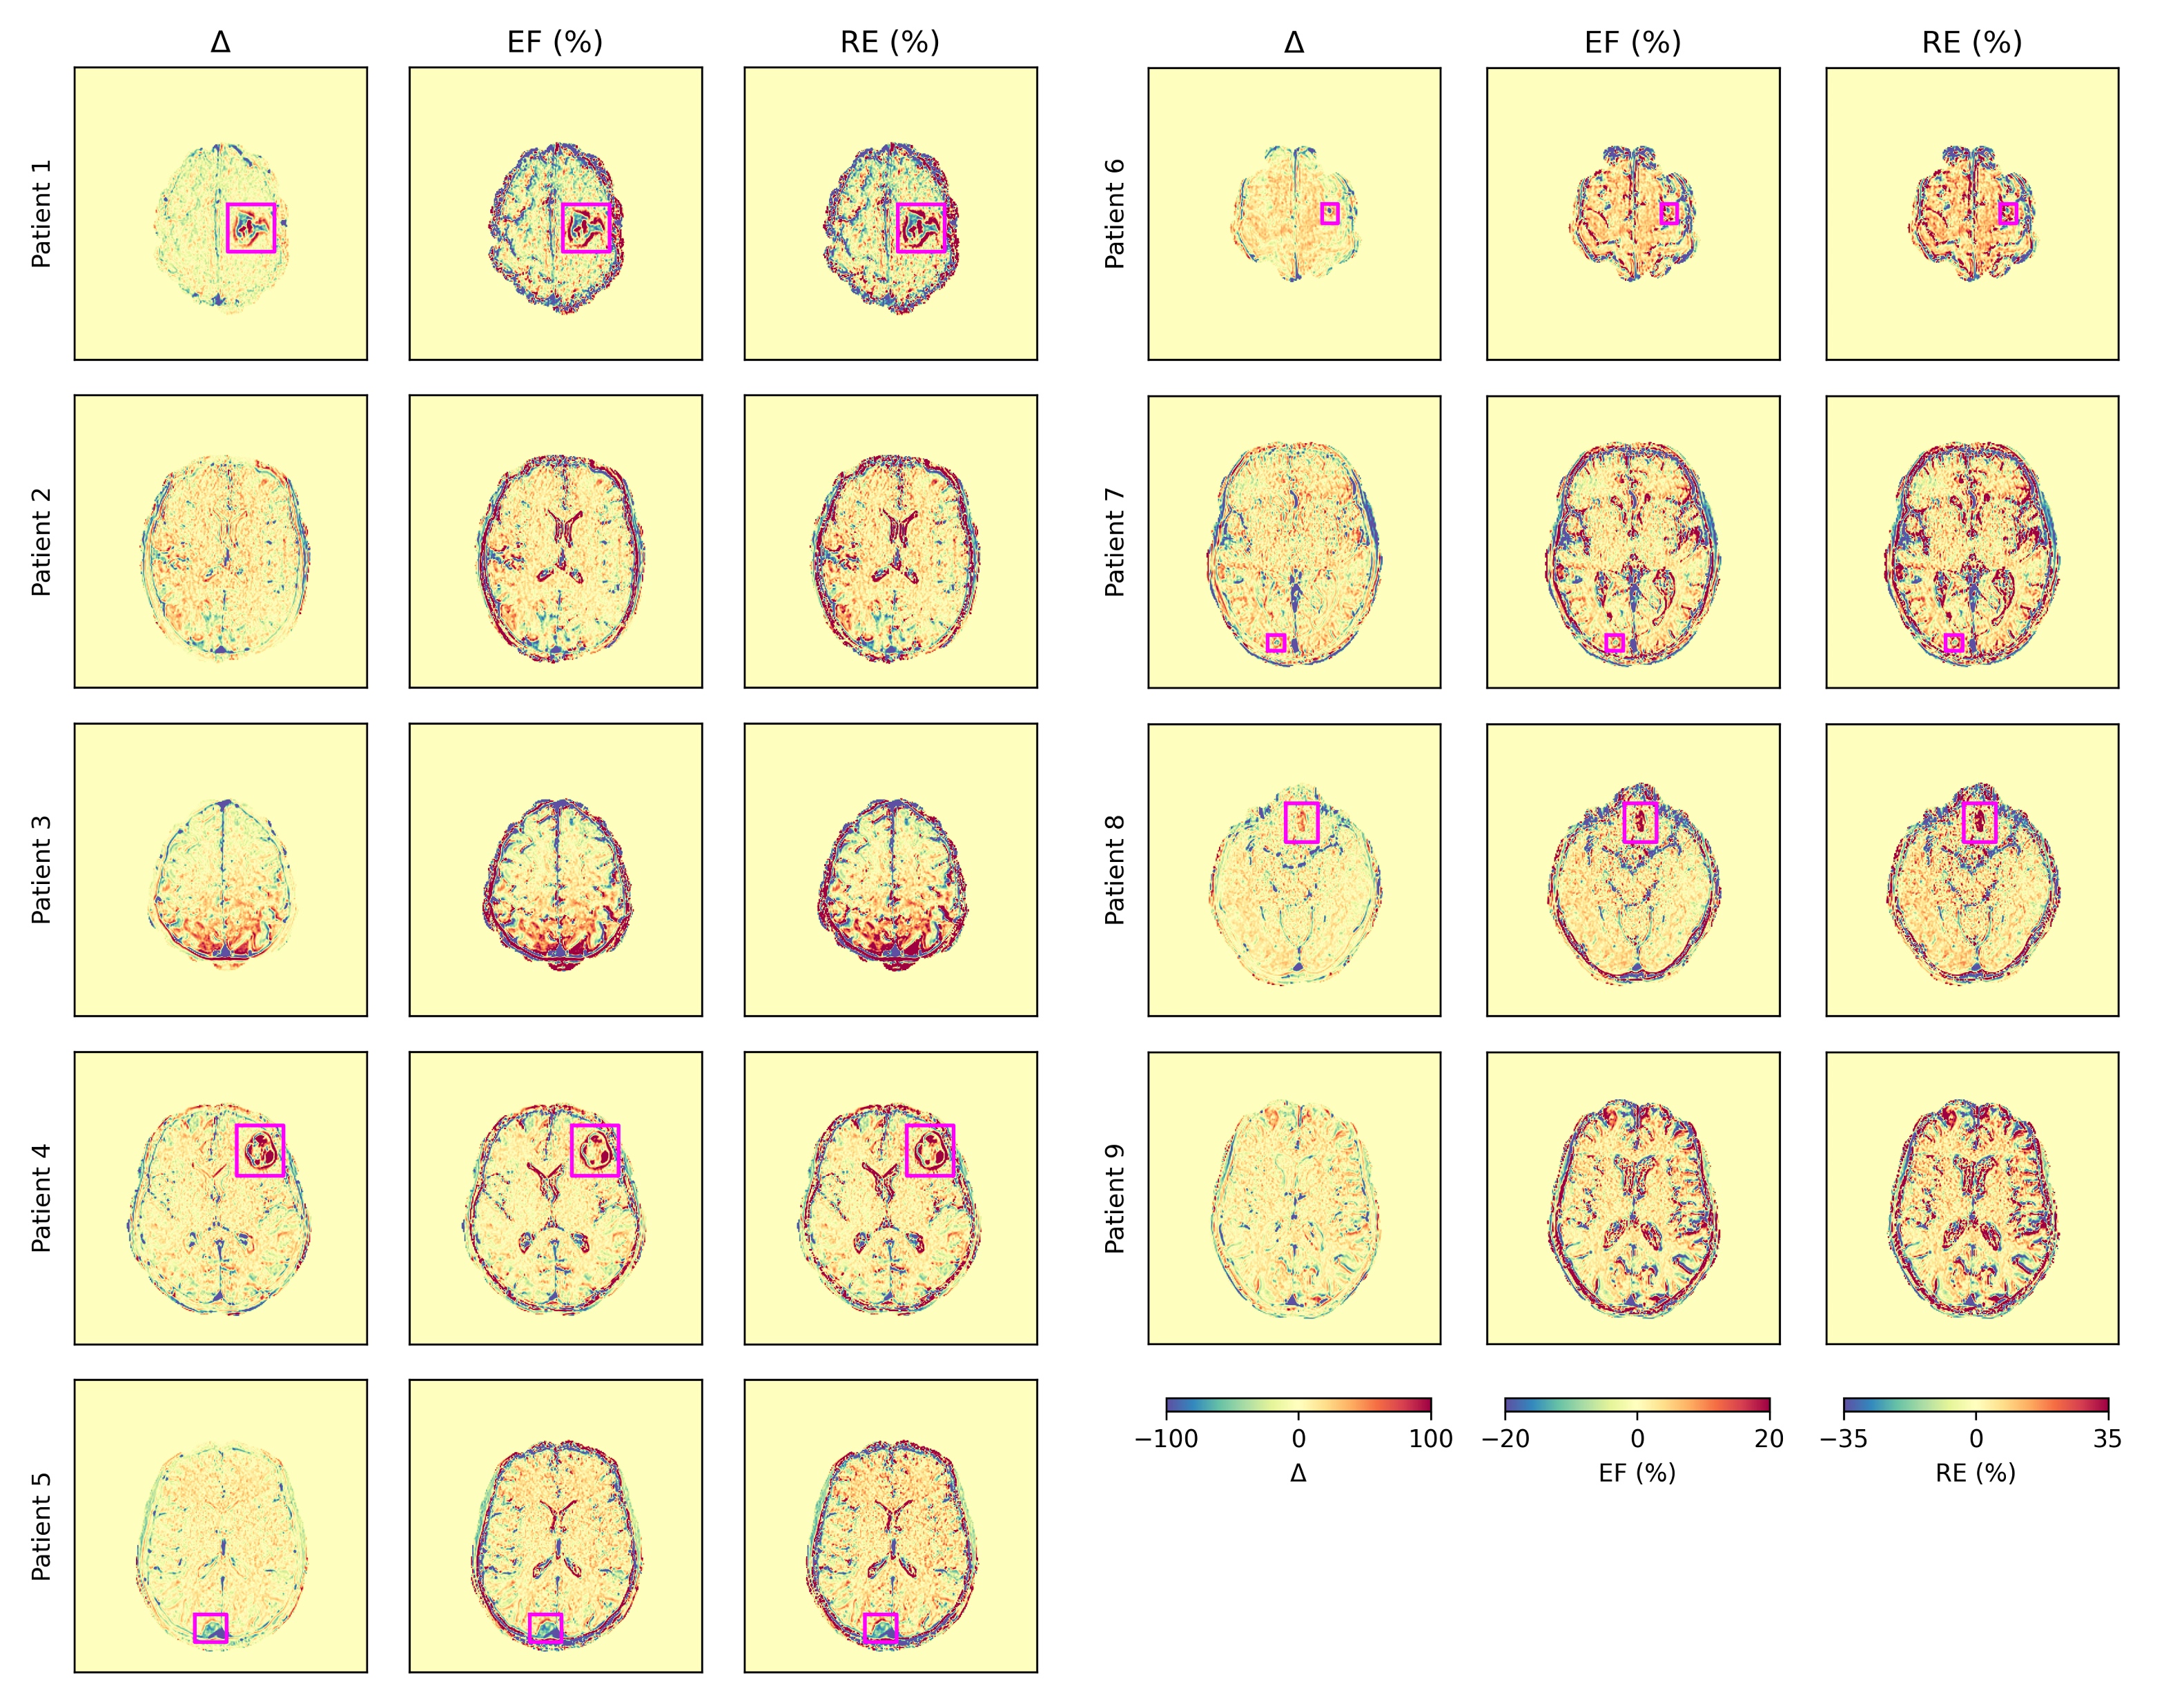
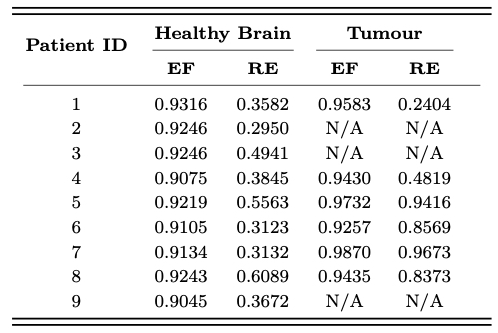
Figure 2 displays axial images of $$$\bigtriangleup$$$, RE and EF maps in all 9 patients, indicating in each case the location of the tumour where available. In general, EF and RE maps have visually poorer contrast-to-noise than maps of $$$\bigtriangleup$$$, though tumor location is still readily identifiable in all but one case consisting of a small metastasis.Figure 3 presents the Pearson correlation coefficients (r) of $$$\bigtriangleup$$$ with EF and RE in healthy brain and tumoral regions for each patient. EF demonstrates higher correlation in all patients, suggesting it acts as a better predictor of $$$\bigtriangleup$$$.
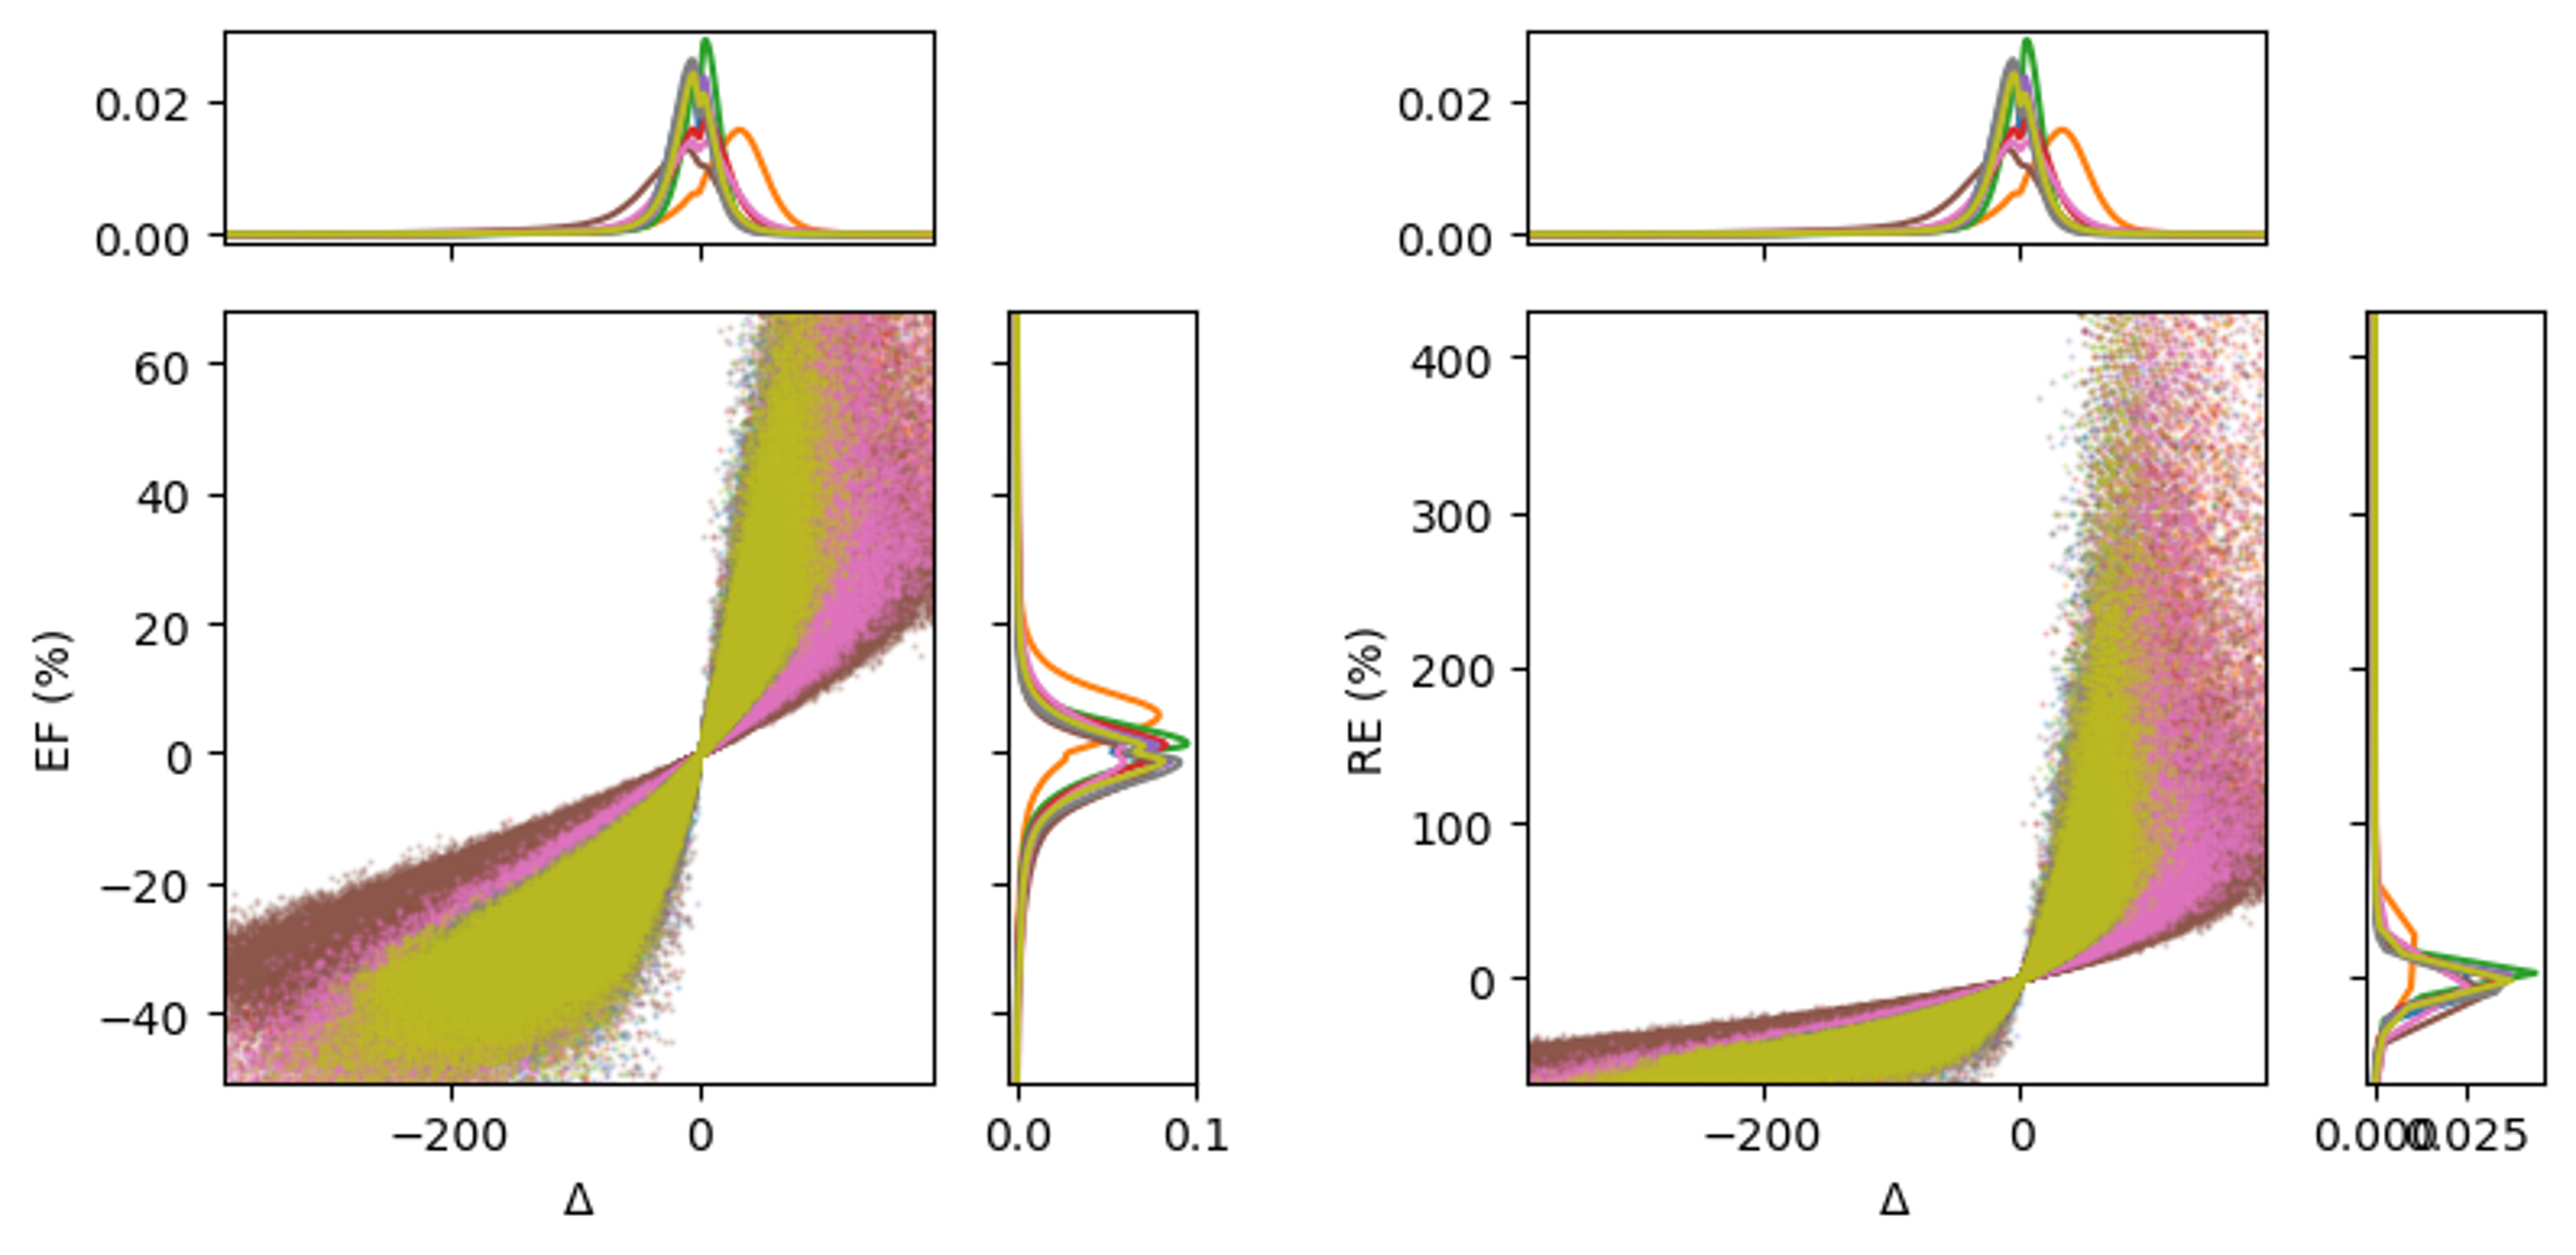
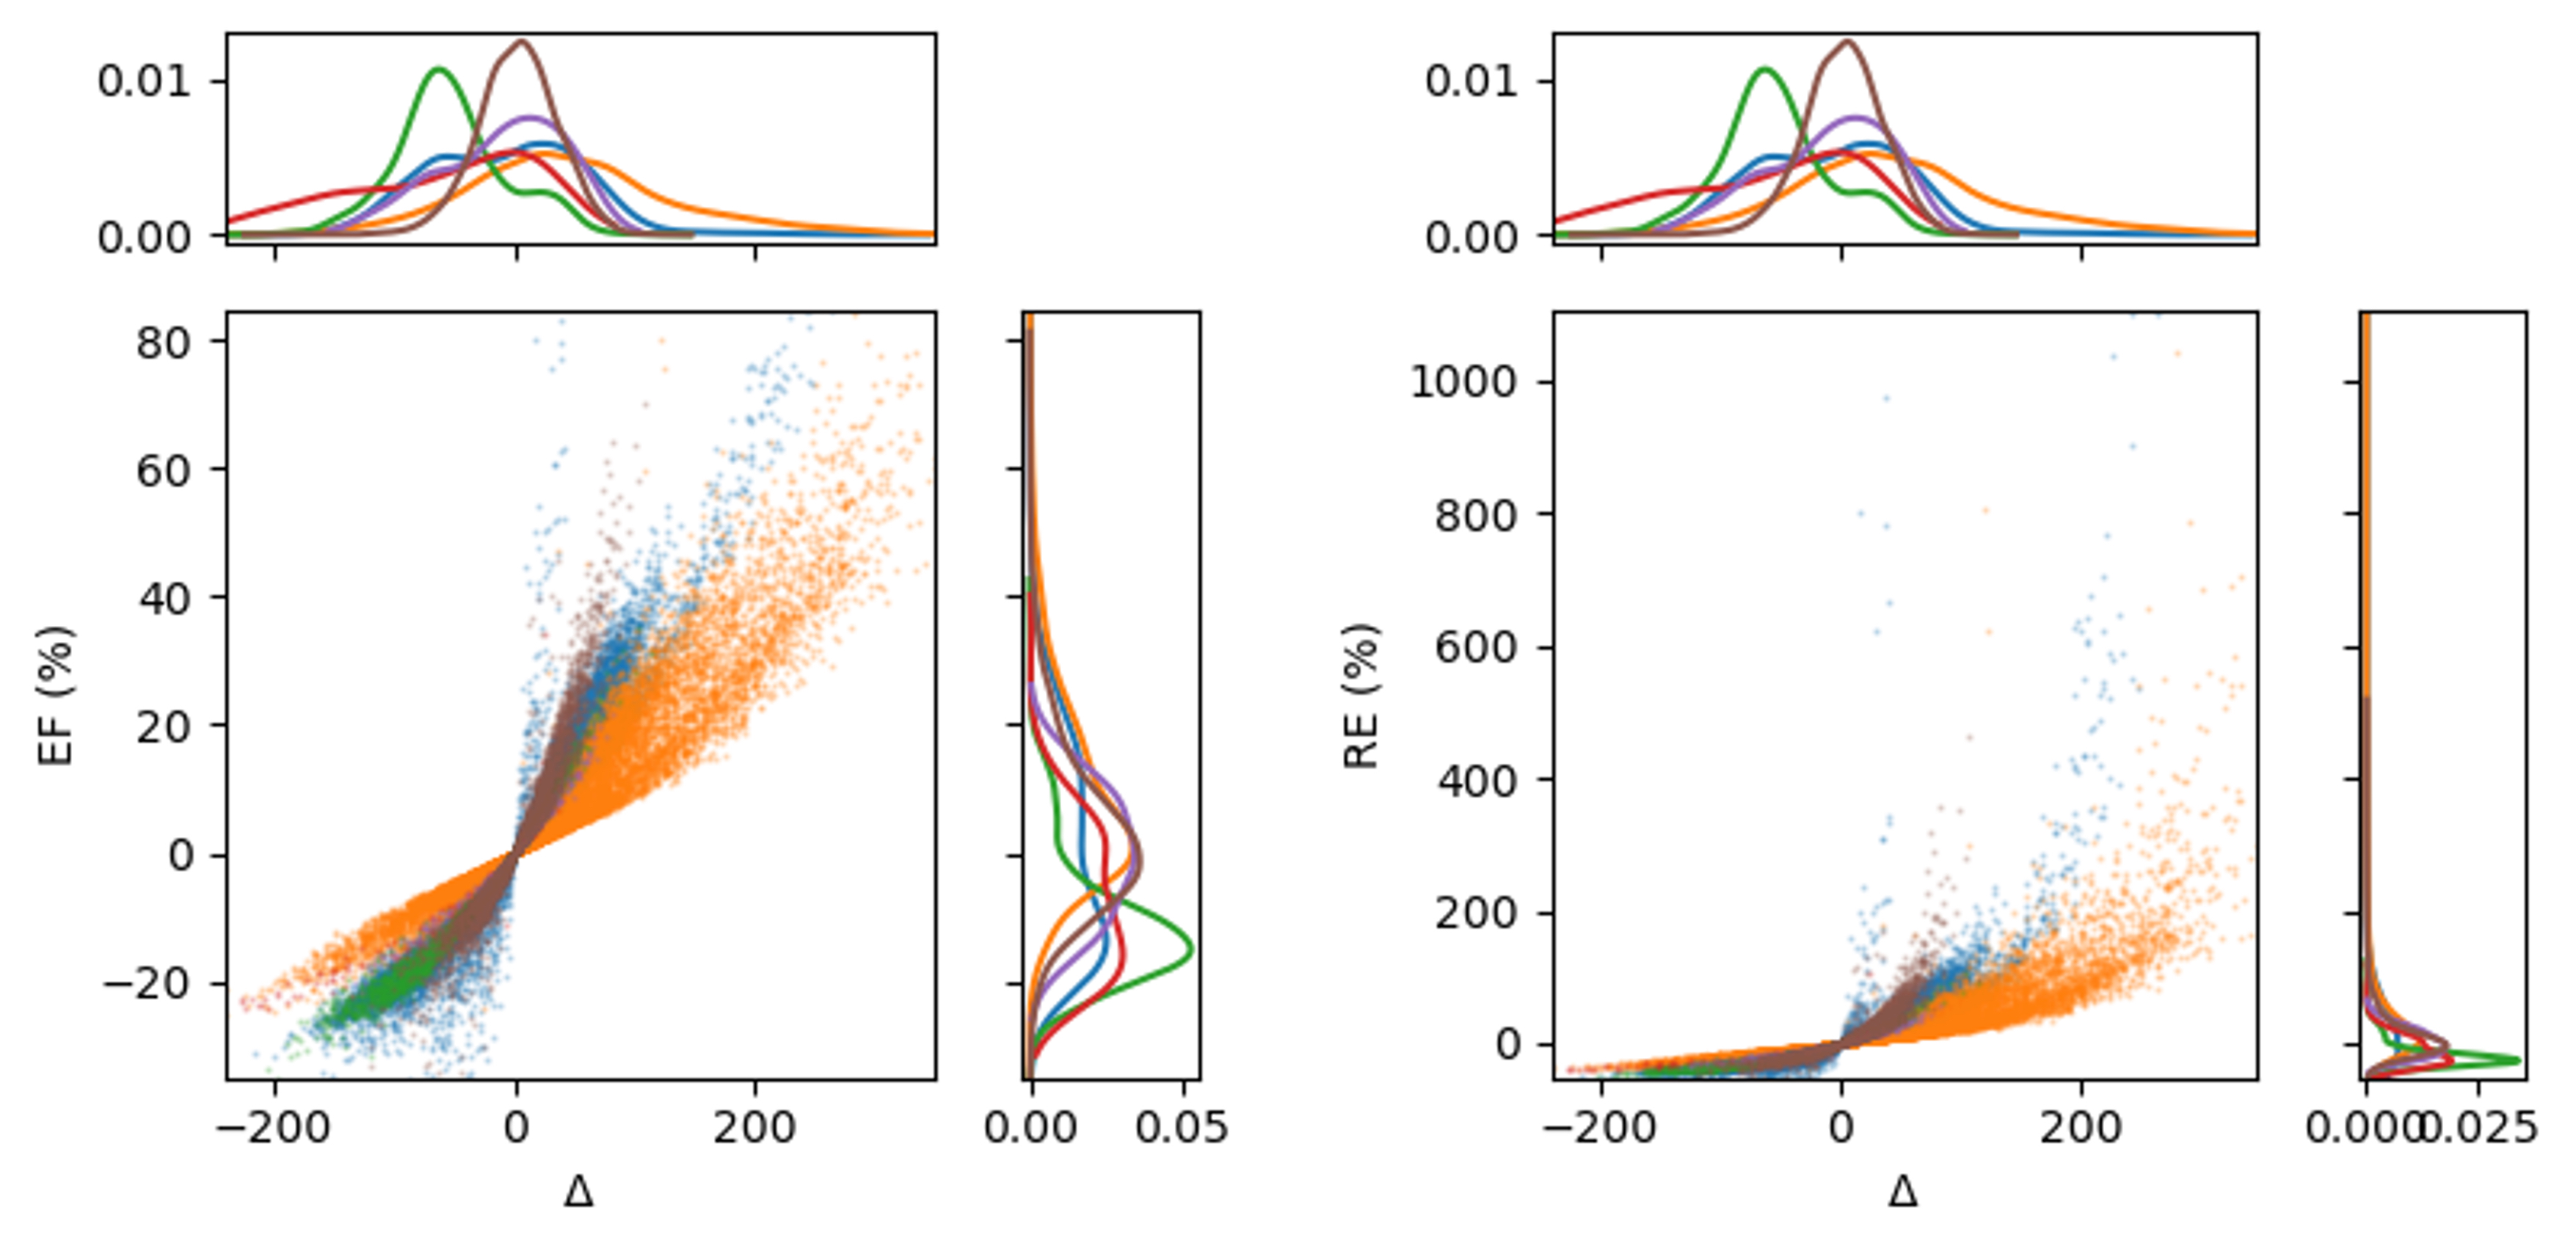
Figures 4 and 5 illustrate scanner plots of EF and RE with $$$\bigtriangleup$$$, including marginal kerenel distributions in healthy brain and tumour respectively. These plots indicate that RE is more prone to outliers, which may explain the lower correlation with $$$\bigtriangleup$$$. The average overlap of EF distributions was 5.69% higher for EF compared to $$$5.69\%$$$, but $$$13.25\%$$$ lower for RE in healthy brain. Similarly, the average overlaps were $$$3.84\%$$$ higher for EF and $$$2.88\%$$$ lower for RE in tumour regions indicating that the inter-patient spread in RE values is higher than for $$$\bigtriangleup$$$, which in turn is higher than for EF.
Conclusion
Our study demonstrates that quantification of CCA imaging might be best provided by calculating the enhancement fraction. Whilst it provides little visual advantage over relative enhancement, it offers better statistical properties in terms of fewer outliers and hence better correlation with conventional difference images. Such maps could offer valuable insights into differentiating tumour progression from treatment-related enhancement in patients with brain metastases and may pave the way for standardization of the imaging technique as a response biomarker in treatment trials.Acknowledgements
This project represents independent research funded by the National Institute for Health and Care Research (NIHR) Biomedical Research Centre at The Royal Marsden NHS Foundation Trust and The Institute of Cancer Research, London, and by the Royal Marsden Cancer Charity. The views expressed are those of the author(s) and not necessarily those of the NIHR or the Department of Health and Social Care.References
1. De Wit, M. C. Y., De Bruin, H. G., Eijkenboom, W., Smitt, P. S. & Van Den Bent, M. J. Immediate post-radiotherapy changes in malignant glioma can mimic tumor progression. Neurology 63, 535–537 (2004).2. Brandsma, D., Stalpers, L., Taal, W., Sminia, P. & van den Bent, M. J. Clinical features, mechanisms, and management of pseudoprogression in malignant gliomas. Lancet Oncol. 9, 453–461 (2008).
3. Zach, L. et al. Delayed contrast extravasation MRI: a new paradigm in neuro-oncology. Neuro-Oncol. 17, 457–465 (2015).
4. Zach, L. et al. Delayed Contrast Extravasation MRI for Depicting Tumor and Non-Tumoral Tissues in Primary and Metastatic Brain Tumors. PLoS ONE 7, e52008 (2012).
5. O’Connor, J. P. B. et al. Imaging biomarker roadmap for cancer studies. Nat. Rev. Clin. Oncol. 14, 169–186 (2017).
6. Mugler, J. P. & Brookeman, J. R. Three‐dimensional magnetization‐prepared rapid gradient‐echo imaging (3D MP RAGE). Magn. Reson. Med. 15, 152–157 (1990).
7. Brant-Zawadzki, M., Gillan, G. D. & Nitz, W. R. MP RAGE: a three-dimensional, T1-weighted, gradient-echo sequence--initial experience in the brain. Radiology 182, 769–775 (1992).
8. Yushkevich, P. A. et al. User-guided 3D active contour segmentation of anatomical structures: significantly improved efficiency and reliability. Neuroimage 31, 1116–1128 (2006).
9. Jenkinson, M., Pechaud, M. & Smith, S. BET2: MR-based estimation of brain, skull and scalp surfaces. in Eleventh annual meeting of the organization for human brain mapping vol. 17 167 (Toronto., 2005).
10. Zhang, Y., Brady, M. & Smith, S. Segmentation of brain MR images through a hidden Markov random field model and the expectation-maximization algorithm. IEEE Trans. Med. Imaging 20, 45–57 (2001).
11. Jenkinson, M., Beckmann, C. F., Behrens, T. E., Woolrich, M. W. & Smith, S. M. Fsl. Neuroimage 62, 782–790 (2012).
12. Blackledge, M. D. et al. Visualizing whole-body treatment response heterogeneity using multi-parametric magnetic resonance imaging. J. Algorithms Comput. Technol. 10, 290–301 (2016).
13. Pastore, M. & Calcagnì, A. Measuring Distribution Similarities Between Samples: A Distribution-Free Overlapping Index. Front. Psychol. 10, 1089 (2019).
Figures