3836
Differentiation between high-grade gliomas and solitary brain metastases: a comparison of five diffusion weighted MRI models1Department of radiology, Affiliated Hospital of North Sichuan Medical College, nanchong, SIchuan, China, 2MR Research Collaboration, Siemens Healthineers, Chengdu, China, 3Shanghai Key Laboratory of Magnetic Resonance, East China Normal University, Shanghai, China, 4MR Research Collaboration, Siemens Healthineers, Shanghai, China, 5MRI clinical application, Customer Service Department, Siemens Digital Medical Technology, Shanghai, China
Synopsis
Keywords: Tumors (Pre-Treatment), Diffusion/other diffusion imaging techniques
Motivation: Differentiating high-grade gliomas (HGGs) from solitary brain metastases (SBMs) using conventional MRI remains challenging due to similar imaging features.
Goal(s): Evaluating the diagnostic performance of advanced diffusion models, like NODDI and MAP, against traditional techniques like DWI, DTI and DKI in distinguishing HGGs from SBMs.
Approach: Using a 12-minute sequence, parameters of NODDI, MAP, DKI, DTI, and DWI were reconstructed using specialized postprocessing tools.
Results: NODDI_Viso was the most effective parameter in distinguishing HGGs from SBMs, and combining parameters of DTI_AD, DTI_RD, MAP_MSD and NODDI_Viso further enhanced classification accuracy.
Impact: Combined models from DTI, MAP and NODDI shows promise as sensitive imaging biomarkers for neuro-oncology and potentially improves treatment strategies for HGGs and SBMs.
Introduction
High-grade gliomas (HGGs) are common malignant brain tumors in adults1. Meanwhile, metastatic tumors in the brain are ten times more common than primary malignancy2. Although computed tomography (CT)/ Magnetic Resonance Imaging (MRI) can improve the diagnostic accuracy of HGGs and brain metastasis, differentiating them can be challenging due to similar radiological characteristics of necrotic centers, irregular enhancing margins, and peritumoral edema 3,4.Recently, advanced diffusion MRI techniques like neurite orientation dispersion and density imaging (NODDI) and mean apparent propagator (MAP)-MRI have been introduced to assess the brain microstructure4. It's unclear if these methods superior to the traditional techniques such as diffusion kurtosis imaging (DKI), diffusion tensor magnetic resonance imaging (DTI), and diffusion weighted imaging (DWI) in distinguishing between HGGs and solitary brain metastases (SBMs). In our study, we utilized one 12-minute MRI sequence, from which parameters for NODDI, MAP-MRI, DKI, DTI, and DWI were reconstructed. We then assessed the diagnostic performance of these parameters in differentiating HGGs from SBMs.Method
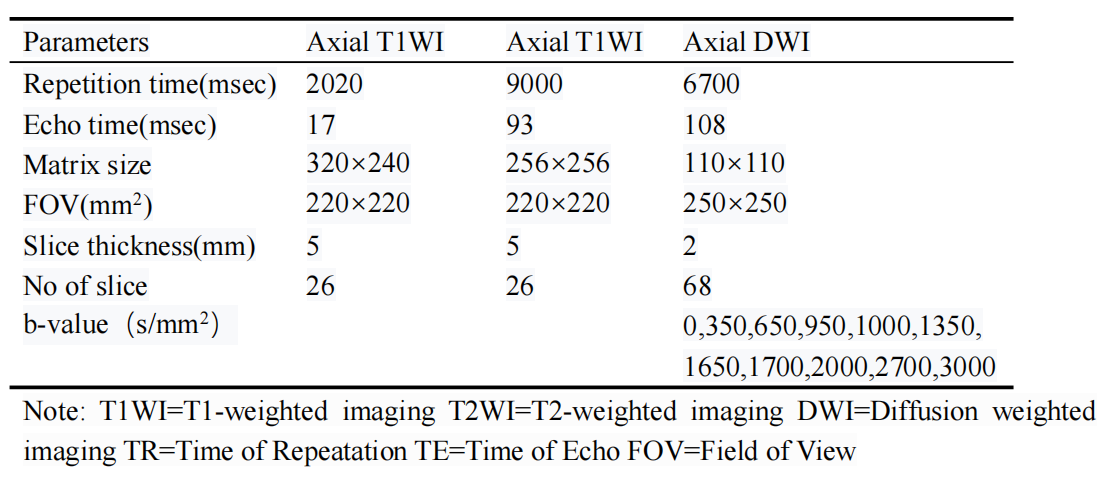
MR imaging: A total of 36 patients (HGGs = 17, SBMs = 19) with pathologically confirmed tumor lesions were included in this study. All patients included in our study underwent structural and diffusion MRI on a 3T scanner (MAGNETOM Skyra, Siemens Healthineers, Erlangen, Germany) with a 32-channel coil. The acquisition parameters of all MR sequences are shown in Table 1.Reconstruction & Segmentation: The NODDI, MAP-MRI, DKI, DTI and DWI models were reconstructed using an in-house postprocessing software (NeuDiLab) based on the open-resource tool DIPY (Diffusion Imaging in Python, https://dipy.org). All the region of interests(ROIs )were drawn on the registered postcontrast T1W images and T2W images using the open-source application ITK-SNAP. The enhanced areas on the postcontrast T1W images were defined as contrast-enhancing tumor ROIs, while T2W hyperintense signal indicated peritumoral edema ROIs. Areas of Necrosis, cysts, and hemorrhage areas were excluded.
Statistical Analysis: The diffusion parameters of the contrast-enhancing tumor and peritumoral edema were measured. An independent two sample t test and the Mann-Whitney U test were used to examine differences of single diffusion parameter. Receiver operating characteristic (ROC) analysis and the corresponding area under the ROC curve (AUC) were used to assess the performance of each parameter in tumor distinguishing. The SPSS software (version 26.0) were used for all the statistical analysis, with a significant level set to p values < 0.05.
Result
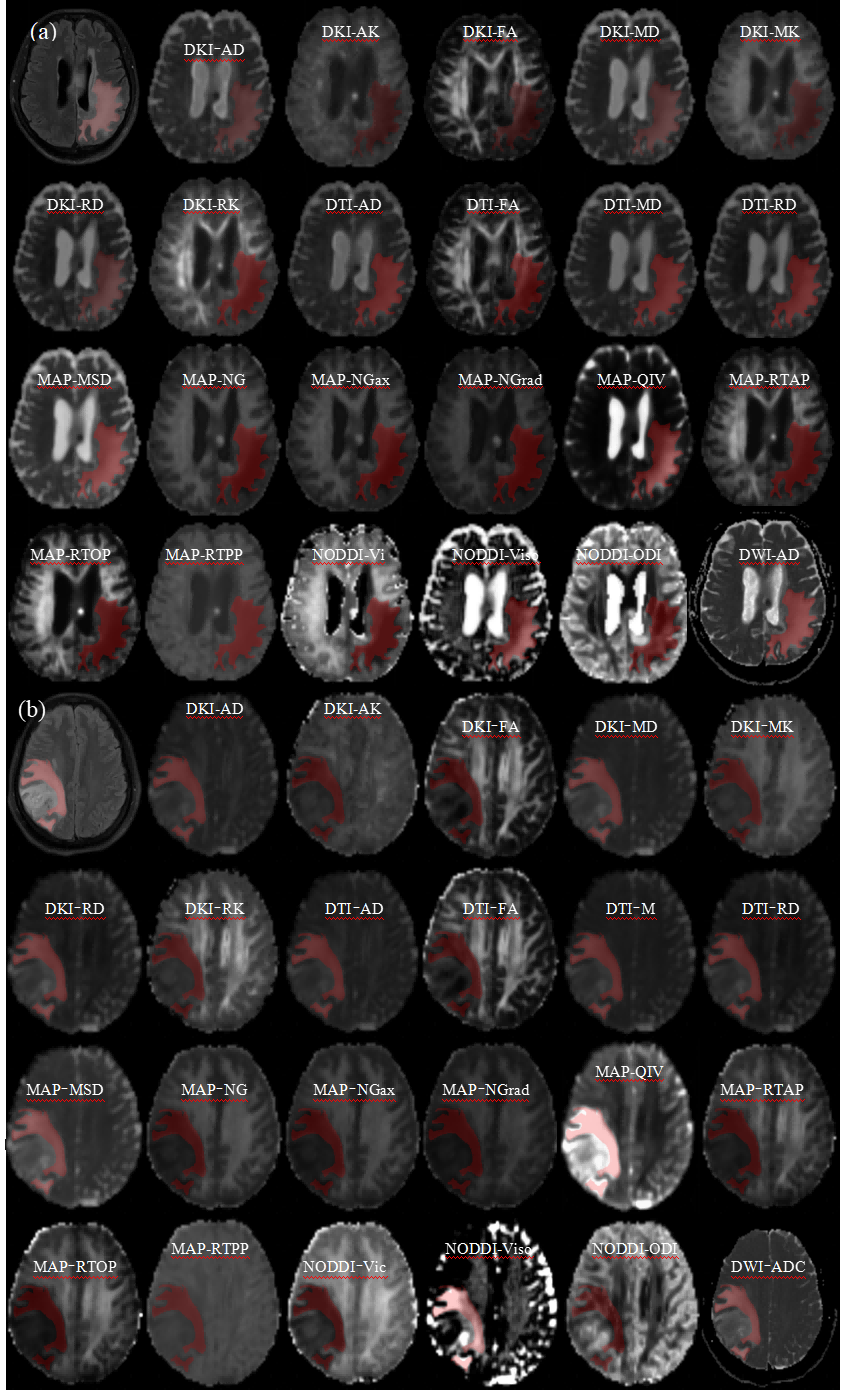
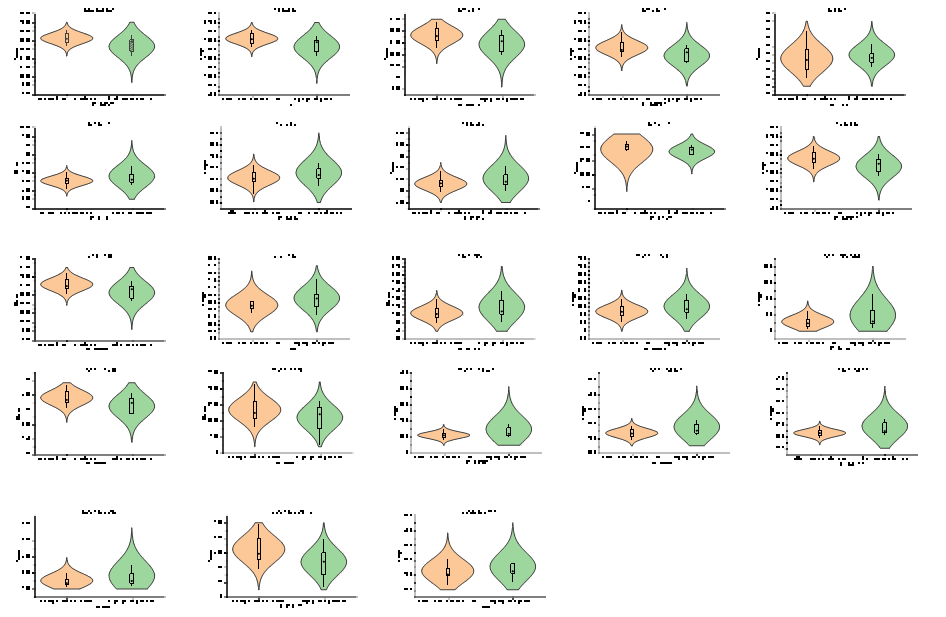
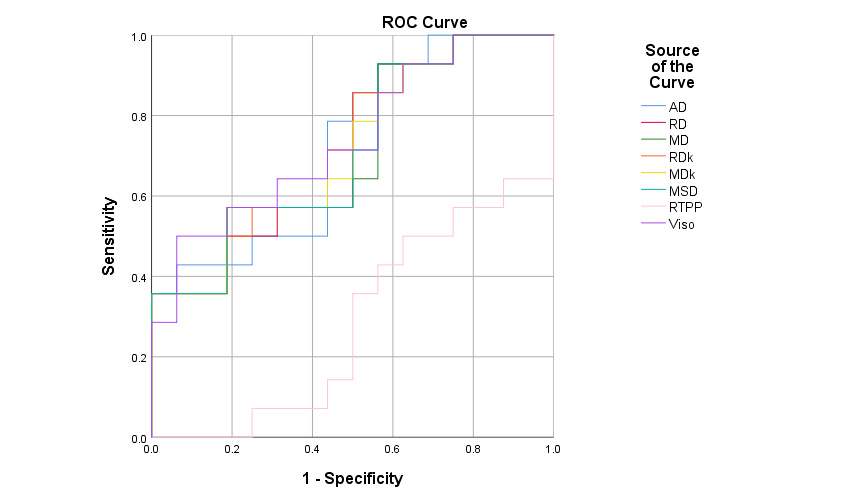
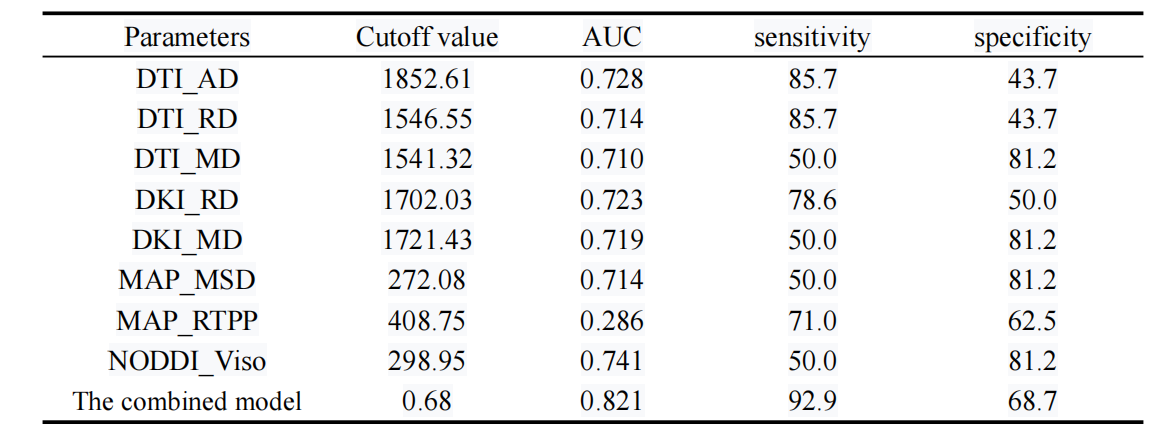
The mappings of diffusion parameters including DWI_ADC, DTI_AD, DTI_RD, DTI_MD, DTI_FA, DKI_AK, DKI_RK, DKI_MK, DKI_AD, DKI_RD, DKI_MD, DKI_FA, MAP_NG, MAP_NGax, MAP_NGrad, MAP_MSD, MAP_QIV, MAP_RTOP, MAP_RTAP, MAP_RTPP, NODDI_Vic, NODDI_Viso, NODDI_ODI from one patient with HGG and one with SBM are shown in Figure 1. As showing in Figure 2, DTI_AD, DTI_RD, DTI_MD, DKI_RD, DKI_MD, MAP_MSD and NODDI_Viso of the peritumoral edema were significantly lower in the HGGs than in the SBMs (all p<0.05). The MAP_RTPP of the peritumoral edema were significantly higher in the HGGs than in the SBMs (p = 0.044). No significant differences were found among all other diffusion parameters in the contrast-enhancing tumors or peritumoral edema between the two groups (p > 0.05).Figure 3 and Table 2 showed the ROC curves and the corresponding AUCs of these parameters with NODDI_Viso having the highest AUC value of 0.741 in differentiating HGGs from SBMs. When combined to create a multiparametric logistic regression model, the combined model of DTI_AD, DTI_RD, MAP_MSD and NODDI_Viso showed better diagnostic efficacy(AUC: 0.821, 95% CI:0.671 to 0.972 sensitivity:92.9, specicity: 68.7) than any single parameter models.Discussion
NODDI is a biophysical model separating neural tissue signal into three compartments, including restricted, hindered, and isotropic diffusion, modelingaxonal fibers dispersion. HGGs have enlarged extracellular space with an accumulation of matrix components like tenascin , causing less isotropy in DWI. In contrast, metastatic brain tumors degrade the extracellular matrix with heparanase and matrix metalloproteinases, thereby growing into the brain parenchyma in an expansive and noninfiltrating pattern, leading to higher DWI isotropy. These observations were consistent with histopathological studies5. The diagnostic performance of the combined model was enhanced through the incorporation of diverse diffusion parameters. DTI_AD and DTI_RD provided insights into the directionality and magnitude of water diffusion, MAP_MSD offered data on the extent of diffusion restriction, and NODDI_Viso contributed information on tissue anisotropic diffusion. These multi-parameters allowed for a more detailed evaluation of the peritumoral edema area of the tumor.Conclusion
Advanced diffusion MRI parameters, especially NODDI_Viso, improved the differentiation of HGGs from SBMs. A combined model offered improved diagnostic accuracy, suggesting a potential refinement of MRI protocols for brain tumor assessment.Acknowledgements
No acknowledgement found.References
1. Louis D N, Perry A, Reifenberger G, et al. The 2016 World Health Organization Classification of Tumors of the Central Nervous System: a summary. Acta Neuropathol. 2016;131(6): 803-20.
2. Lapointe S, Perry A, Butowski N A. Primary brain tumours in adults. Lancet. 2018; 392(10145): 432-446.
3. Artzi M, Bressler I, Ben Bashat D. Differentiation between glioblastoma, brain metastasis and subtypes using radiomics analysis. J Magn Reson Imaging. 2019; 50(2): 519-528.
4. Ozarslan E, Koay C G, Shepherd T M, et al. Mean apparent propagator (MAP) MRI: a novel diffusion imaging method for mapping tissue microstructure. Neuroimage. 2013; 78: 16-32.
5. Martin-Noguerol T, Mohan S, Santos-Armentia E, et al. Advanced MRI assessment of non-enhancing peritumoral signal abnormality in brain lesions. Eur J Radiol. 2021; 6:143-149.
Figures