3833
The effects of different expression states of δ-catenin on resting brain functional in patients with breast cancer before treatment1Radiology, First Affiliated Hospital of Dalian Medical University, Dalian, China
Synopsis
Keywords: Tumors (Pre-Treatment), Cancer
Motivation: δ-catenin is the only member of the p120ctn family that can be expressed in neurons. It has been confirmed that δ-catenin highly expressed in breast cancer patients and is significantly associated with the poor prognosis.
Goal(s): Explore the changes of brain network function in BRCA patients with different expressions of δ-catenin before treatment.
Approach: Categorize untreated BRCA patients into two groups based on the different expressions of δ-catenin,and subjected to neuropsychological testing, brain structural and functional MRI, along with a healthy control group.
Results: The breast cancer patients with different δ-catenin expression have different effects on the indexes of brain functional network.
Impact: The research results suggest that the brain-network changes caused by δ-catenin precede cognitive impairment changes. Early brain damage caused by δ-catenin protein may involve areas related to executive functions and emotional regulation.
Introduction
δ-catenin is the only member in the p120ctn family capable of being expressed in neurons. It has been confirmed that δ-catenin highly expressed in breast cancer (BRCA) patients and is significantly associated with the poor prognosis. The aim of this study was to find the impact of different expressions of δ-catenin on brain network function before treatment.Methods
Collected untreated BRCA patients and categorize them into two groups based on the different expression states of δ-catenin protein. The patients were divided into high expression group (DH) and low expression group (DL), and 36 healthy controls (HC). These three groups were subjected to neuropsychological testing, brain structural and brain functional magnetic resonance imaging. All MRI data are analyzed and counted using GRETNA and SPM12 toolkits on MATLAB software.Results
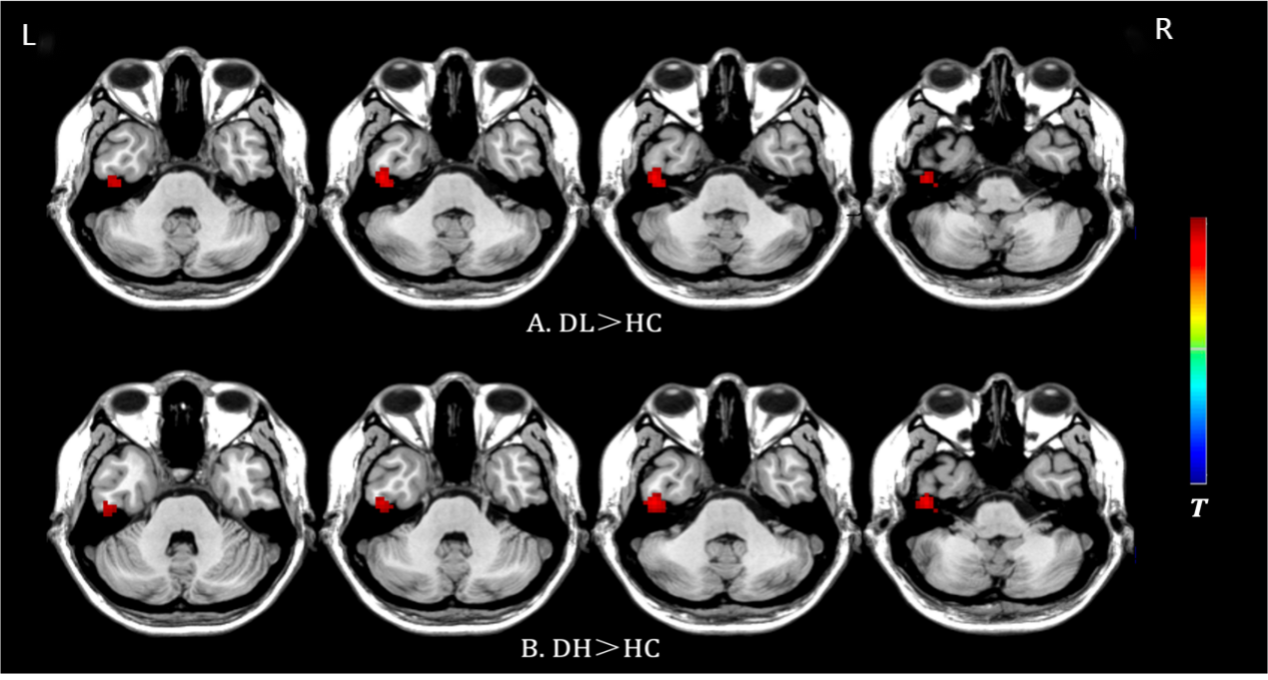
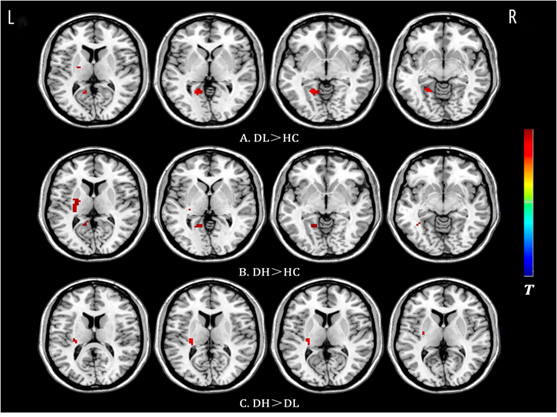
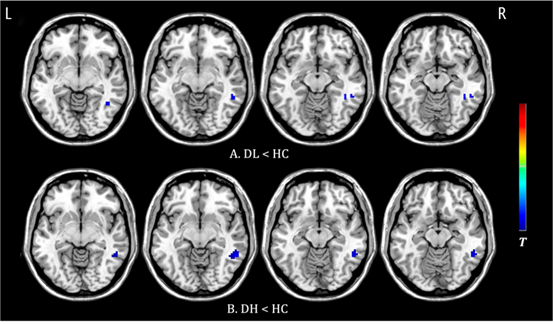
Her-2 in DH group was significantly higher than that in DL group. The fALFF value of left inferior temporal gyrus in DL and DH groups was higher than that in HC group. FCS index of left lingual gyrus and left putamen in DL group was higher than that in HC group. The left putamen, left fusiform gyrus and left Calcarine fissure cortex in DH group were higher than those in HC group, and there were differences in left inferior temporal gyrus, left putamen and left fusiform gyrus between DH and DL groups, and DH>DL. In ReHo index, comparison between HC group, the consistency of right middle temporal gyrus, right inferior temporal gyrus and right fusiform gyrus decreased in DL group, but the DH group comparison between HC group, only the consistency of the right inferior temporal gyrus decreased.Discussion
1.Some studies suggest a synergistic interaction between δ-catenin and Her2. δ-catenin is believed to promote the expression of cell cycle proteins Cyclin D1, Cdc34, and facilitate the phosphorylation of Her-2, resulting in its tumor-promoting effects. The findings indicate a significantly higher expression of Her-2 in the DH group compared to the DL group, resembling previous research, indirectly indicating the association between elevated δ-catenin expression and malignant behavior in breast cancer cells.2.In this study, both the DL and DH groups showed increased fALFF values in the left temporal lobe compared to the HC group, indicating enhanced neuronal brain activity in this region. Furthermore, the results from the FCS analysis for all three groups showed that, whether in the DL or DH group, the connectivity strength in some brain regions was stronger compared to the HC group. The reasons could be twofold. On one hand, the participants in the study were all right-handed, which typically results in a dominant left hemisphere in the brain, making it more susceptible to external stimuli. On the other hand, it might be related to differences in the functional specialization of the bilateral hemispheres in the frontal and parietal networks, possibly associated with increased cerebral blood flow. The author speculates that after cancer diagnosis, patients anticipate the negative effects , which may lead to the recruitment of neurons and increase in spontaneous activity in emotion-related brain regions such as the frontal lobe, temporal lobe, and basal ganglia. This, in turn, helps establish an early balance between inhibition and excitation in the brain's networks, maintaining normal cognitive functions in the early stages.
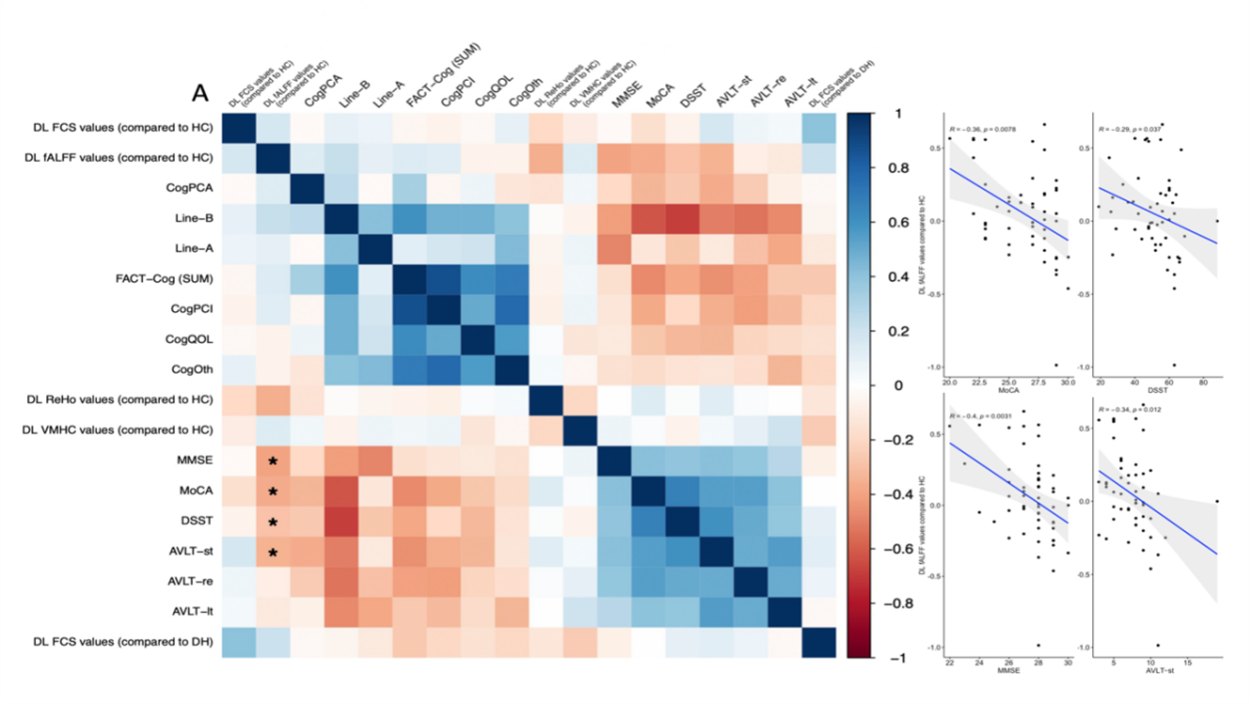
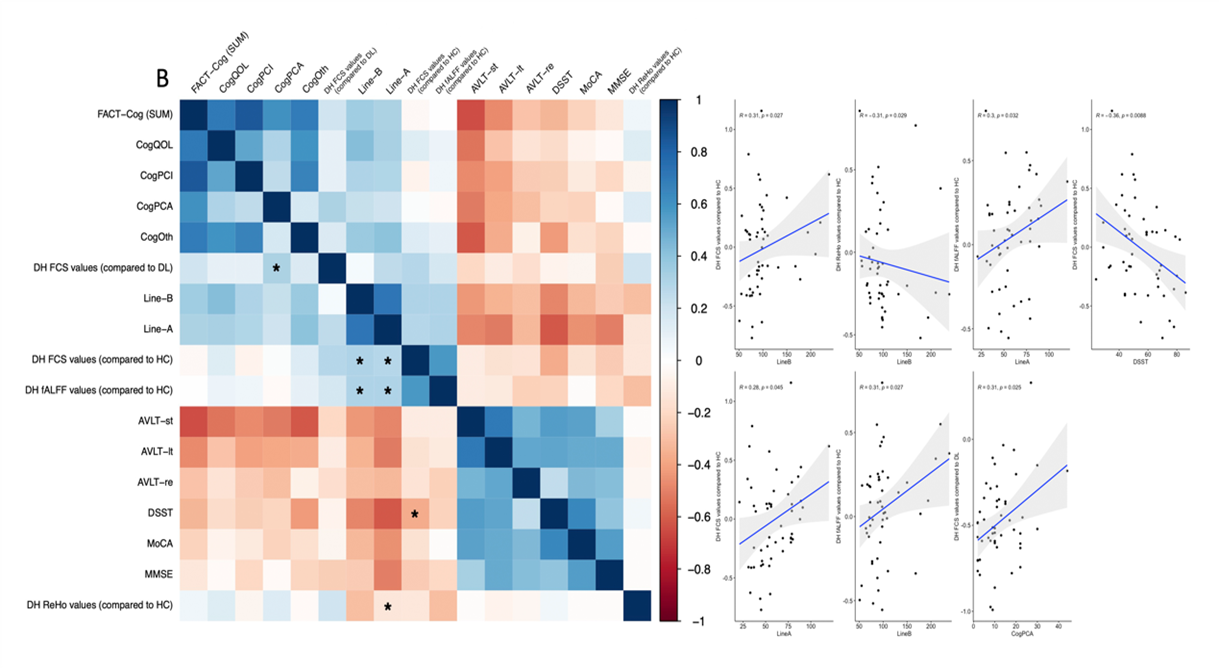
3.In terms of FCS indicators, there were statistically significant differences between the DH and DL groups in the left lentiform nucleus, left temporal lobe, and left fusiform gyrus, with higher values in the DH group compared to the DL group. In the absence of any treatment or the influence of covariates such as Her-2, this indirectly suggests that the high expression of δ-catenin in breast cancer patients has a unique impact on these brain regions. In this study, the DH group showed correlations between fALFF, FCS, ReHo values in different brain regions and neuropsychological scores. The results of the multivariate linear regression model indicated significant differences between FCS values and DSST, AVLT in the DH group, while there were no differences in the DL group. Additionally, the t-test results for neuropsychological scores in both groups showed differences in memory (both short-term and long-term memory). This aligns with the presence of different brain network alterations associated with different proteins in this study. It indirectly suggests that the characteristic impact of the δ-catenin protein on the temporal lobe in breast cancer patients is one of the reasons for the clinical symptom of memory decline.
Conclusion
The BRCA patients with different δ-catenin expression have different effects on the indexes of brain functional network, which has high clinical significance for the prevention and prognosis of BRCA patients.Acknowledgements
References
[1]Tim Pieters, Steven Goossens, Lieven Haenebalcke, et al.p120 Catenin-Mediated Stabilization of E-Cadherin Is Essential for Primitive Endoderm Specification.[J].PLoS genetics,2016,12(8):e1006243.
[2]Fei Huang, Junying Chen, Zeng Wang, et al. δ-Catenin promotes tumorigenesis and metastasis of lung adenocarcinoma.[J].Oncology reports,2018,39(2):809-817.
[3]]Mijin Lee, İsa Taş, Rui Zhou, et al. Development of a Multiplex Bead-Based Method for the Microquantitation of δ-Catenin.[J].Journal of nanoscience and nanotechnology,2020,20(9):5819-5822.
[4]Yingjie Shen, Hyoung Jae Lee, Rui Zhou, et al. δ-Catenin Participates in EGF/AKT/p21<sup>Waf</sup> Signaling and Induces Prostate Cancer Cell Proliferation and Invasion[J].International journal of molecular sciences,2021,22(10).
[5]Di Zhang, JunYi Zhang, En-Hua Wangl. δ-catenin promotes the malignant phenotype in breast cancer[J]. Tumour biology: the journal of the International Society for Oncodevelopmental Biology and Medicine,2015,36(2):569-575.
[6]Chenfei Huang, Steven Verhulst, Yi Shen, et al.AKR1B10 promotes breast cancer metastasis through integrin α5/δ-catenin mediated FAK/Src/Rac1 signaling pathway[J].Oncotarget,2016,7(28):43779-43791.
[7]李占勇,刘志杰,李蕾,等. δ-catenin通过PI3/AKT信号通路促进乳腺癌细胞上皮问质转化的机制研究[J].《北京医学》2022,44(11):974-983.
[8]Rui Zhou, Yi Yang, So-Yeon Park, et al. p300/CBP-associated factor promotes autophagic degradation of δ-catenin through acetylation and decreases prostate cancer tumorigenicity[J].Sci Rep. 2019 Mar 4;9(1):3351.
[9]Yingjie Shen,Hyoung Jae Lee,Rui Zhou,et al.δ-Catenin Participates in EGF/AKT/p21Waf Signaling and Induces Prostate Cancer Cell Proliferation and Invasion[J].Int J Mol Sci. 2021 18;22(10):5306.[10]Lincheng Ju, Liping Shan,Bo Yin,et al. δ-Catenin regulates proliferation and apoptosis in renal cell carcinoma via promoting β-catenin nuclear localization and activating its downstream target genes[J].Cancer Med.2020,9(6):2201-2212.
[11]Ron Bose, Henrik Molina, A Scott Patterson, et al. Phosphoproteomic analysis of Her2/neu signaling and inhibition[J].Proceedings of the National Academy of Sciences of the United States of America,2006,103(26):9773-9778.
[12]Shweta Prasad, Jitender Saini, Ravi Yadav, et al. Motor asymmetry and neuromelanin imaging: Concordance in Parkinson's disease[J].Parkinsonism Relat Disord,2018 Aug,53:28-32.
[13]Xingui Chen, Xiaoxuan He, Longxiang Tao, et al. The attention network changes in breast cancer patients receiving neoadjuvant chemotherapy: evidence from an arterial spin labeling perfusion study[J].Sci Rep, 2017 Feb 17;7:42684.
Figures