3832
In vivo application of MP-PCA denoising of quantitative T2* and magnetic susceptibility maps (QSM) in normal and pathological cerebral tissues1Department of Electrical Engineering, Tel Aviv University, Tel Aviv, Israel, 2University College London, London, United Kingdom, 3Department of Biomedical Engineering, Tel Aviv University, Tel Aviv, Israel, 4Sagol School of Neuroscience, Tel Aviv University, Tel Aviv, Israel, 5Center for Advanced Imaging Innovation and Research, New York University Langone Medical Center, New York, NY, United States
Synopsis
Keywords: Signal Modeling, Quantitative Susceptibility mapping
Motivation: Higher spatial resolution can increase the diagnosis quality of Quantitative Susceptibility Mapping (QSM) by improving the sensitivity to local field variations and minimizing partial volume effects, yet, at the cost of reduced signal-to-noise ratio (SNR).
Goal(s): Improve the SNR of high-resolution QSM data, while preserving structural properties of the tissue.
Approach: Use Marchenko-Pastur principal component analysis (MP-PCA) to denoise T2*-weighted images, and generate quantitative T2* and QSM maps with higher SNR.
Results: MP-PCA denoising was able to efficiently improve the SNR on numerical phantom and in vivo. Proof of concept is provided for healthy brain anatomy and for a patient with brain metastases.
Impact: Marchenko Pastur principal component analysis can be used to enhance the SNR of T2*-weighted images, T2* maps, and QSM maps while preserving the fine details of the tissue.
Introduction
Quantitative susceptibility mapping (QSM) is useful for a number of clinical applications such as tumor subclassification, acute and chronic multiple sclerosis lesions, probing microbleeds in traumatic brain injury, and differentiating between calcification and hemorrhage1. QSM data is typically acquired with ~1 mm3 isotropic resolution 2-4. Higher resolutions can contribute to the QSM contrast by providing more accurate mapping of local field variations, leading to improved phase contrast 4-6. This can promote improved diagnosis accuracy and reduce partial volume effects.Higher resolution, on the other hand, entails longer scan times, and lower signal-to-noise ratio (SNR) which can lower diagnosis quality. In previous work 7 we introduced a new technique for denoising T2*-weighted images using Marchenko-Pastur principle-component-analysis (MP-PCA) to achieve denoised QSM data. In this continued work we further investigate this denoising technique on a numerical phantom, at different SNRs, and provide a proof-of-concept application on healthy subjects, brain metastases, and sickle cell anemia.
Methods
MP-PCA denoising was done on multi-echo T2*-weighted images based on previous work 7-10. Kernel size was 2x2x2. Denoised images were then used to reconstruct T2* maps that were fitted using an exponential signal decay model, and QSM maps using an optimized pipeline 11.Numerical phantom validations were done on a cylinder containing four tubes assigned with magnetic susceptibility values of 120,180,240, and 300 [parts per billion], similar to the range of magnetic susceptibilities in routine clinical imaging of tissues with/without contrast agent. Gaussian noise was added to the phantom at SNRs=10,20, and repeated 16 times using different noise patterns. SNR maps of T2*-weighted images, T2* maps, and QSM maps were calculated, based on the 16 repetitions 12, and for each tube, before and after denoising.
MRI Scans: A healthy volunteer (subject-1) and a patient with brain metastases (subject-2) were imaged on a 3 Tesla, and a patient with sickle cell disease (subject-3) was imaged on a 1.5 Tesla after signing informed consent. Scans used a 3D gradient echo (GRE) protocol with the following parameters for subjects-1/2/3: [TE1 = 2.99/3.99/4.28 ms, ΔTE = 4.25/5.24/4.94 ms, Nechoes = 8/8/5, TR = 37/45/27.4 ms, FOV = 19.2x15.6x6.6 / 19.2x15.6x3.6 / 36.0x36.0x13.9 cm3, voxel size = 0.75x0.75x0.75 / 0.75x0.75x0.75 / 1.5x1.5x1.5 mm3, BW = 390/320/287 Hz/Px, acceleration factor of Grappa 2 for all scans].
Statistical analysis: Six regions-of-interest (ROIs) were segmented for the healthy patient using FreeSurfer software. SNR was calculated based on each ROI12. Mean and standard deviation (SD) of T2*-weighted data, T2* maps, and QSM values were also calculated for each ROI before and after denoising.
Results
Pre- and post-denoising T2*-weighted images of a numerical phantom are presented in Figure 1, alongside quantitative T2* and QSM maps. Single voxel decay curves for four different susceptibility values are also shown, demonstrating the effectiveness of the MP-PCA technique. T2* and QSM signal fitting is more robust when using denoised data, as demonstrated by the improved homogeneity of the fitted maps lower number of fitting errors (e.g., Figure 1I,K). The improvement in SNR of T2*-weighted images, T2* maps, and QSM maps, was 324, 460 and 304 % respectively (averaged across four tested tubes).Figure 2 presents results for a healthy brain. As can be seen in the zoomed insets, the denoised images and maps fully retain the fine details and edges with no visible blurring compared to the original data.
Summary of the analysis of healthy brain data is presented in Table 1. An average improvement of 74.2 % in SNR was achieved across the six assayed ROIs. It is evident that the denoising process introduces no bias to the QSM values, as attested by the consistency of the mean values pre- / post-denoising.
Figure 3 presents data of a patient with brain metastasis. As can be seen (e.g., in Figure 4L), the MP-PCA denoising causes no loss of information in the output images and maps.
Figure 4 show a coronal slice of the sickle cell anemia patient, demonstrating how a typical streaking artifact caused by back-propagation calculation, which is part of the QSM pipeline, is significantly alleviated as well as the Gibbs artifacts.
Discussion
MP-PCA denoising of T2*-weighted images is highly efficient, even at low SNRs (10,20) and using a limited number of time points (NEchoes = 5,8). The resulting images show no loss of information and were further used to increase the SNRs of quantitative T2* and QSM maps at factors of 10-100% percent improvement. Proof-of-concept application of this denoising technique is provided for two pathological states, indicating its potential for improving the diagnostic quality of T2* and QSM data.Acknowledgements
No acknowledgement found.References
1. Eskreis-Winkler S, Zhang Y, Zhang J, et al. The clinical utility of QSM: disease diagnosis, medical management, and surgical planning. NMR in Biomedicine. 2017;30(4), e3668.
2. Langkammer C, Bredies K, Poser BA, et al. Fast quantitative susceptibility mapping using 3D EPI and total generalized variation. NeuroImage. 2015;111, 622–630.
3. Dimov Av, Gupta A, Kopell BH, & Wang Y. High-resolution QSM for functional and structural depiction of subthalamic nuclei in DBS presurgical mapping. Journal of Neurosurgery. 2019;131(2), 360–367.
4. Karsa A, Punwani S, & Shmueli K. The effect of low resolution and coverage on the accuracy of susceptibility mapping. Magnetic Resonance in Medicine. 2019;81(3), 1833–1848.
5. Wang Y, & Liu T. Quantitative susceptibility mapping (QSM): Decoding MRI data for a tissue magnetic biomarker. Magnetic Resonance in Medicine. 2015;73(1), 82–101.
6. Haacke EM, Liu S, Buch, et al. Quantitative susceptibility mapping: current status and future directions. Magnetic Resonance Imaging. 2015;33(1), 1–25.
7. Doniza L, Stern N, Radunsky D, et al. Proc Intr Soc Magn Reson Med, 2023, p. 2948.
8. Does MD, Olesen, JL, Harkins, KD, et al. Evaluation of principal component analysis image denoising on multi‐exponential MRI relaxometry. Magnetic Resonance in Medicine. 2019; mrm.27658.
9. Veraart J, Novikov DS, Christiaens D, et al. Denoising of diffusion MRI using random matrix theory. NeuroImage. 2016;142, 394–406.
10. , , et al. Mapping of magnetic resonance imaging’s transverse relaxation time at low signal-to-noise ratio using Bloch simulations and principal component analysis image denoising. NMR in Biomedicine. 2022;35(12):e4807.
11. Karsa, A, Punwani, S, Shmueli, K, et al. An optimized and highly repeatable MRI acquisition and processing pipeline for quantitative susceptibility mapping in the head-and-neck region. Magn Reson Med. 2020;84: 3206–3222.
12. Goerner FL, Clarke GD. Measuring signal-to-noise ratio in partially parallel imaging MRI. Med Phys. 2011 Sep;38(9):5049-57.
Figures
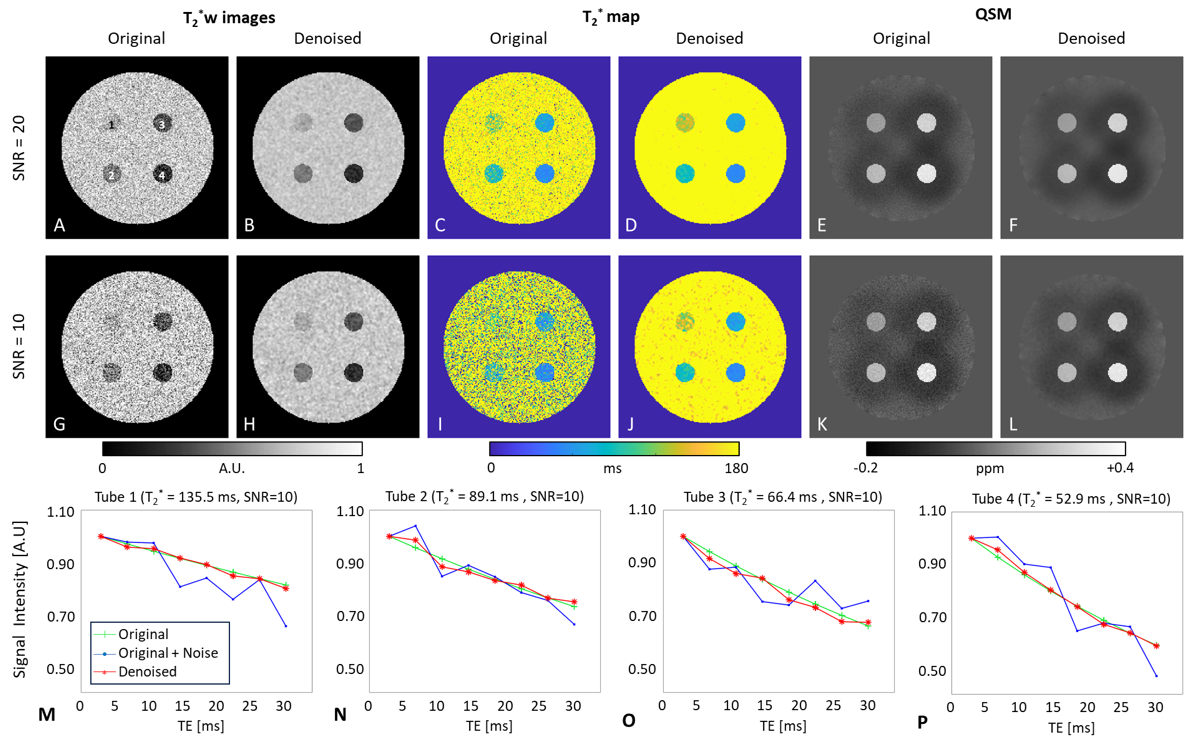
Figure 1: MP-PCA denoising of a numerical phantom. (A-B, G-H) T2*-weighted images (4th echo); (C-D, I-J) T2* maps and (E-F, K-L) QSM maps pre- and post-denoising. Simulations were done at low SNRs of 10 & 20. (M-P) Representative T2* decay curves from four simulated tubes at SNR = 10. The green line (‘+’ marker) denotes the original decay curve, the blue (‘·’ marker) denotes the original decay curve, added with noise, and the red line (‘*’ marker) denotes the denoised signal. Efficient denoising is achieved for all three data types and two SNRs without visible loss of information.
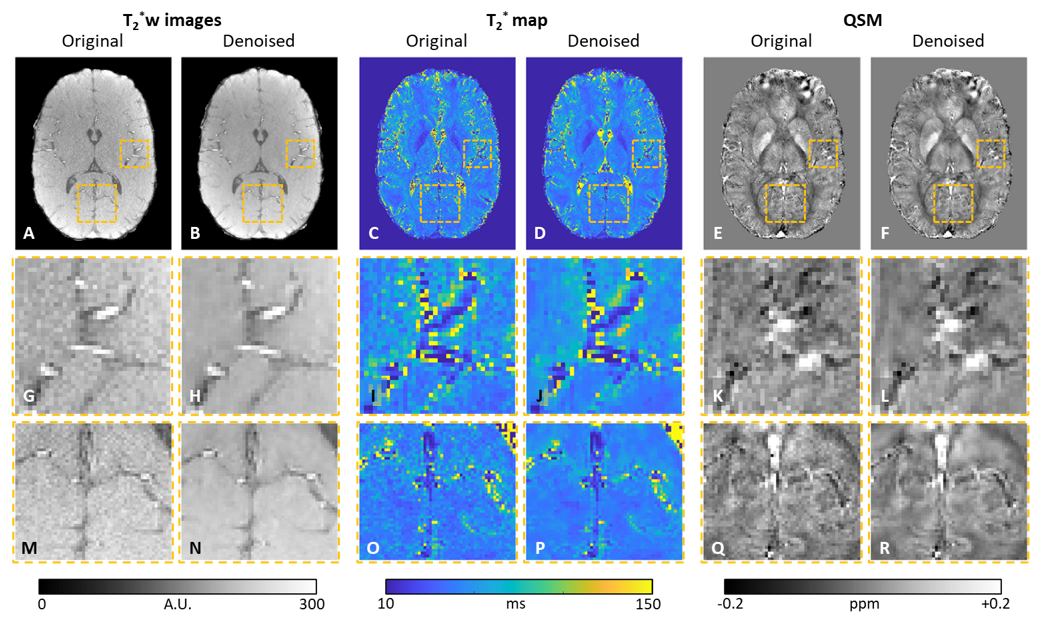
Figure 2: MP-PCA denoising of brain anatomy of a healthy subject. (A-B) T2*-weighted images (first echo), (C-D) T2* maps, (E-F) QSM maps pre- and post- denoising. Zoomed regions of interest are shown below each type of image/map (marked in orange dashed rectangles). Efficient denoising is achieved for all data types without visible loss of information.
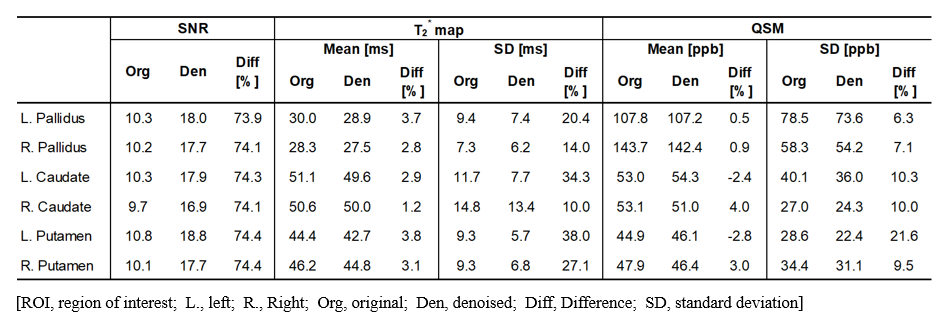
Table 1: SNR values for T2*-weighted images, alongside quantitative T2*, and QSM values pre- and post-denoising for six ROIs, segmented using Freesurfer for a healthy volunteer. A significant 74.2 ± 0.2 % increase in SNR was achieved across all ROIs, manifested mainly by a decrease in the intra-ROI SD of values. A slight decrease in mean T2* values was observed after denoising, caused by the removal of Rayleigh distributed noise at the tail of the T2* decay curve. No trend was observed in QSM values pre- / post- denoising, indicating that no bias was introduced during the denoising process.
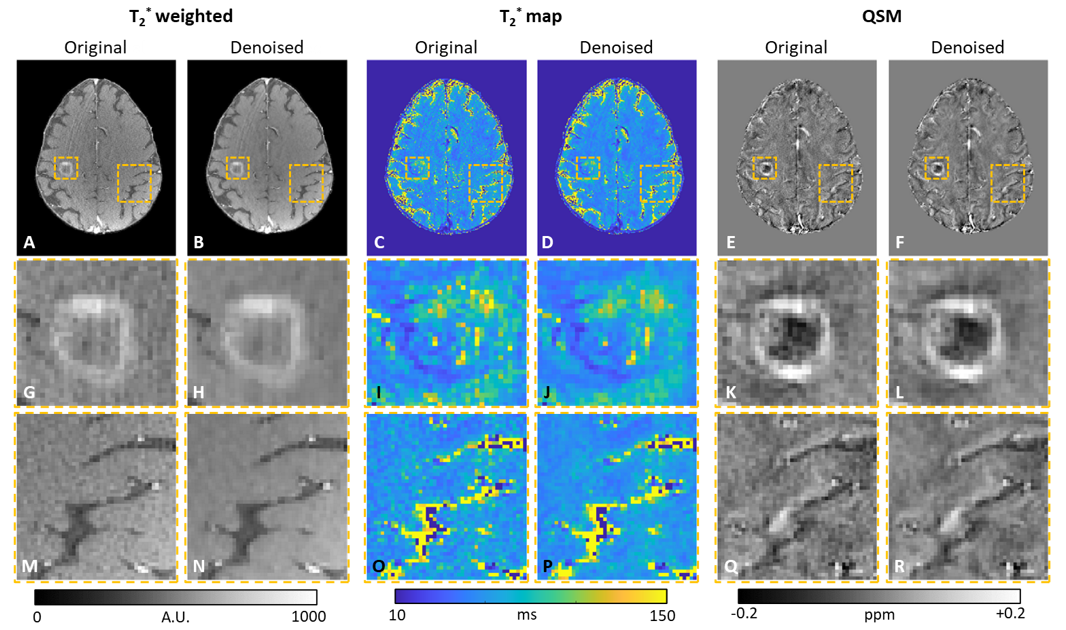
Figure 3: MP-PCA denoising of a patient with brain metastasis. (A-B) T2*-weighted image (first echo), (C-D) T2* maps, (E-F) QSM maps pre- and post denoising. Zoomed regions of interest are shown below each type of image / map (marked in orange dashed rectangles). Efficient denoising is achieved for all data types without visible loss of information.
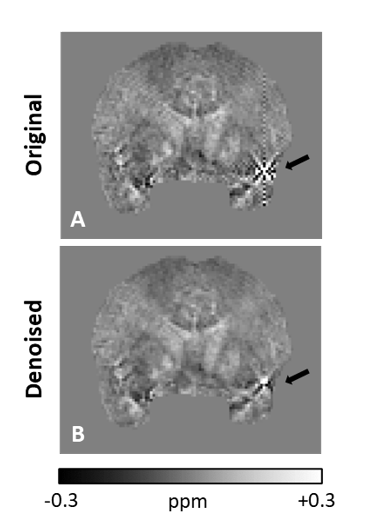
Figure 4: Utility of MP-PCA denoising for decreasing QSM map artifact, caused by pulsating blood flow, and manifesting as a vertical line along the phase-encoding dimension (top to bottom). Figure presents coronal brain slices of a QSM map pre- and post- denoising in a patient with sickle cell anemia. (A) Artifacts are presented in the pre-denoised image, marked with a black arrow. (B) Post-denoising map shows a significantly attenuated artifact.