3831
Rapid $$$T_{2}^{*}$$$ and Susceptibility Mapping using Poisson Wave Encoding and Model-Based Reconstruction1Department of Radiology, Computational Radiology Laboratory, Boston Children's Hospital, and Harvard Medical School, Boston, MA, United States, 2Martinos Center for Biomedical Imaging, Massachusetts General Hospital, and Harvard Medical School., Boston, MA, United States, 3Martinos Center for Biomedical Imaging, Massachusetts General Hospital, and Harvard Medical School., Charlestown, MA, United States, 4Donders Institute for Brain, Cognition and Behavior, Radboud University, Nijmegen, Netherlands
Synopsis
Keywords: Pulse Sequence Design, Data Acquisition, model-based recontruction; T2* mapping; QSM
Motivation: Harmonization of quantitative $$$T_{2}^{*}$$$ and susceptibility mapping is of critical interest in research and clinical studies, yet there are no available open-source, harmonized acquisition/reconstruction strategies.
Goal(s): To develop open-source sequences and reconstructions for quantitative $$$T_{2}^{*}$$$ and susceptibility mapping with high acceleration.
Approach: A 3D multi-echo GRE sequence with wave encoding was implemented on Pulseq. Model-based reconstruction was employed to estimate quantitative maps directly from undersampled k-space.
Results: Wave encoding improves quantitative mapping at R=12. While SENSE is more flexible with the choice of sampling patterns, model-based reconstruction performs best with wave-poisson sampling. The latter further improves $$$B_{0}$$$ mapping with less phase warps.
Impact: Open-source acquisition with advanced wave encoding and reconstruction have been implemented, which has the potential to facilitate the harmonization of highly-accelerated quantitative $$$T_{2}^{*}$$$, $$$B_{0}$$$ and susceptibility mapping.
Introduction
Harmonization of quantitative MRI, such as $$$T_{2}^{*}$$$ mapping and QSM, is of great importance and interest to the society. Yet, the currently recommended acquisition for QSM is a lengthy 3D multi-echo gradient echo (3DME-GRE) acquired axially to reduce acquisition time to ~6 min and be able to achieve 1 mm iso. resolution while using coils that might not be state-of-the-art [1-4], despite sacrificing the maximum echo time for most tissues in the brain (which have $$$ T_{2}^{*} > 40$$$ ms [5]).Wave encoding [6], Poisson sampling [7], and model-based reconstruction [8] are emerging techniques, which have been demonstrated separately to allow high accelerations of quantitative MRI with low artifact and SNR penalties. In this work, we combine the above advances to develop a high-resolution quantitative $$$T_{2}^{*}$$$ and susceptibility mapping technique utilizing open-source tools, Pulseq [9] and BART [10], to facilitate the harmonization of quantitative MRI.
Data and code to reproduce the results will be made public here: https://github.com/xqwang1/ismrm_2024.
Methods
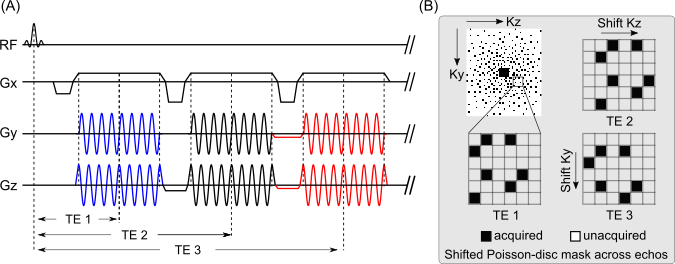
A 3D multi-echo GRE sequence with wave encoding was implemented on Pulseq (Figure 1A). Both fully-sampled and poisson-disc-based sampling masks were included in the sequence. To allow for complementary sampling across echos and also to minimize large gradient jumps, jittered blip gradients were further added to the multi-echo readout (Figure 1B). We further extended the MOdel-BAsed Reconstruction (MOBA) [11] to wave encoding, enabling a direct estimation of proton density $$$S_{0}$$$, $$$R_{2}^{*}$$$ and field inhomogeneity map $$$B_{0}$$$ from the acquired k-space. The estimation can be formulated by solving the following nonlinear inverse problem:$$\begin{aligned}\hat{x} = (S_{0}, R_{2}^{*}, fB_{0})^{T} = \text{argmin}_{x} \sum_{\text{TE}}\|P \cdot \mathcal{F}_{z} \cdot \mathcal{F}_{y} \cdot \text{W}(k_{x},y,z) \cdot \mathcal{F}_{x} \cdot C \cdot (S_{0}⋅e^{−\text{TE}⋅R_{2}^{*}+i2\pi⋅\text{TE}⋅fB_{0}}) - Y\|_{2}^{2} + R(x)\end{aligned}$$. Here $$$\mathcal{F}_{x}$$$, $$$\mathcal{F}_{y}$$$, and $$$\mathcal{F}_{z}$$$ represents Fourier transform along the $$$x$$$, $$$y$$$ and $$$z$$$-axis, respectively. $$$\text{W}(k_{x},y,z)$$$ is the point spread function of the wave-encoding gradients. $$$P$$$ is the sampling mask and $$$R(\cdot)$$$ represents regularization. A joint L1-Wavelet sparsity constraint was applied to $$$S_{0}$$$ and $$$R_{2}^{*}$$$ maps and Sobolev regularization was adopted for $$$fB0$$$ to enforce smoothness [11]. Wave-MOBA was implemented on BART [10]] and used GPU acceleration.Experiments
All MRI studies were conducted on 3 T (Siemens Prisma). A healthy volunteer was scanned using a 32-channel head/neck coil. The acquisition parameters were: FOV: $$$224\times224 \times192$$$ $$$\text{mm}^{2}$$$, matrix size: $$$224\times224 \times 192$$$, 6 echos with $$$\text{TR}$$$/$$$\text{TE}_{1-6}$$$ = 43.5/3.95/10.90/17.85/24.80/31.75/38.70 ms, FA = $$$15^{\circ}$$$, bandwidth 200 Hz/pixel. Wave used 8 sinusoidal cycles over the readout period with a gradient amplitude (Gmax) of 12 mT/m for both y and z directions. The experimental k-space trajectory of the wave gradients is estimated using [12].Results
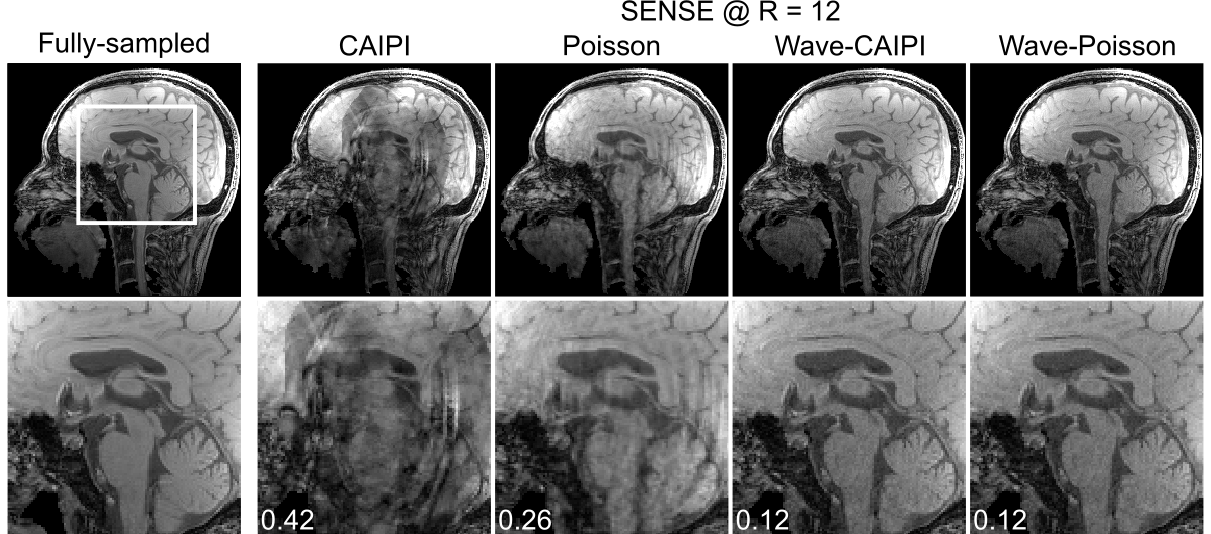
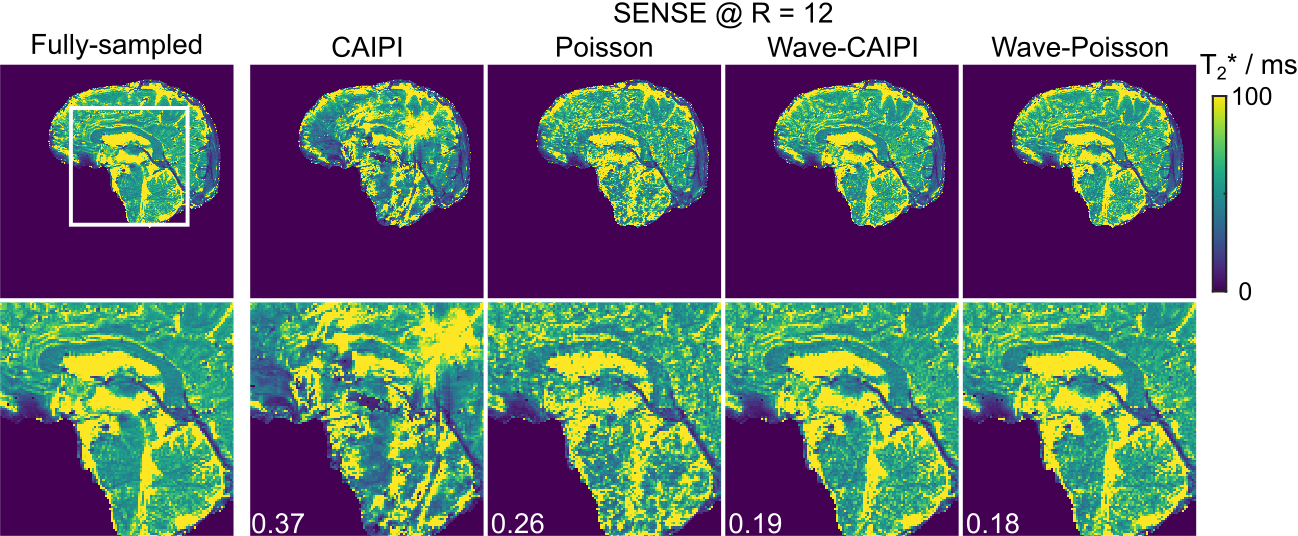
Figure 2 compares the parallel imaging reconstruction of the first echo image for retrospectively undersampled data with different patterns at an acceleration factor of 12. While conventional CAIPI and Poisson-disc sampling exhibit aliasing and blurring artifacts respectively, the additional wave-encoding helps to produce high-quality artifact-free images. This finding is further confirmed by the nrmse values.Figure 3 demonstrates the corresponding quantitative $$$T_{2}^{*}$$$ maps for Figure 2. In line with qualitative images, wave-encoding creates more accurate quantitative $$$T_{2}^{*}$$$ maps.
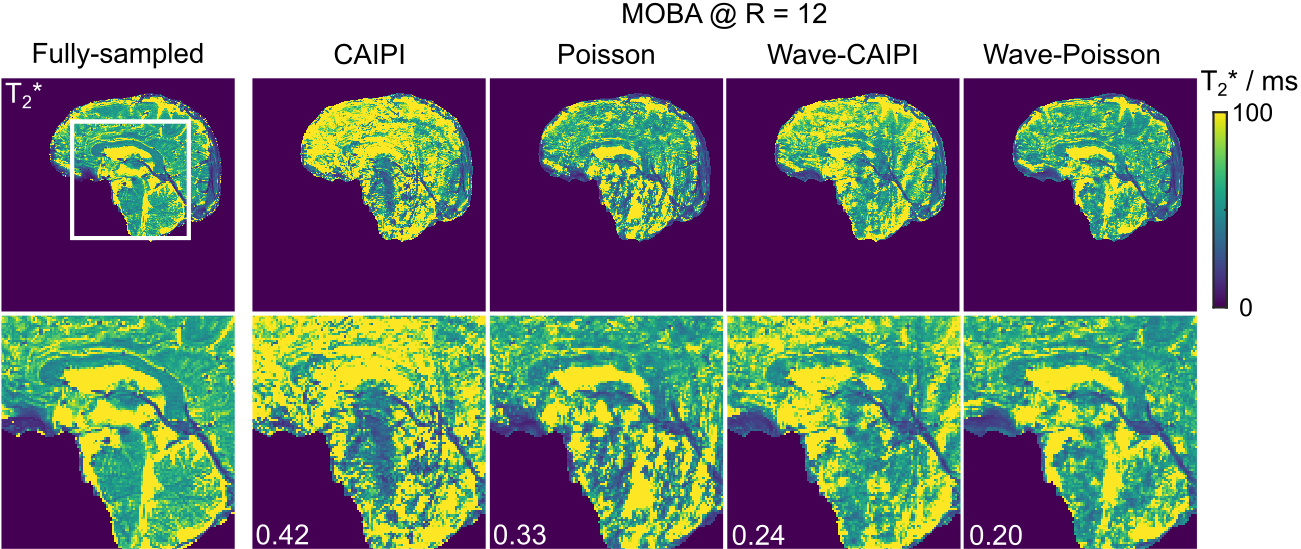
Figure 4 shows model-based reconstructed $$$T_{2}^{*}$$$ maps for the same data sets as the ones shown in Figures 2 and 3. Wave encoding also improves quantitative $$$T_{2}^{*}$$$ mapping in both cases. The wave poisson-disc sampling achieves the best performance. Note the nrmse errors from MOBA are generally larger than those from SENSE reconstruction. One possible reason might be the inaccuracy of our signal model in describing the underlying data (such as fat, and partial volume effects).
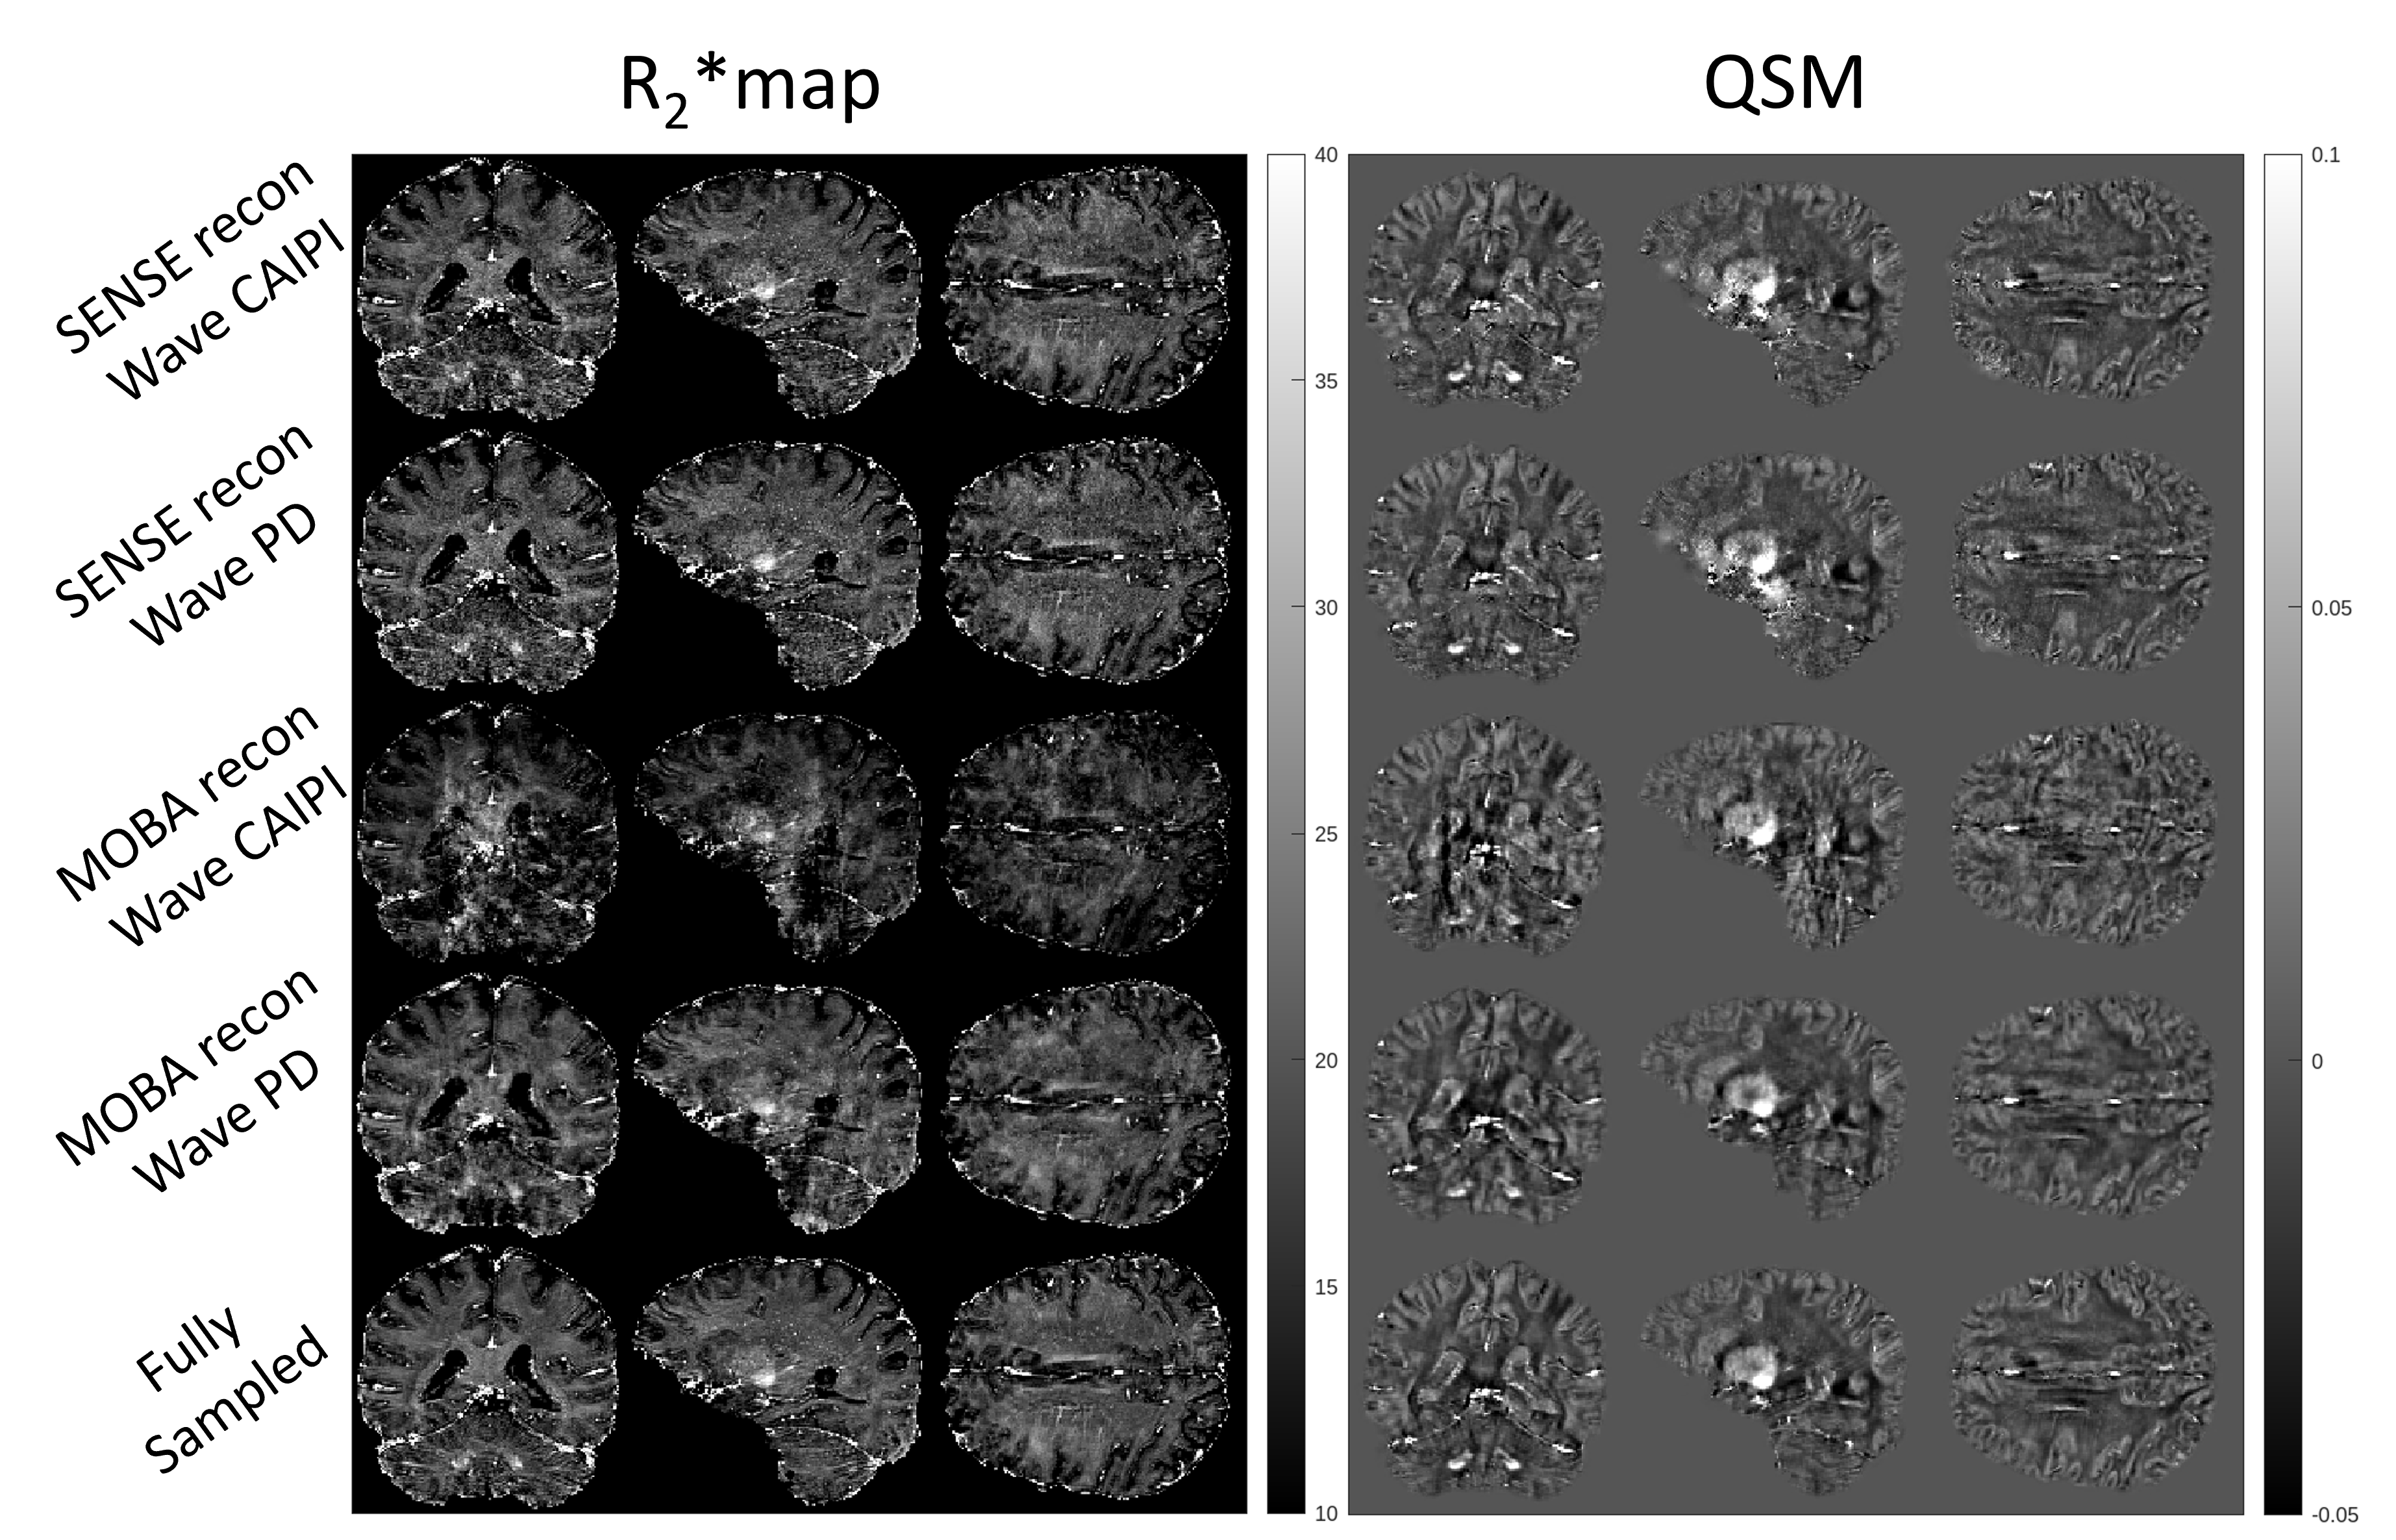
Figure 5 compares $$$R_{2}^{*}$$$ and QSM maps for both SENSE and model-based reconstructions using wave-encoding. Visual inspection shows that SENSE reconstruction is completely artifact-free and retains all high spatial resolution details of small veins. Model-based reconstruction with Poisson Disc outperformed CAIPI pattern in visible aliasing artifacts, but maps are less sharp either due to the regularization used or the well-known lack of compressibility of complex gradient echo data [13].
Discussion and Conclusion
A 3D multi-echo GRE sequence with wave encoding was implemented on Pulseq for high-accelerated quantitative $$$T_{2}^{*}$$$ and $$$B_{0}$$$ mapping. Both SENSE and model-based reconstructions were developed for parameter estimation. While SENSE was more flexible and robust regarding regularization procedures, MOBA reconstructions required significantly higher computational resources and fine-tuning. The direct regularization on $$$B_{0}$$$ maps renders model-based reconstruction less prone to phase warps and allows increased accelerations but also results in smoother reconstructions in in-vivo data. More accurate signal modeling and more advanced initialization procedures may help improve model-based reconstruction performance to fully take advantage of the jittered design across echoes proposed in this work.Acknowledgements
No acknowledgement found.References
1. QMR Lucca 2022 Joint Workshop on MR phase, magnetic susceptibility and electrical properties mapping, Lucca, Italy.
2. Lancione M, Bosco P, Costagli M, et al. Multi-centre and multi-vendor reproducibility of a standardized protocol for quantitative susceptibility Mapping of the human brain at 3T. Physica Medica 2022;103:37–45 doi: 10.1016/j.ejmp.2022.09.012.
3. Ropele S, Wattjes MP, Langkammer C, et al. Multicenter R2* mapping in the healthy brain. Magn. Reson. Med. 2014;71:1103–1107.
4. Leutritz T, Seif M, Helms G, et al. Multiparameter mapping of relaxation (R1, R2*), proton density and magnetization transfer saturation at 3 T: A multicenter dual-vendor reproducibility and repeatability study. Hum. Brain Mapp. 2020;41:4232–4247.
5. Peters A, Brookes M, Hoogenraad F et al., T2* measurements in human brain at 1.5, 3 and 7 T. Magn. Reson. Imaging. 2007: 748-753.
6. Bilgic B, Gagoski BA, Cauley SF, et al. Wave-CAIPI for highly accelerated 3D imaging. Magn. Reson. Med. 2015; 73: 2152-2162.
7. Lustig M, Pauly JM. SPIRiT: Iterative self-consistent parallel imaging reconstruction from arbitrary k-space. Magn Reson Med 2010; 64: 457–471.
8. Wang X, Tan Z, Scholand N, Roeloffs V, Uecker M. Physics-based reconstruction methods for magnetic resonance imaging. Philos. Trans. Royal. Soc. A. 2021; 379:20200196.
9. Layton KJ, Kroboth S, Jia F, et al. Pulseq: a rapid and hardware-independent pulse sequence prototyping framework. Magn Reson Med. 2017; 77: 1544-1552.
10. Uecker M, Holme CHM, Blumenthal M et al., Mrirecon/bart: version 0.7. 00, https://zenodo.org/records/4570601.
11. Tan Z, Unterberg-Buchwald C, Blumenthal M et al., Free-Breathing Liver Fat, R₂* and B₀ Field Mapping Using Multi-Echo Radial FLASH and Regularized Model-Based Reconstruction. IEEE Trans on Medical Imaging. 2023 42 (5), 1374-1387.
12. Iyer S, Polak D, Liao C, et al. Wave-encoding and shuffling enables rapid time resolved structural imaging. arXiv: 2103.15881.
13. QSM Consensus Organization Committee: Recommended Implementation of Quantitative Susceptibility Mapping for Clinical Research in The Brain: A Consensus of the ISMRM Electro-Magnetic Tissue Properties Study Group. arXiv:2307.02306v1, 2023.
14. Chan K, Marques J. SEPIA-Susceptibility mapping pipeline tool for phase images. NeuroImage. 2021:227:117611.
Figures