3825
Making MR more accessible through precision quantitative MRI at 0.55T with optimized 3D MRF1Department of Radiology, Stanford University, Stanford, CA, United States, 2Department of Radiology and Biomedical Imaging, University of California, San Francisco, CA, United States, 3Department of Electrical Engineering, Stanford University, Stanford, CA, United States, 4Department of Biomedical Engineering, University of Virginia, Charlottesville, VA, United States, 5Department of Radiation Oncology, City of Hope National Cancer Center, Los Angeles, CA, United States
Synopsis
Keywords: Quantitative Imaging, MR Fingerprinting
Motivation: To enable high-resolution quantitaive imaging in economy-friendly 0.55T scanners.
Goal(s): MRF with 1.2-mm isotropic resolution implemented on a FreeMax 0.55T scanner.
Approach: MRF, subspace reconstructio, locally-low rank constraints, CRLB-optimized FA pattern, attention-based deep learning network for denoisig, trajectory correction, motion correction.
Results: The proposed method was validated on phantom, in-vivo human brain and knee.
Impact: Our research highlights the potential of affordable MRI scanners to deliver high-quality imaging.
Introduction
This study aimed to make rapid and robust quantitative MRI more accessible by implementing an optimized Magnetic Resonance Fingerprinting (MRF) technique (1) on a cost-effective 0.55T FreeMax MRI scanner and demonstrating its potential for neuro and MSK applications. Despite the challenges of lower SNR and slower achievable k-space transversal, we employed a range of techniques to overcome these issues including optimized sampling and excitation scheme, system imperfection correction, motion correction, and deep learning-based denoising.Method
Sequence design.This work utilized a FISP-based MRF sequence (2) for acquisition, encompassing 500 TRs with varying Flip Angles (FAs). Each set of acquisitions, with a 1.2-second rest interval, is termed an “acquisition group”. Multiple such groups are used for diverse spiral projection encodings to populate the 3D k-space through a tiny-golden-angle-shuffling scheme(3). Resolution is 1.2mm isotropic for whole-brain imaging and 1 mm isotropic for knee-imaging, obtained using Gmax of 25 mT/m and SRmax of 40 mT/m/ms.
To boost SNR, the flip angles pattern was re-designed using CRLB optimization for shorter T1 (450/600ms for WM/GM) and longer T2 (75/90ms) observed at 0.55T, compared to 3T. Additionally, to achieve motion-robustness, data acquisition across an additional 20 TRs at the end of each acquisition group were added to obtain low-resolution (5-mm) 3D images, which served as motion navigators every ~7s.
Reconstruction.
First, the MRF dictionary was pre-calculated utilizing Extended Phase Graph (EPG) (4). Then the first five principal components Φ1-5 were extracted as subspace bases using SVD and the coefficient maps (c1-5) could be resolved using subspace reconstruction(5).
In addition, to mitigate the gradient system imperfection, both the gradient delay (9) and actual gradient trajectory (10,11) were measured and utilized in the image reconstruction process. Motion correction was implemented by modulating the raw data with linear phase to reflect the translation motion and rotating the trajectory coordinates to reflect the rotation motion.
Denoising.
To boost SNR, the reconstructed coefficient maps (c1-5) are denoised using an attention-based deep learning network ST-CNNT (spatial-temporal CNN transformers). Instead of using the standard transformer module (12), the model proposes a spatial-temporal attention mechanism, which includes three attention units connected by attention mixers: local spatial attention for neighboring pixel correlations; global spatial attention looking at remote pixels over larger FOV; and temporal attention, which considers slice-to-slice relationships. A modified HRNet (High-resolution Network) (13) is used as a backbone.
The model is trained with a dataset of 8000 high-SNR measurements from 3T clinic scanners with their synthetic noisy variant as GT-noisy pairs. With inline signal power normalization and intensity augmentation, the model can deal with noisy scans across a range of SNR levels.
Validation.
For the in-vivo brain experiments, six healthy volunteers and one patient with brain tumor disease were scanned with the approval of the IRB and informed consent obtained. In addition, three healthy volunteers and one hip osteoarthritis (OA) patient were scanned for the MSK knee experiments.
Results
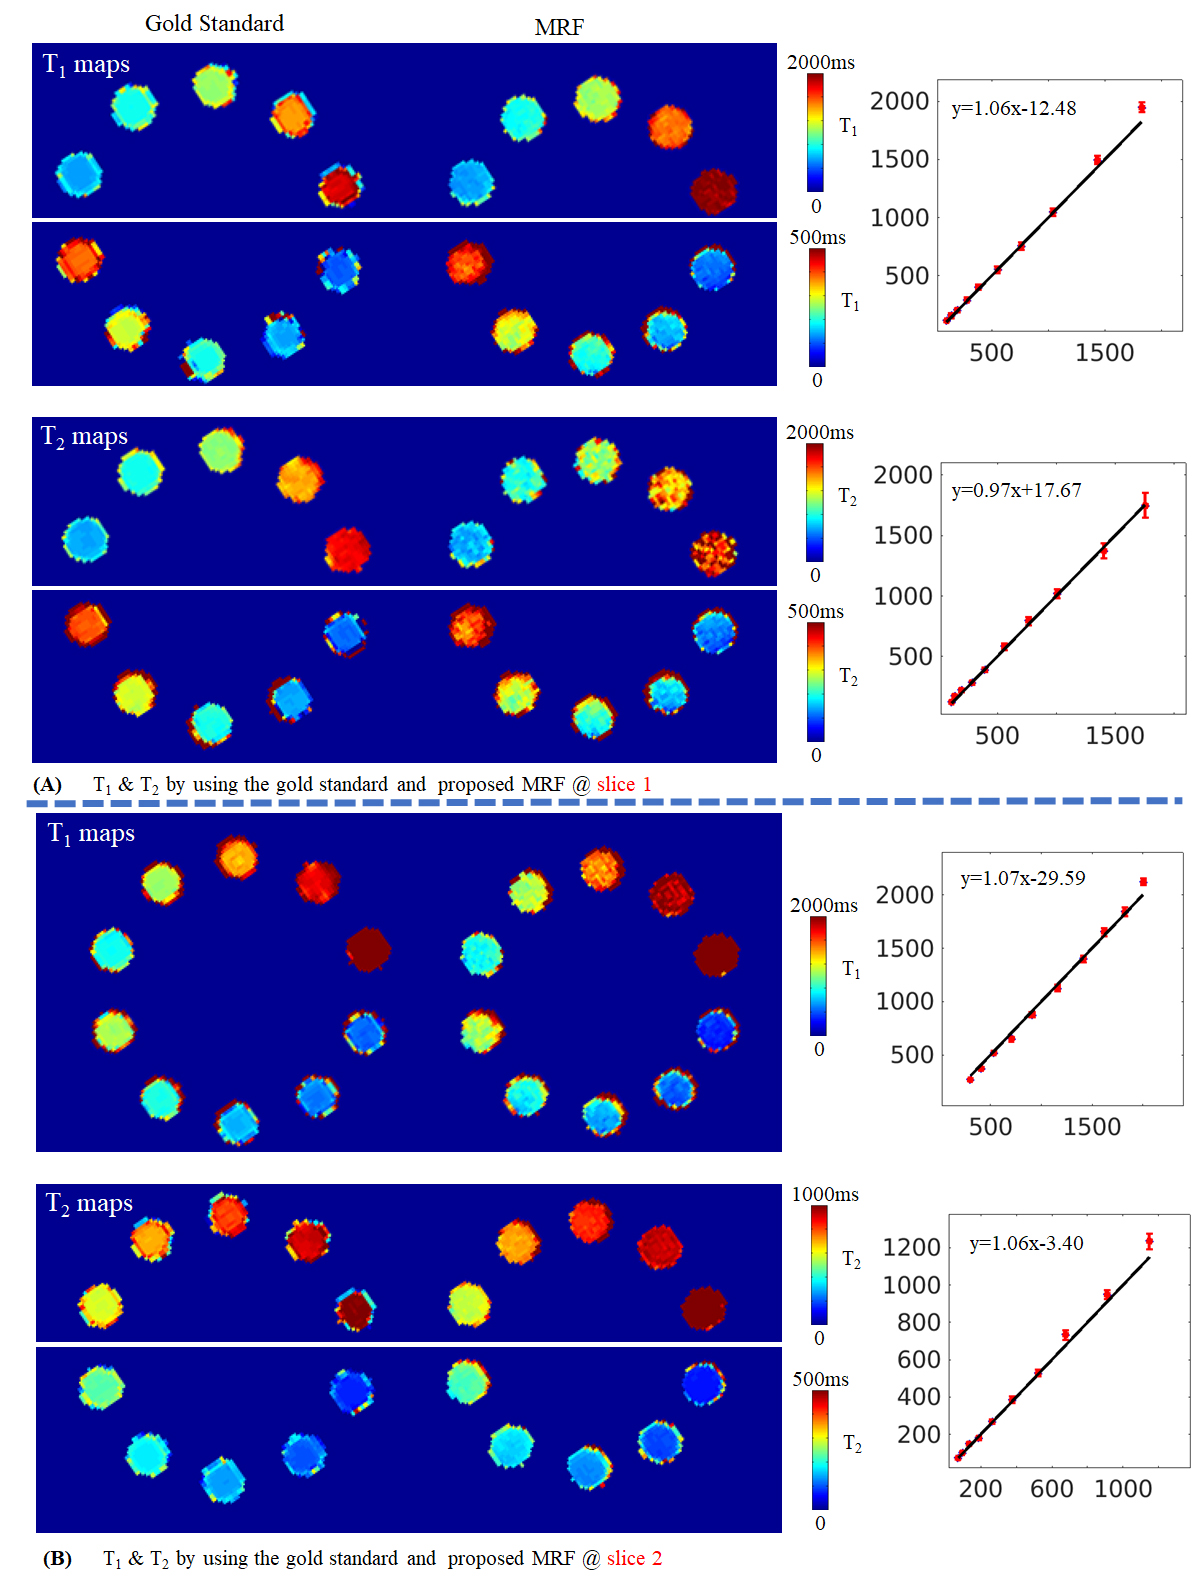
Figure 1 shows T1&T2 maps of NIST phantom using both the gold-standard methods and our proposed technique where excellent agreement is observed.Figure 2 shows in-vivo T1&T2 maps reconstructed using different trajectories and acceleration factors.
Figure 3A shows the motion estimates obtained from the navigator images for a motion cases with large abrupt motions (Figure 3B) and a case that the subject moved in a non-intentional drift manner during the scan.
Figure 4A shows quantitative maps and synthesized contrast images at 1.2 mm isotropic resolution whole-brain from a 4.5 minute scan. The average T1&T2 values for specific tissues are also listed in Figure 4B, as well as counterparts acquired from 3T.
Figure 5A shows the T1&T2 maps of a brain tumor patient, before and after taking Dotarem contrast agent. Figure 5B lists the T1&T2 values of two ROIs, highlighting the discernible decrease in T1&T2 values. Figure 8C shows the T1&T2 maps of the knee cartilage acquired from a healthy volunteer and a hip OA patient.
Acknowledgements
This work was supported by: NIH research grants: R01EB020613, R01MH116173, R01EB019437, R01EB028797, R01EB016695, U01EB025162, P41EB030006, U01EB026996, R03EB031175.References
1. Ma D, Gulani V, Seiberlich N, et al. Magnetic resonance fingerprinting. Nature 2013;495:187–192 doi: 10.1038/nature11971.
2. Jiang Y, Ma D, Seiberlich N, Gulani V, Griswold MA. MR fingerprinting using fast imaging with steady state precession (FISP) with spiral readout. Magn. Reson. Med. 2015;74:1621–1631 doi: 10.1002/mrm.25559.
3. Cao X, Liao C, Iyer SS, et al. Optimized multi‐axis spiral projection <scp>MR</scp> fingerprinting with subspace reconstruction for rapid whole‐brain high‐isotropic‐resolution quantitative imaging. Magn. Reson. Med. 2022;88:133–150 doi: 10.1002/mrm.29194.
4. Weigel M. Extended phase graphs: Dephasing, RF pulses, and echoes - Pure and simple. J. Magn. Reson. Imaging 2015;41:266–295 doi: 10.1002/jmri.24619.
5. Zhao B, Setsompop K, Adalsteinsson E, et al. Improved magnetic resonance fingerprinting reconstruction with low-rank and subspace modeling. Magn. Reson. Med. 2018;79:933–942 doi: 10.1002/mrm.26701.
6. Uecker M, Lai P, Murphy MJ, et al. ESPIRiT - An eigenvalue approach to autocalibrating parallel MRI: Where SENSE meets GRAPPA. Magn. Reson. Med. 2014;71:990–1001 doi: 10.1002/mrm.24751.
7. Uecker M, Tamir JI, Ong F, Lustig M. The BART Toolbox for Computational Magnetic Resonance Imaging. Ismrm 2016.
8. Ong F, Lustig M. SigPy: A Python Package for High Performance Iterative Reconstruction. Proc. ISMRM 2019:4819.
9. Robison RK, Devaraj A, Pipe JG. Fast, simple gradient delay estimation for spiral MRI. Magn. Reson. Med. 2010;63:1683–1690 doi: 10.1002/mrm.22327.
10. Zhang Y, Hetherington HP, Stokely EM, Mason GF, Twieg DB. A novel k-space trajectory measurement technique. Magn. Reson. Med. 1998;39:999–1004 doi: 10.1002/mrm.1910390618.
11. Tan H, Meyer CH. Estimation of k -space trajectories in spiral MRI. Magn. Reson. Med. 2009;61:1396–1404 doi: 10.1002/mrm.21813.
12. Vaswani A, Shazeer N, Parmar N, et al. Attention is all you need. Adv. Neural Inf. Process. Syst. 2017;2017-Decem:5999–6009.
13. Wang J, Sun K, Cheng T, et al. Deep High-Resolution Representation Learning for Visual Recognition. IEEE Trans. Pattern Anal. Mach. Intell. 2021;43:3349–3364 doi: 10.1109/TPAMI.2020.2983686.
14. Bhattacharjee R, Thahakoya R, Luitjens J, et al. Effects of T1p Characteristics of Load-Bearing Hip Cartilage on Bilateral Knee Patellar Cartilage Subregions: Subjects With None to Moderate Radiographic Hip Osteoarthritis. J. Magn. Reson. Imaging 2023:1–17 doi: 10.1002/jmri.29009.
15. Campbell-Washburn AE, Jiang Y, Körzdörfer G, Nittka M, Griswold MA. Feasibility of MR fingerprinting using a high-performance 0.55 T MRI system. Magn. Reson. Imaging 2021;81:88–93 doi: 10.1016/j.mri.2021.06.002.
16. Zhu Z, Lee NG, Tian Y, Nayak KS. Efficient MRF at 0 . 55T with long readouts and concomitant field effects correction. ISMRM, Toronto 2023:2364.
17. Mickevicius NJ, Kim JP, Zhao J, Morris ZS, Hurst NJ, Glide-Hurst CK. Toward magnetic resonance fingerprinting for low-field MR-guided radiation therapy. Med. Phys. 2021;48:6930–6940 doi: 10.1002/mp.15202.
18. Mickevicius NJ, Glide-Hurst CK. Low-rank inversion reconstruction for through-plane accelerated radial MR fingerprinting applied to relaxometry at 0.35 T. Magn. Reson. Med. 2022;88:840–848 doi: 10.1002/mrm.29244.
Figures
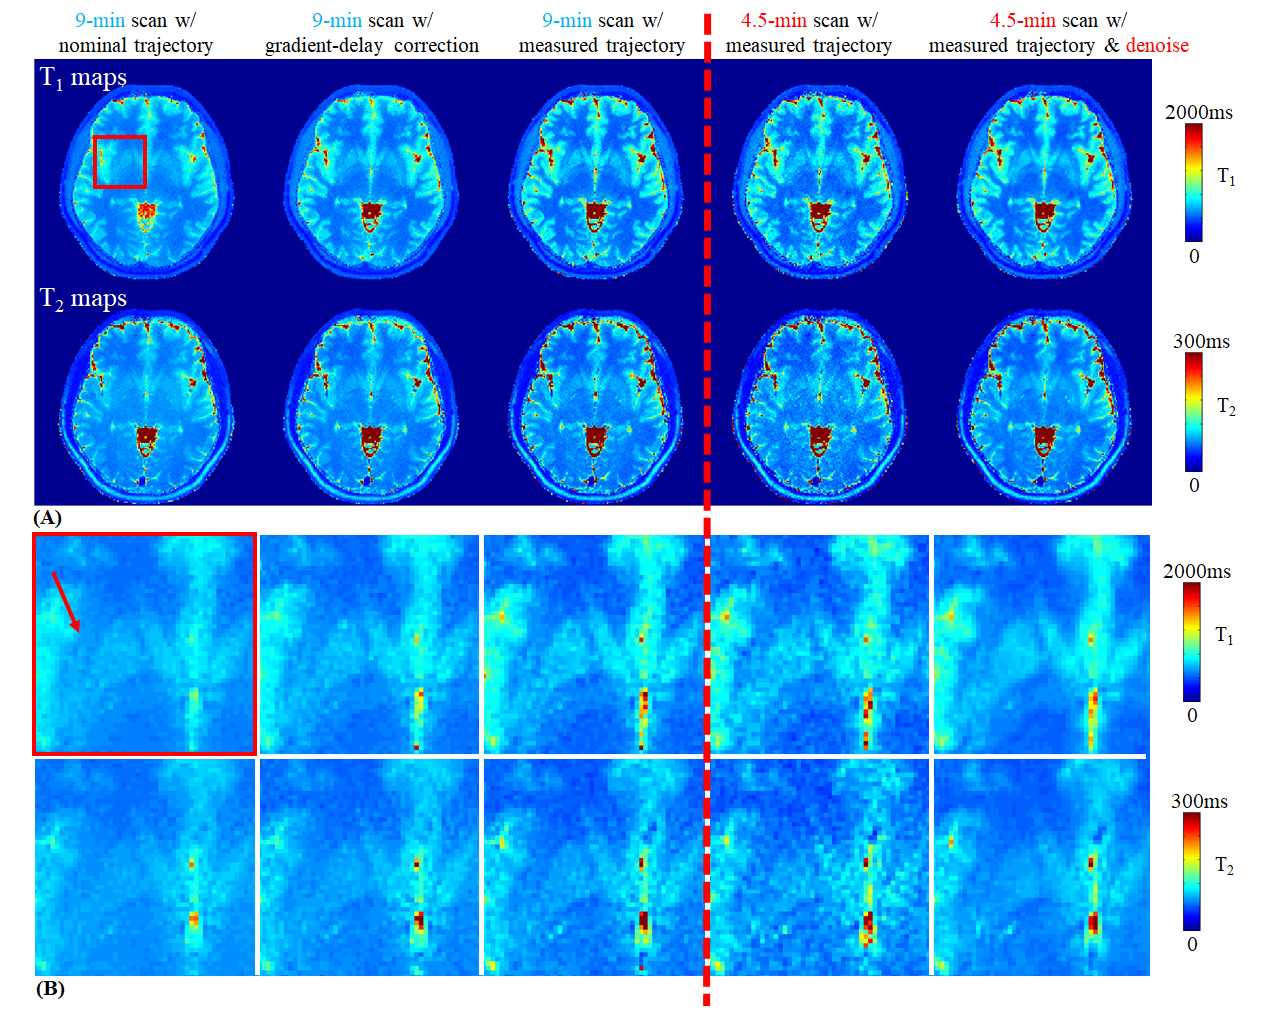
(A) Based on a MRF dataset with 9-min acquisition time, T1 and T2 maps were reconstructed by using nominal trajectory (Column 1), gradient delay correction (Column 2) and measured trajectory (Column 3). An acceleration factor R=2 was implemented (Column 4) , as well as additional attention-based denoising (Column 5).
(B) A zoom-in T1 and T2 maps of the red box in (A). The red arrow indicates a tiny structure, claustrum, as a proof of the image sharpness.
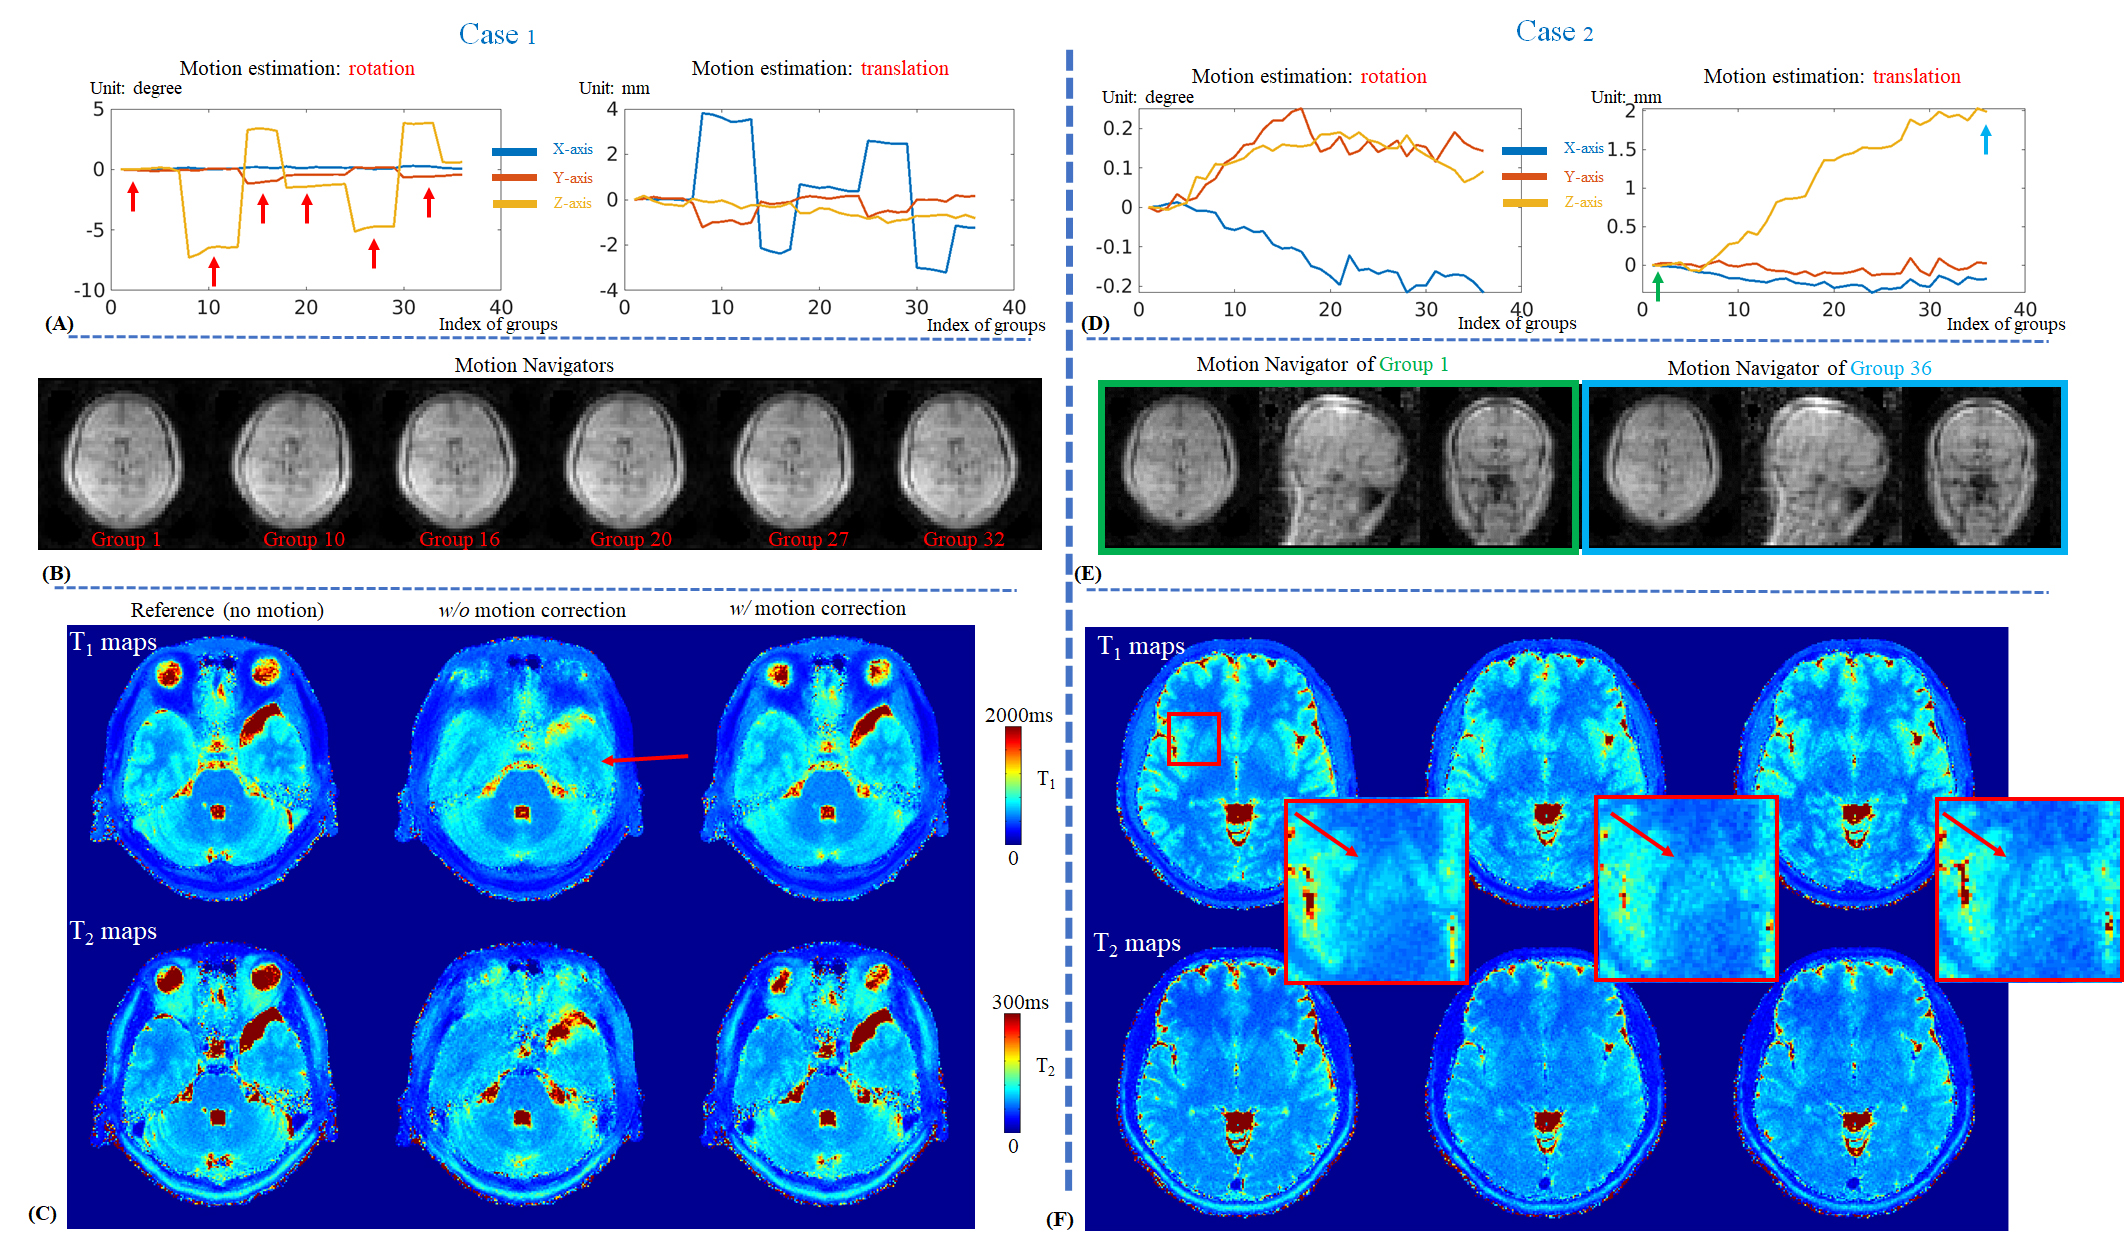
(A,D) Motion estimation.
(B) Motion navigator images of the [1,10,16,20,27,32]th acquisition groups, corresponding to the groups indicated by the red arrows in (A).
(C) T1&T2 maps with and without motion correction. The reference maps (left) were acquired without motion.
(E) Motion navigator images of the first and the last acquisition groups, corresponding to the groups indicated by the green and blue arrows in (D), respectively.
(F) With the motion correction, the tiny structure, claustrum (pointed by the red arrow), could be revealed.
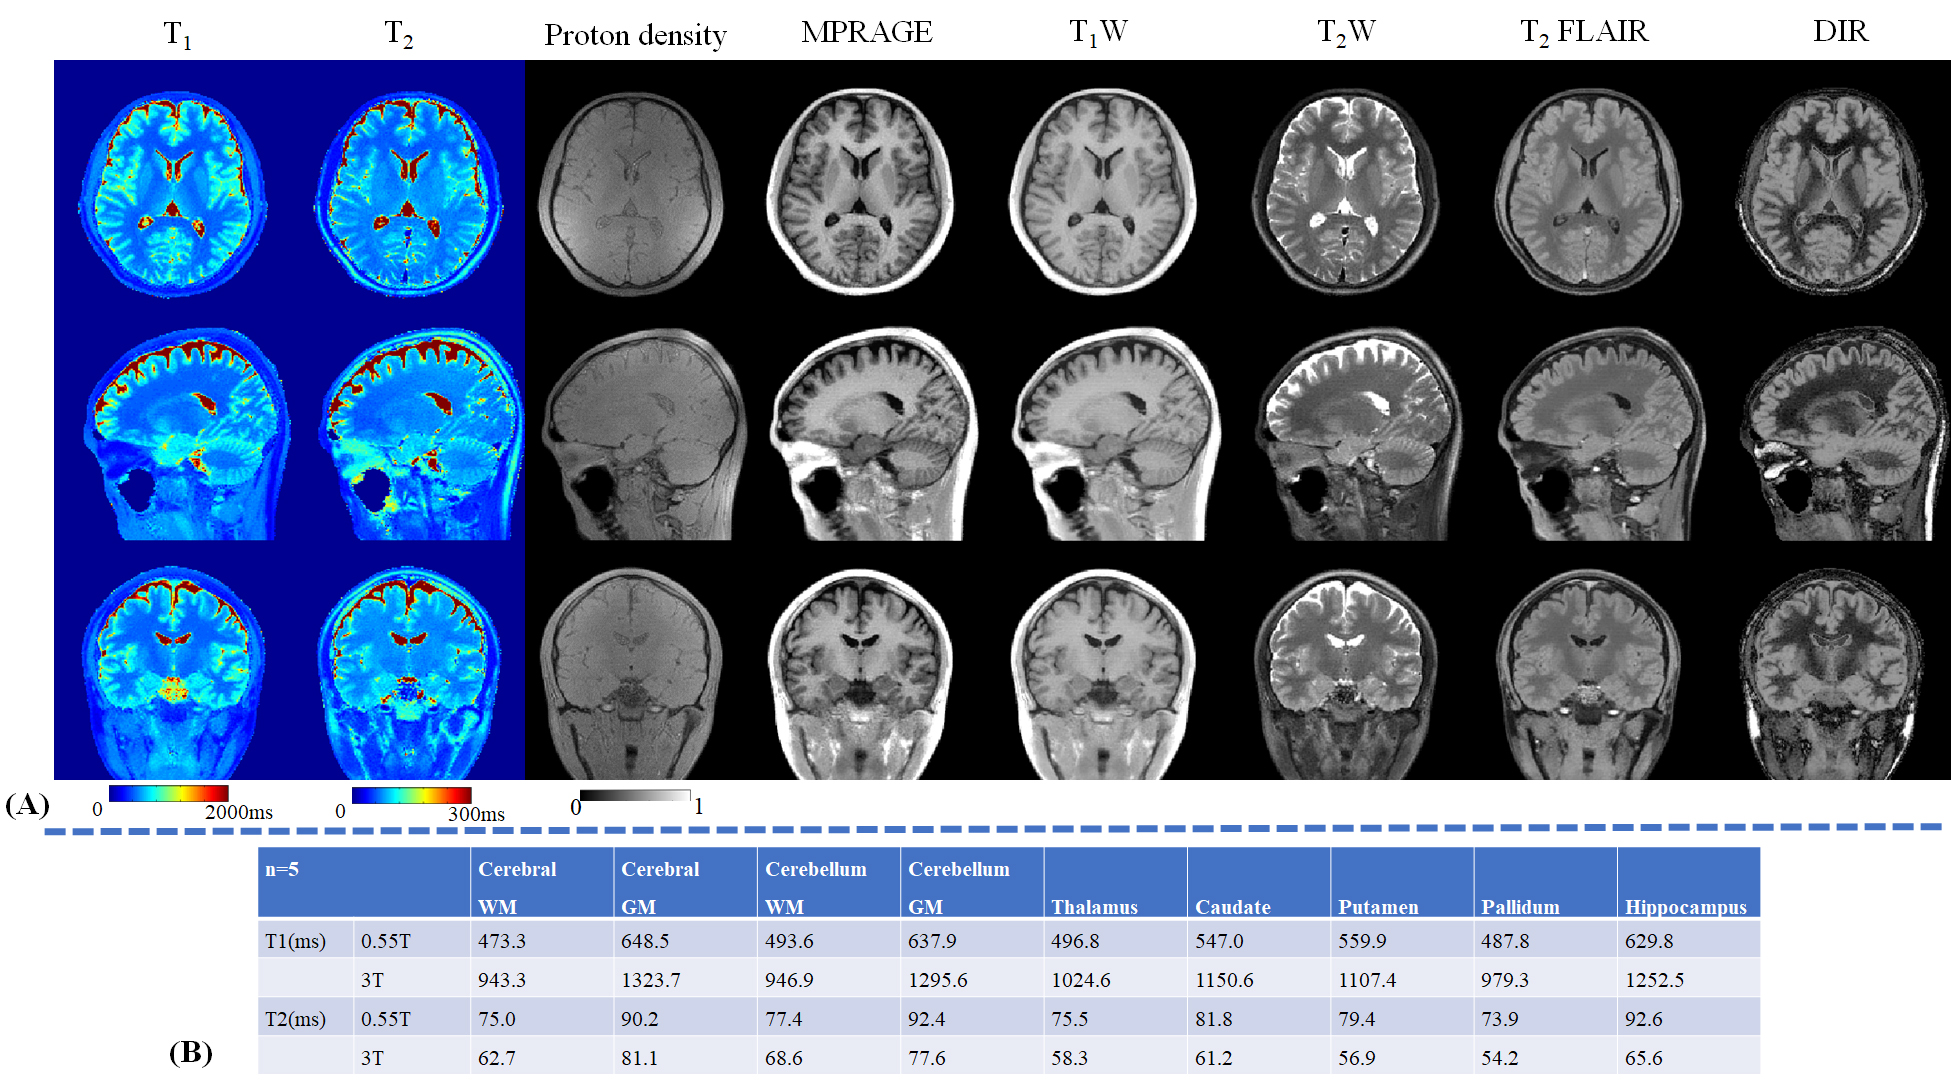
(A) Whole-brain T1, T2 and proton density maps using the proposed method. These quantitative maps are also used to synthesize the contrast images, including MPRAGE, T1W, T2W, T2 FLAIR and DIR.
(B) T1 and T2 values of different brain tissues using the proposed method from a 0.55T FreeMax scanner and a 3T scanner.
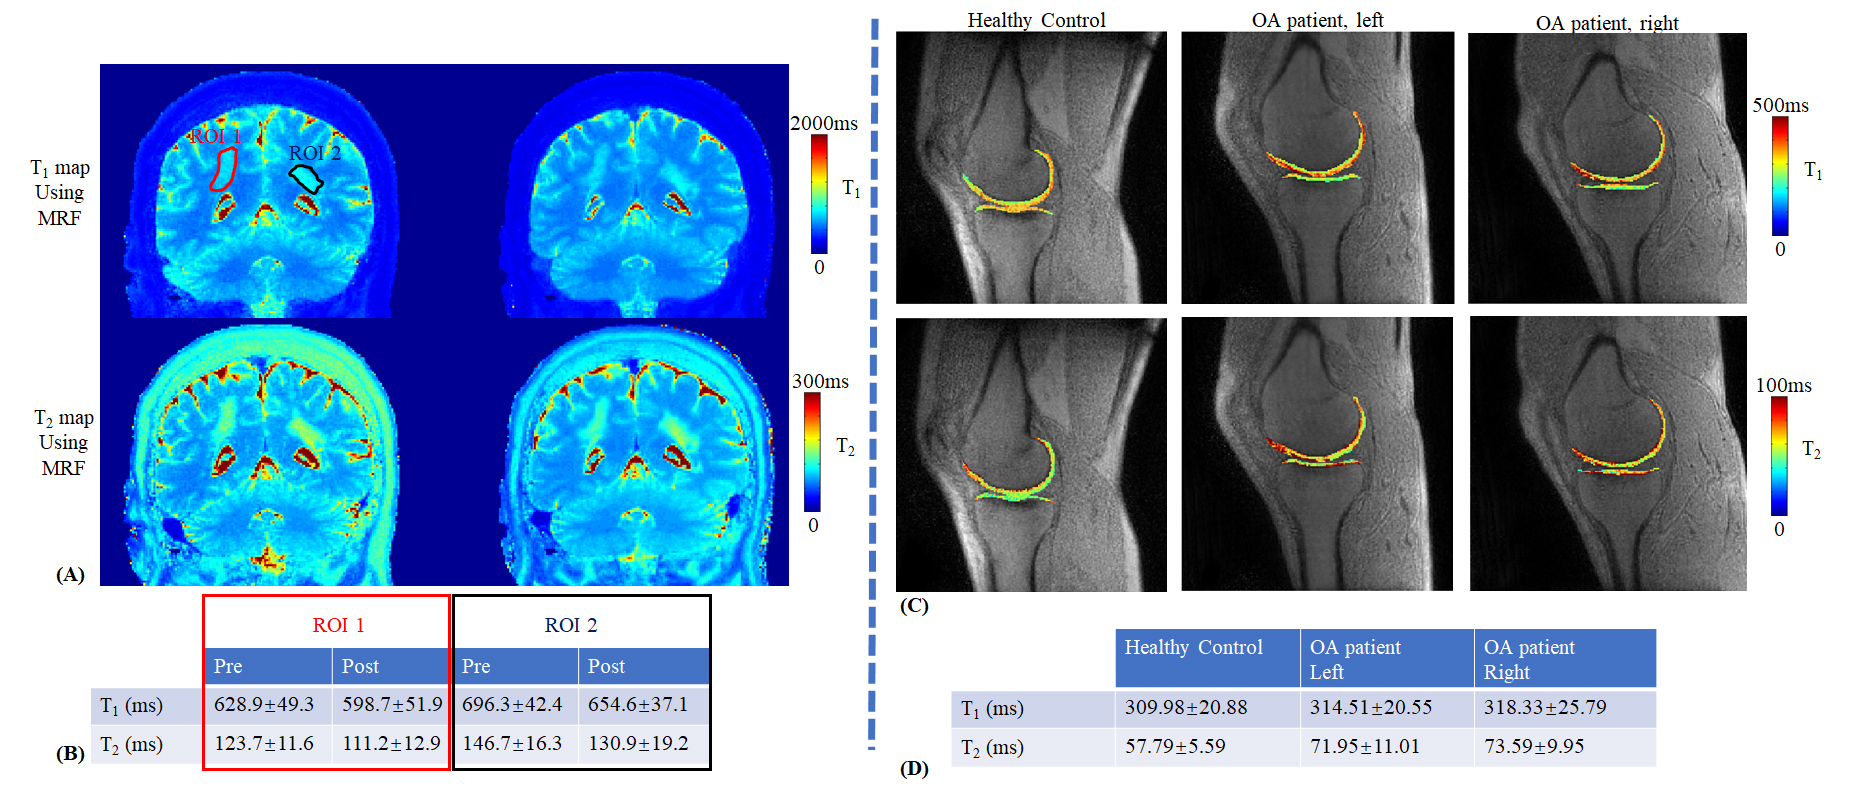
(A) T1 and T2 maps using the proposed MRF sequence.
(B) The average values and standard deviations of the T1 and T2 values at two ROIs.
(C) T1 and T2 maps using the proposed MRF sequence of a healthy volunteer (Column 1) and an OA patient (Column 2 for the left knee and Column 3 for the right knee).
(D) The T1 and T2 average values and standard deviations of the knee cartilage, highlighting a slight elevation in OA patient, which is consistent with the results of a recent research (14) that draws a connection between hip OA and early degenerative changes in the knee.