3824
Rapid T2 mapping with blip-reversed multi-echo planar imaging1Radiology, Harvard Medical School, Boston, MA, United States, 2Computational Radiology Laboratory, Boston Children's Hospital, Boston, MA, United States, 3Siemens Medical Solutions USA, Inc., Boston, MA, United States
Synopsis
Keywords: Pulse Sequence Design, Brain
Motivation: Current methods for T2 mapping are time-consuming and susceptible to motion artifacts, hindering their clinical utility.
Goal(s): Our goal is to develop a rapid and motion-robust T2 mapping technique. By significantly reducing scan times and eliminating motion artifacts, we aim to enhance the clinical feasibility of quantitative T2 mapping across diverse patient populations.
Approach: Standard spin-echo EPI sequence was modified by incorporating additional readouts with alternating phase-encoding directions. Geometric distortions due to susceptibility-induced effects were corrected using TOPUP tool.
Results: T2 maps generated using our sequence showed good correspondence with the T2 map from 3D GRASE reference both in phantom and volunteer studies.
Impact: Our single-shot T2 mapping technique based on multi-echo spin echo EPI sequence not only advances imaging speed and accuracy but also caters to uncooperative populations, including pediatric patients and individuals prone to movement.
Introduction
Quantitative T2 mapping enables characterization of tissue microstructure and myelination [1]. However, conventional multi-echo spin echo methods require lengthy scan times to sample multiple echo times (TEs). Echo planar imaging (EPI) can accelerate acquisitions, such as the recently proposed blip-up/down acquisition (BUDA) method [2,3]. However, this technique uses multi-shot imaging, which is sensitive to motion between shots and leads to potential motion artifacts especially in pediatric populations. To address this, we have developed a new single-shot technique for rapid T2 mapping. By acquiring all echoes for each slice with a single excitation, we can generate T2 maps with minimal scan time. This single shot method avoids possible motion between shots. This technique also provides efficiency along with robustness, enabling broader clinical application of quantitative T2 mapping across patient groups.Methods
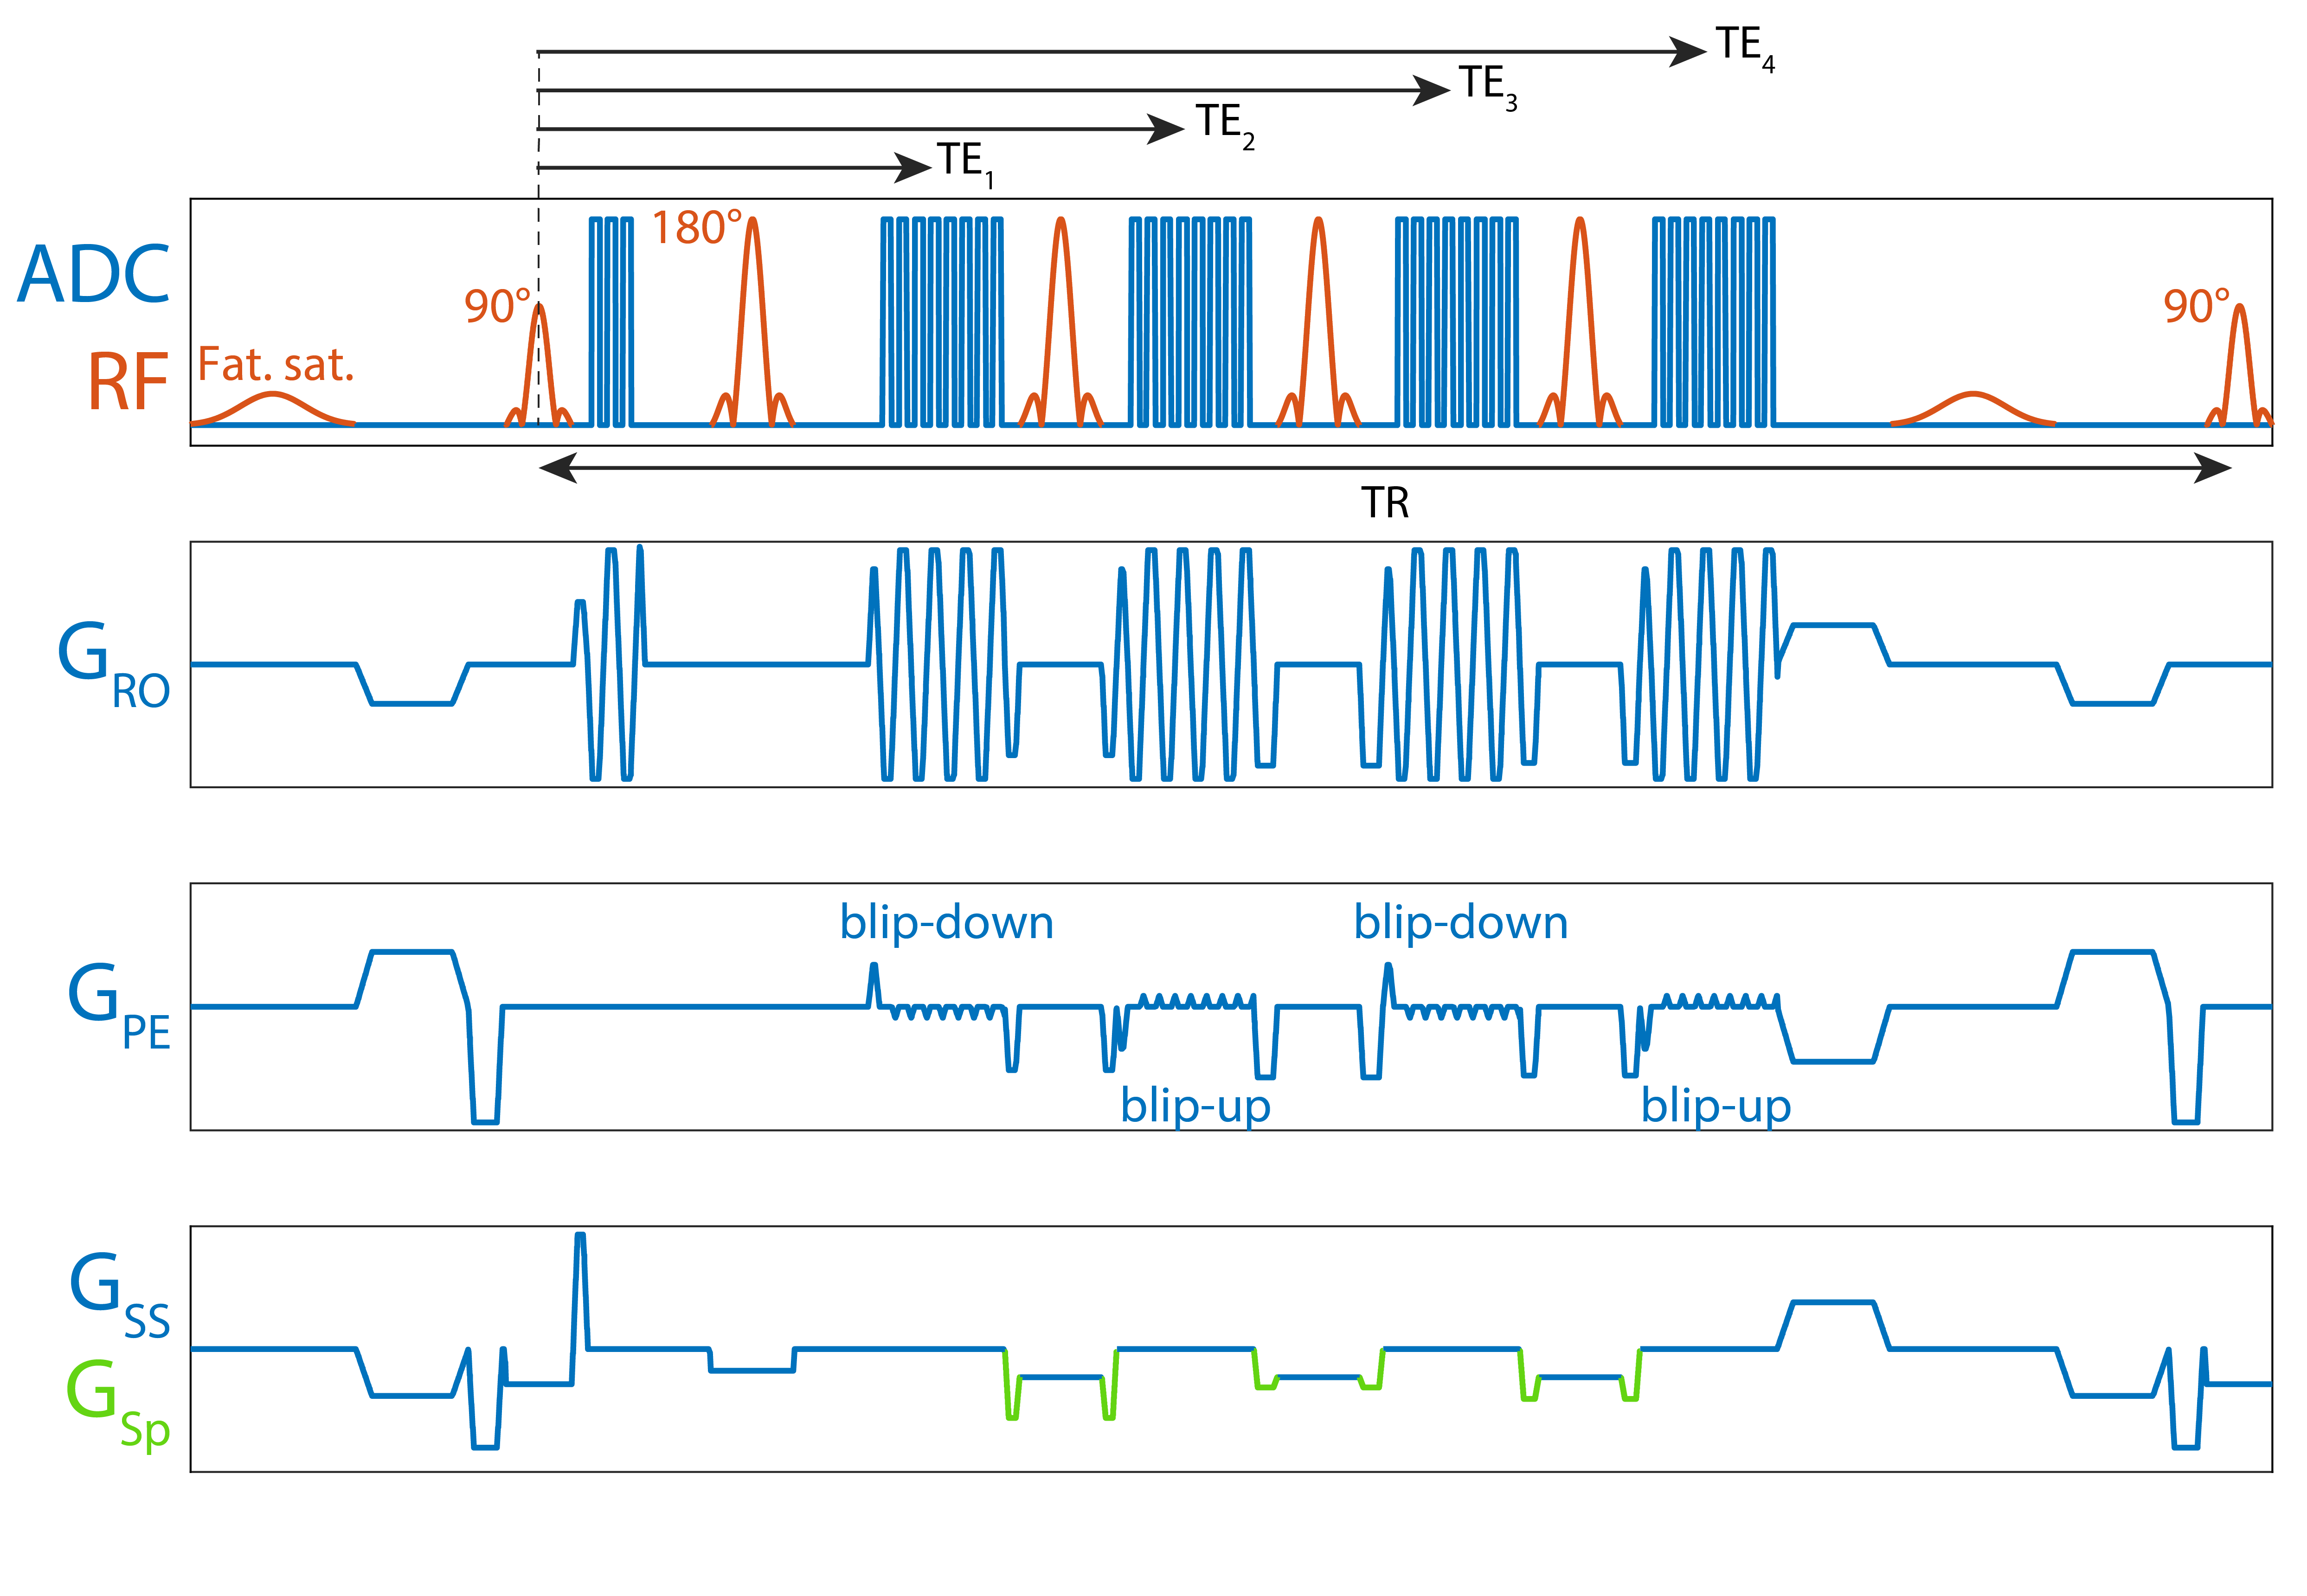
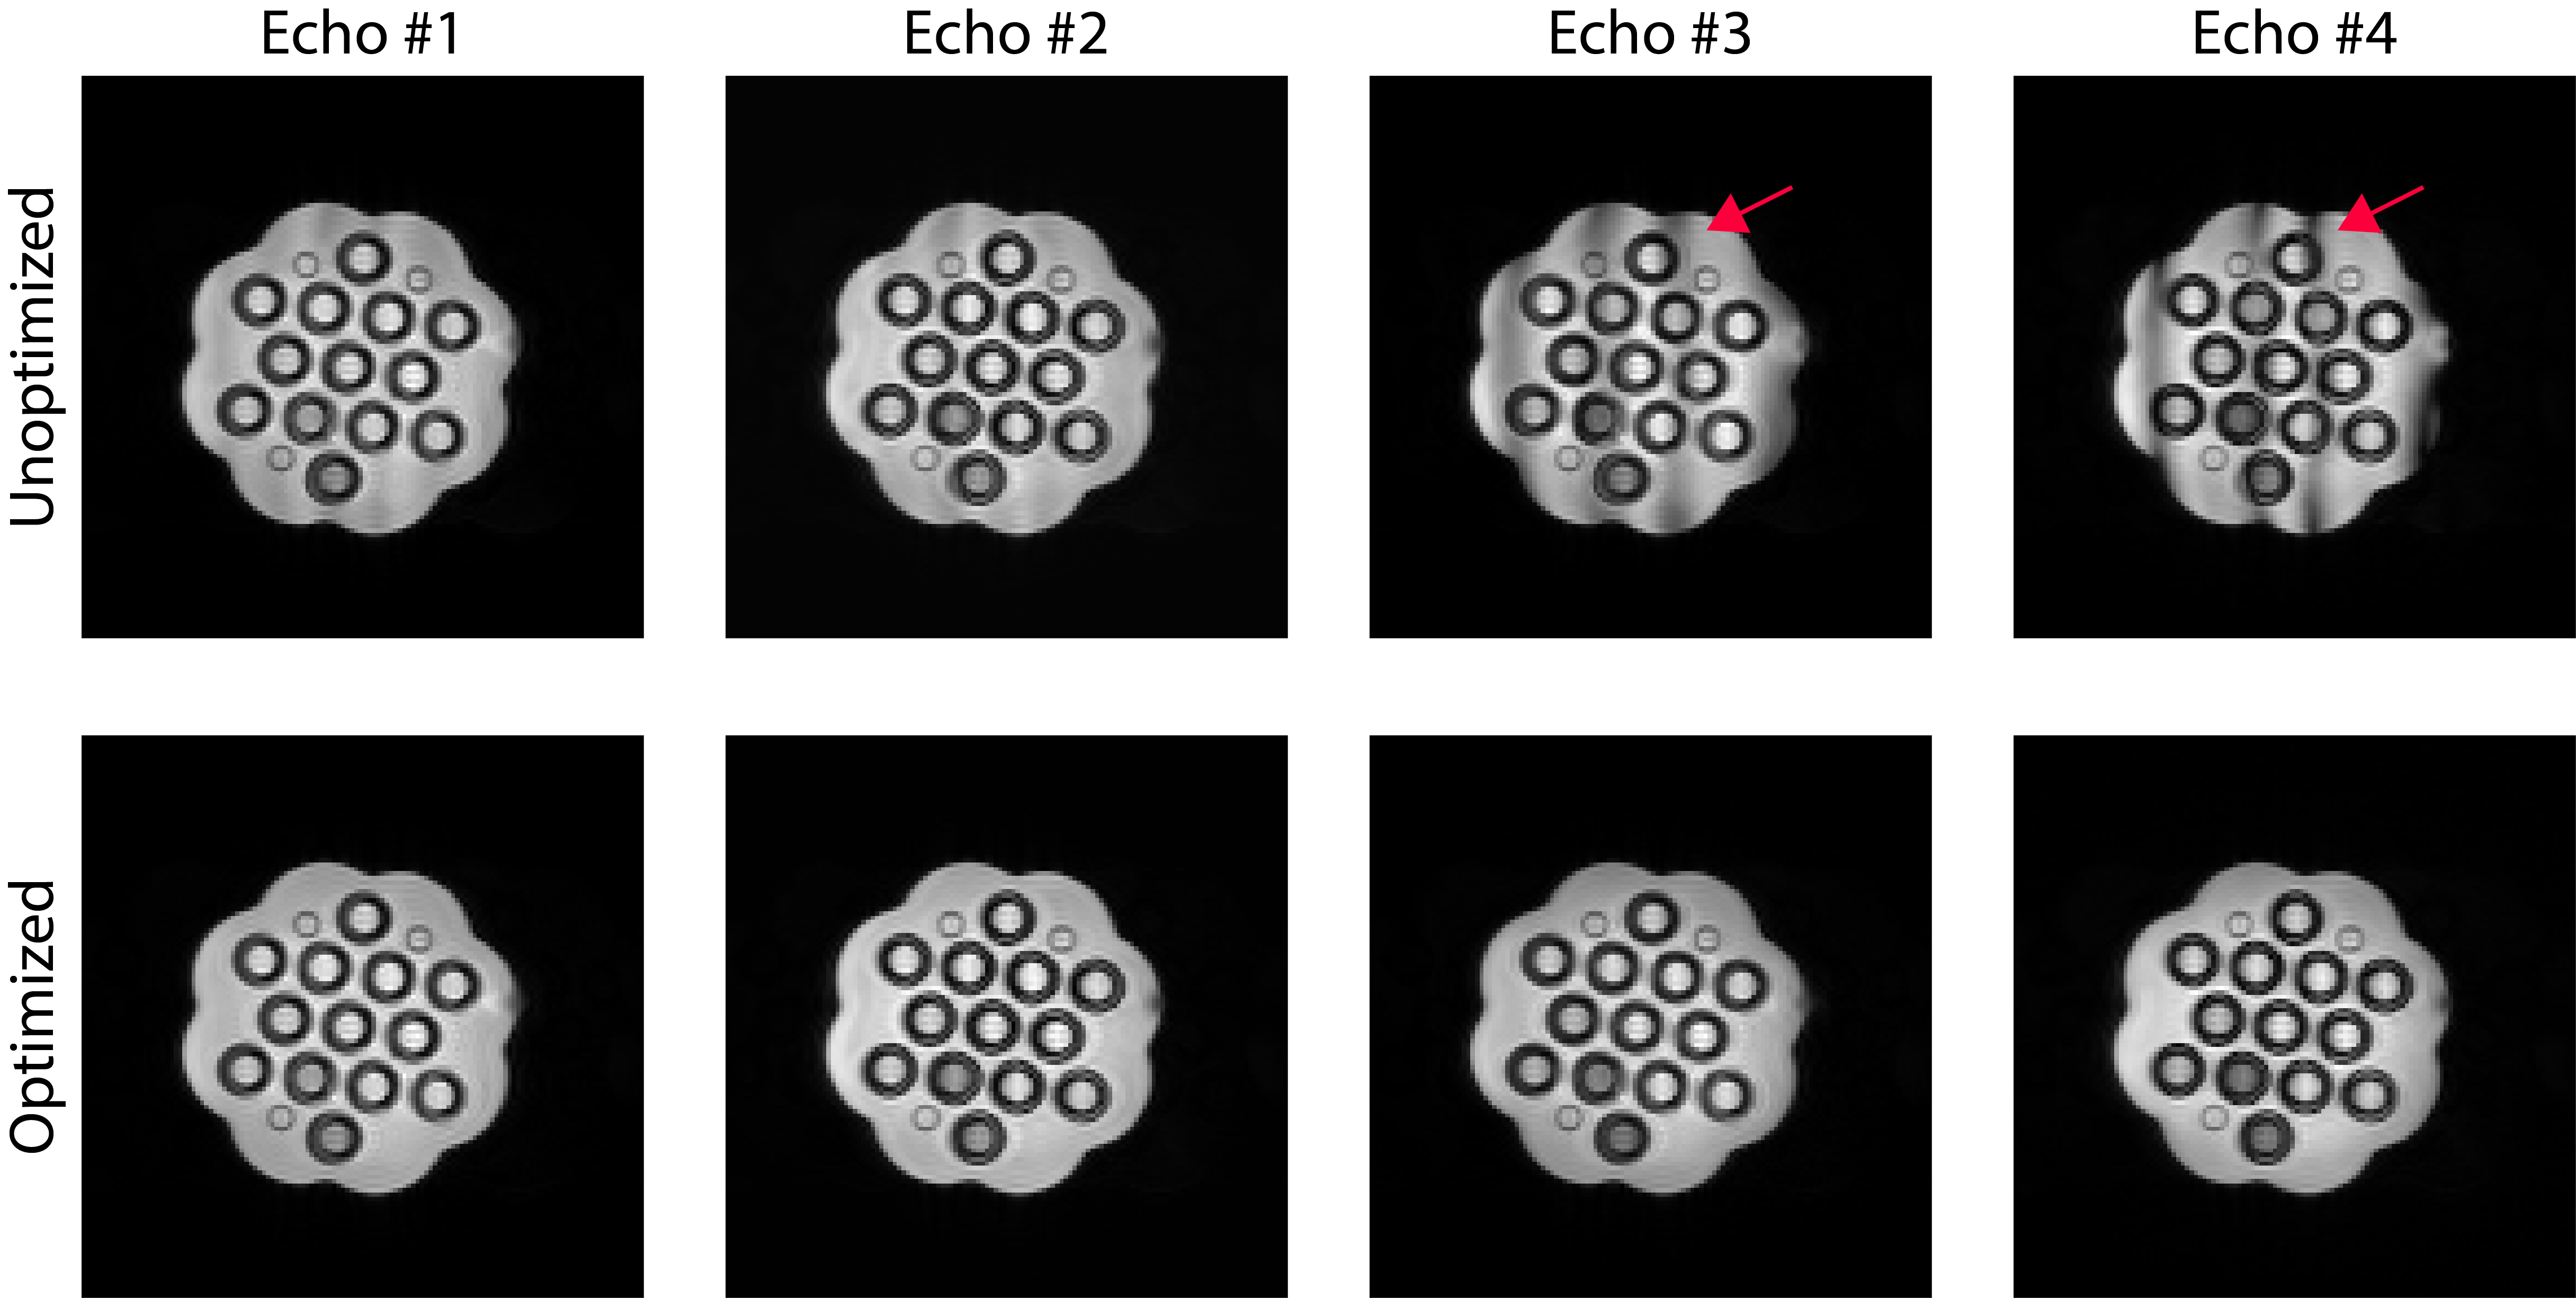
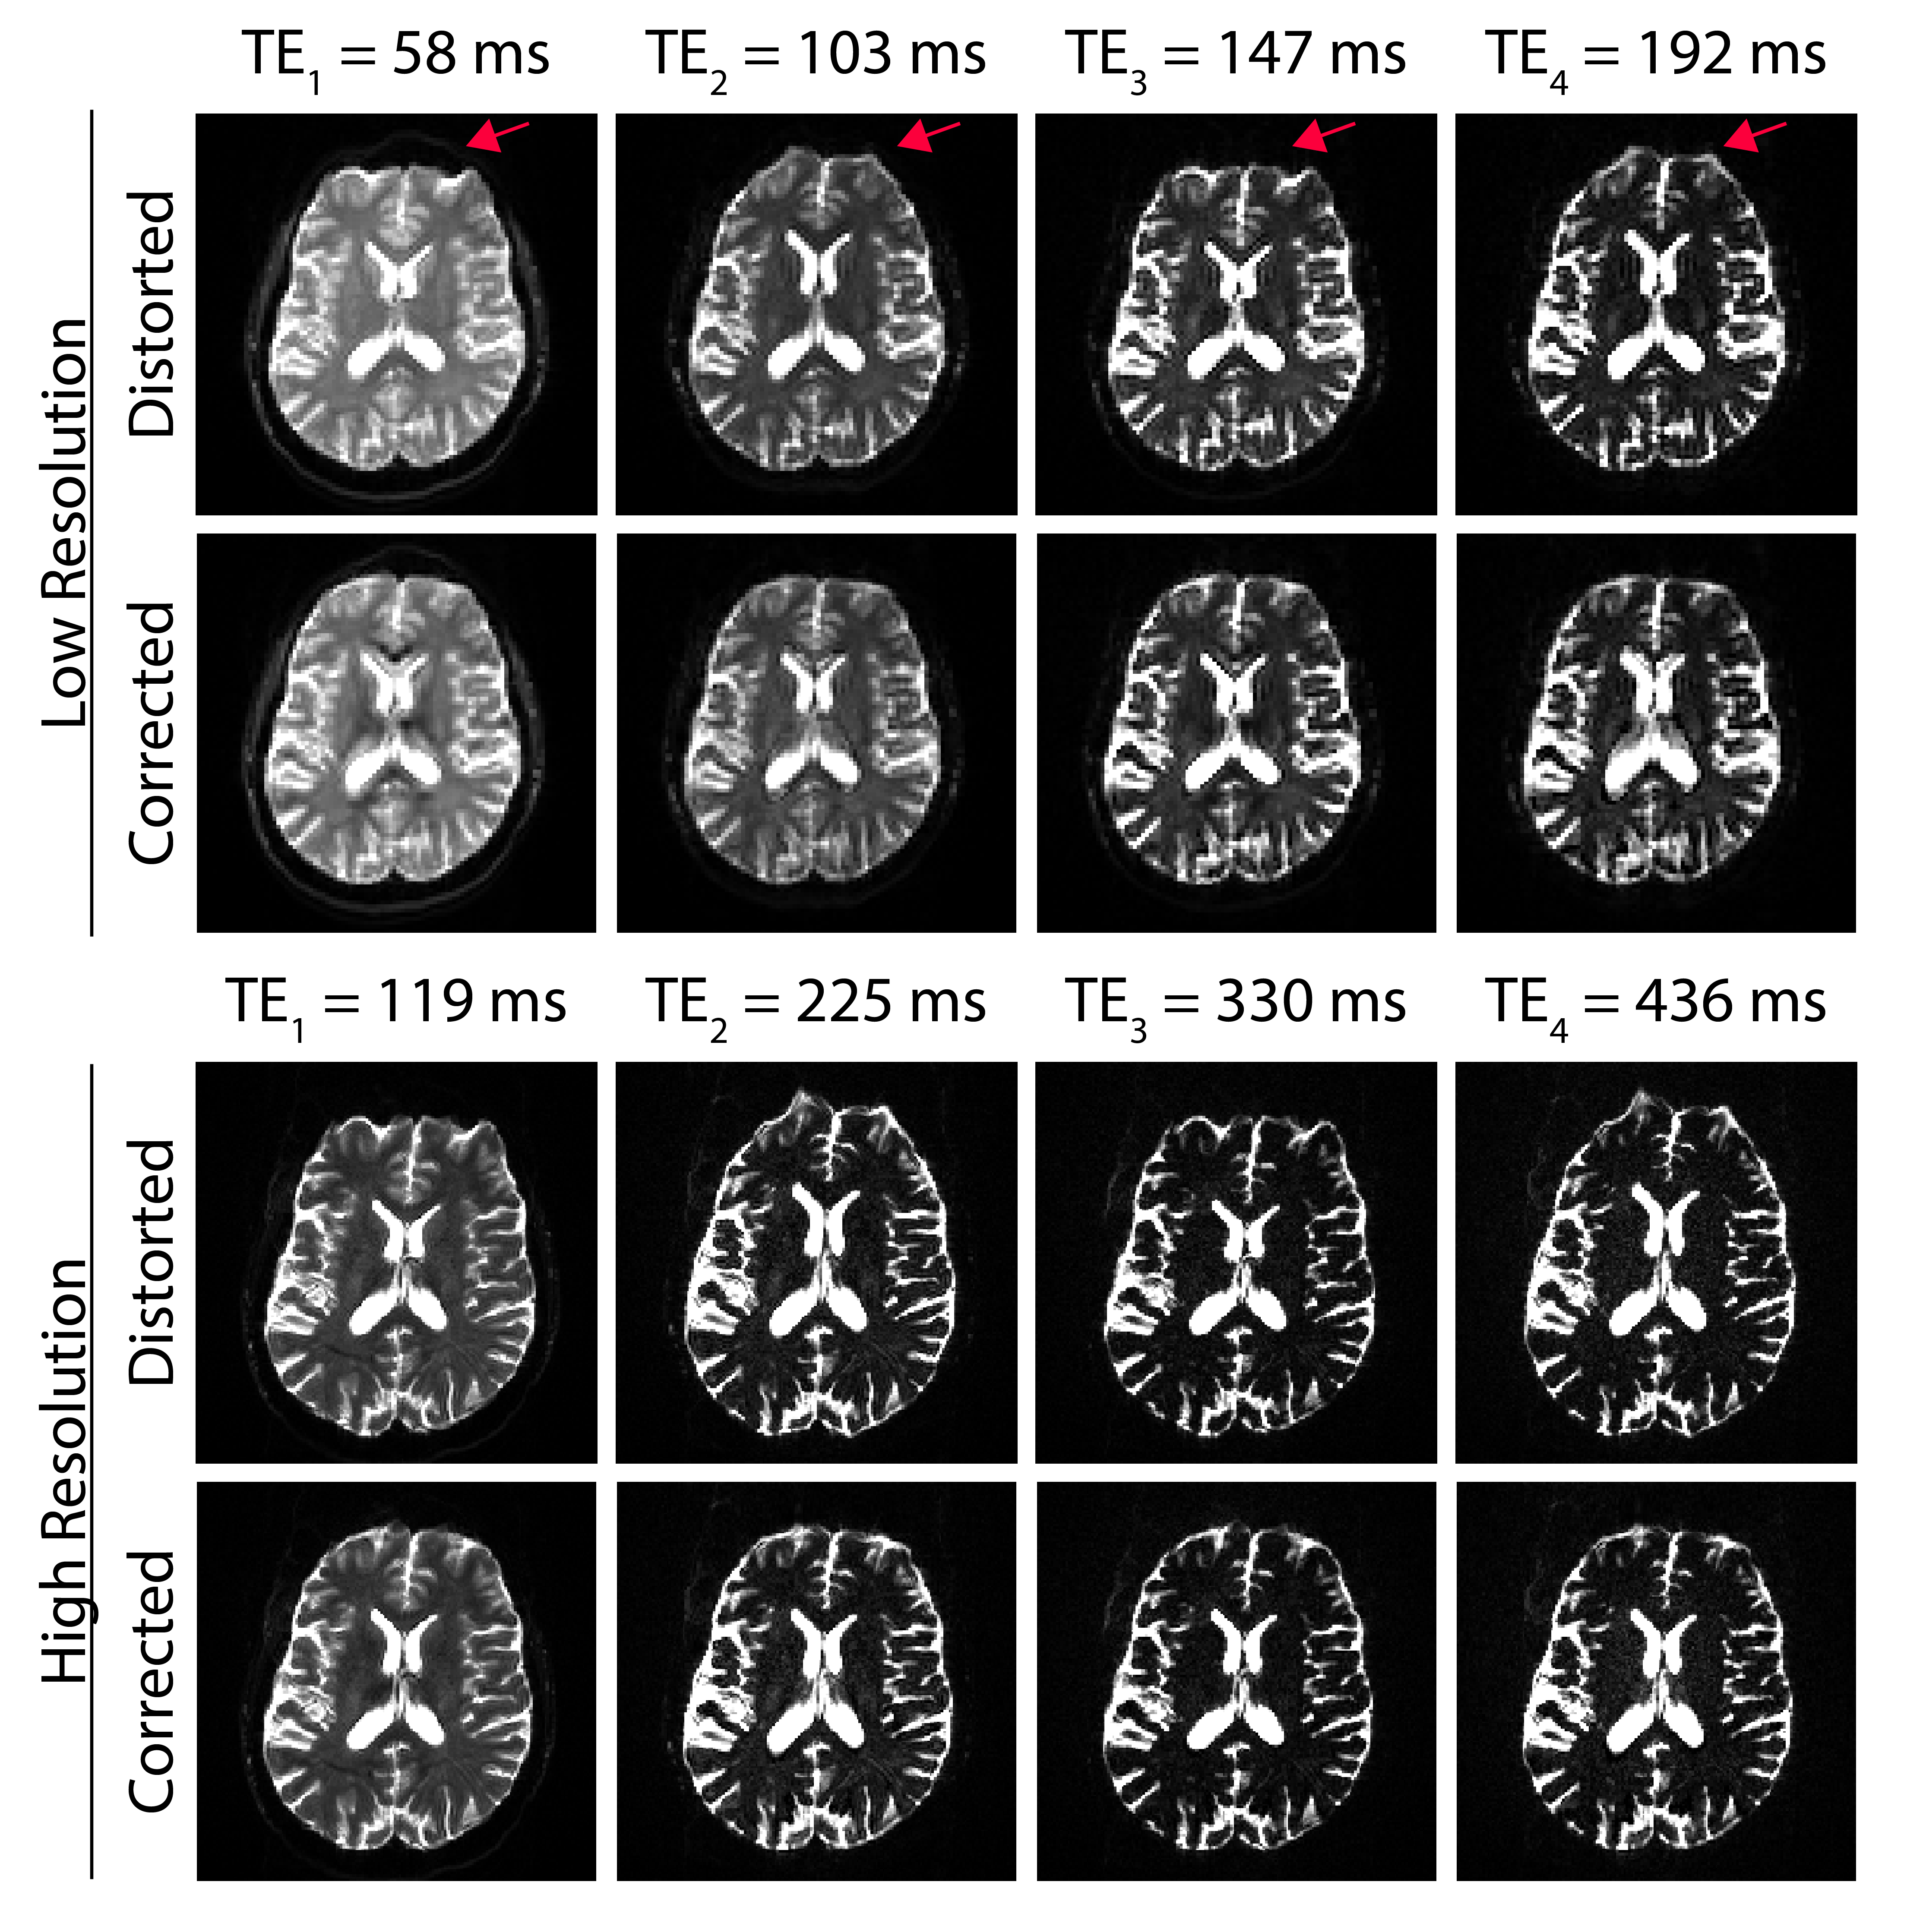
TheoryThe proposed multi-echo EPI technique with opposing phase encoding is summarized in Figure 1. A standard spin-echo EPI product sequence was modified by adding successive echo readouts with the same resolution, field of view (FoV) and bandwidth (BW) as the initial echo while alternating the phase encoding direction between even and odd echoes to traverse k-space in opposite directions [4,5]. The blip-reversed acquisition scheme is then used to correct for the geometric distortions using the FSL TOPUP tool since the susceptibility-induced distortions manifest with matched displacement magnitudes but in the opposite direction along the phase encoding axis [6-8] (see Figure 3). To estimate the T2 values, a monoexponential curve was fitted to the data using the qMRLab tool [9]. As a reference for comparison, a T2 map was also estimated utilizing the 32 echo images acquired with a 3D GRASE sequence [10]. Spoiler gradients with randomized amplitudes along each axis were incorporated into the sequence to suppress stimulated echo artifacts as demonstrated in Figure 2 [11].
Phantom Study
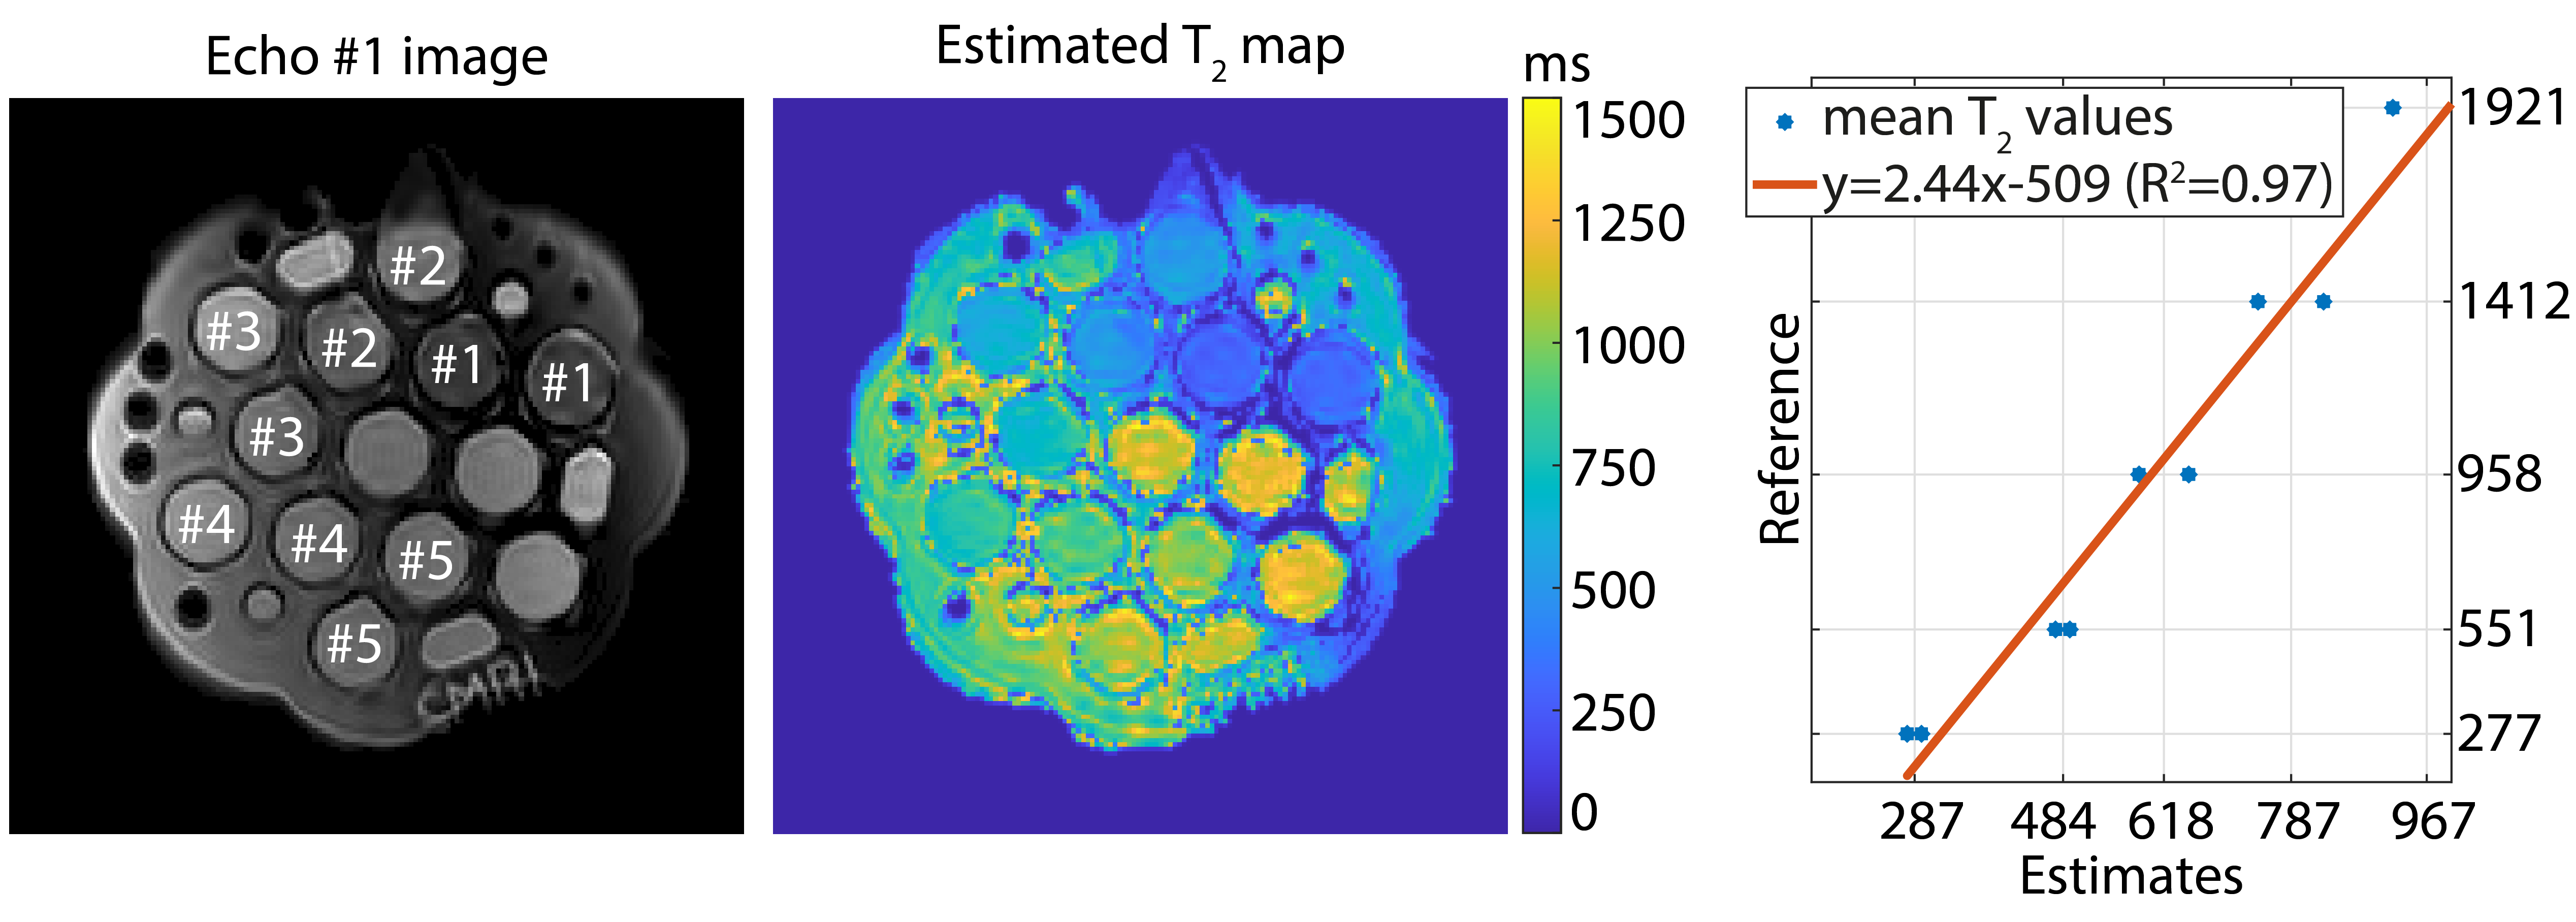
A diffusion phantom (CaliberMRI Model 128, CO, USA) consisting of 13 vials, each containing PVP (polyvinylpyrrolidone) solutions with varying concentrations from 0% to 40% [12], was imaged at 3T (MAGNETOM Prisma, Siemens Healthcare, Erlangen, Germany) using 64-channel head/neck coil (see Figure 4). The phantom measurements consisted of two experiments. First, the spoiler gradient strengths were optimized to suppress stimulated echo artifacts. Second, T2 mapping was performed by acquiring images with TEs set to 176 ms, 338 ms, 499 ms, and 661 ms (TA=20 s, segment/slice TR= 740 ms, FoV=256x256 mm2, matrix size=214x214, resolution=1.2x1.2 mm2, slice thickness=4 mm, BW=1558 Hz/Px, no acceleration, no partial Fourier).
Volunteer Study
Following written informed consent, in vivo brain scans were performed at 3T (same as above) using the same coil by varying imaging parameters including parallel acceleration and different spatial resolution levels to evaluate the performance of the proposed multi-echo EPI sequence (segment/slice TR= 490 ms, FoV=256x256 mm2, matrix size= 128x128, resolution=2x2 mm^2, slice thickness=4 mm, BW=1087 Hz/Px, GRAPPA of 2 for the low resolution image, and segment/slice TR= 900 ms, FoV=224x224 mm2, matrix size= 200x200, resolution=1.1x1.1 mm2, slice thickness=4 mm, BW=1953 Hz/Px, GRAPPA of 2 for the high resolution image).
Results
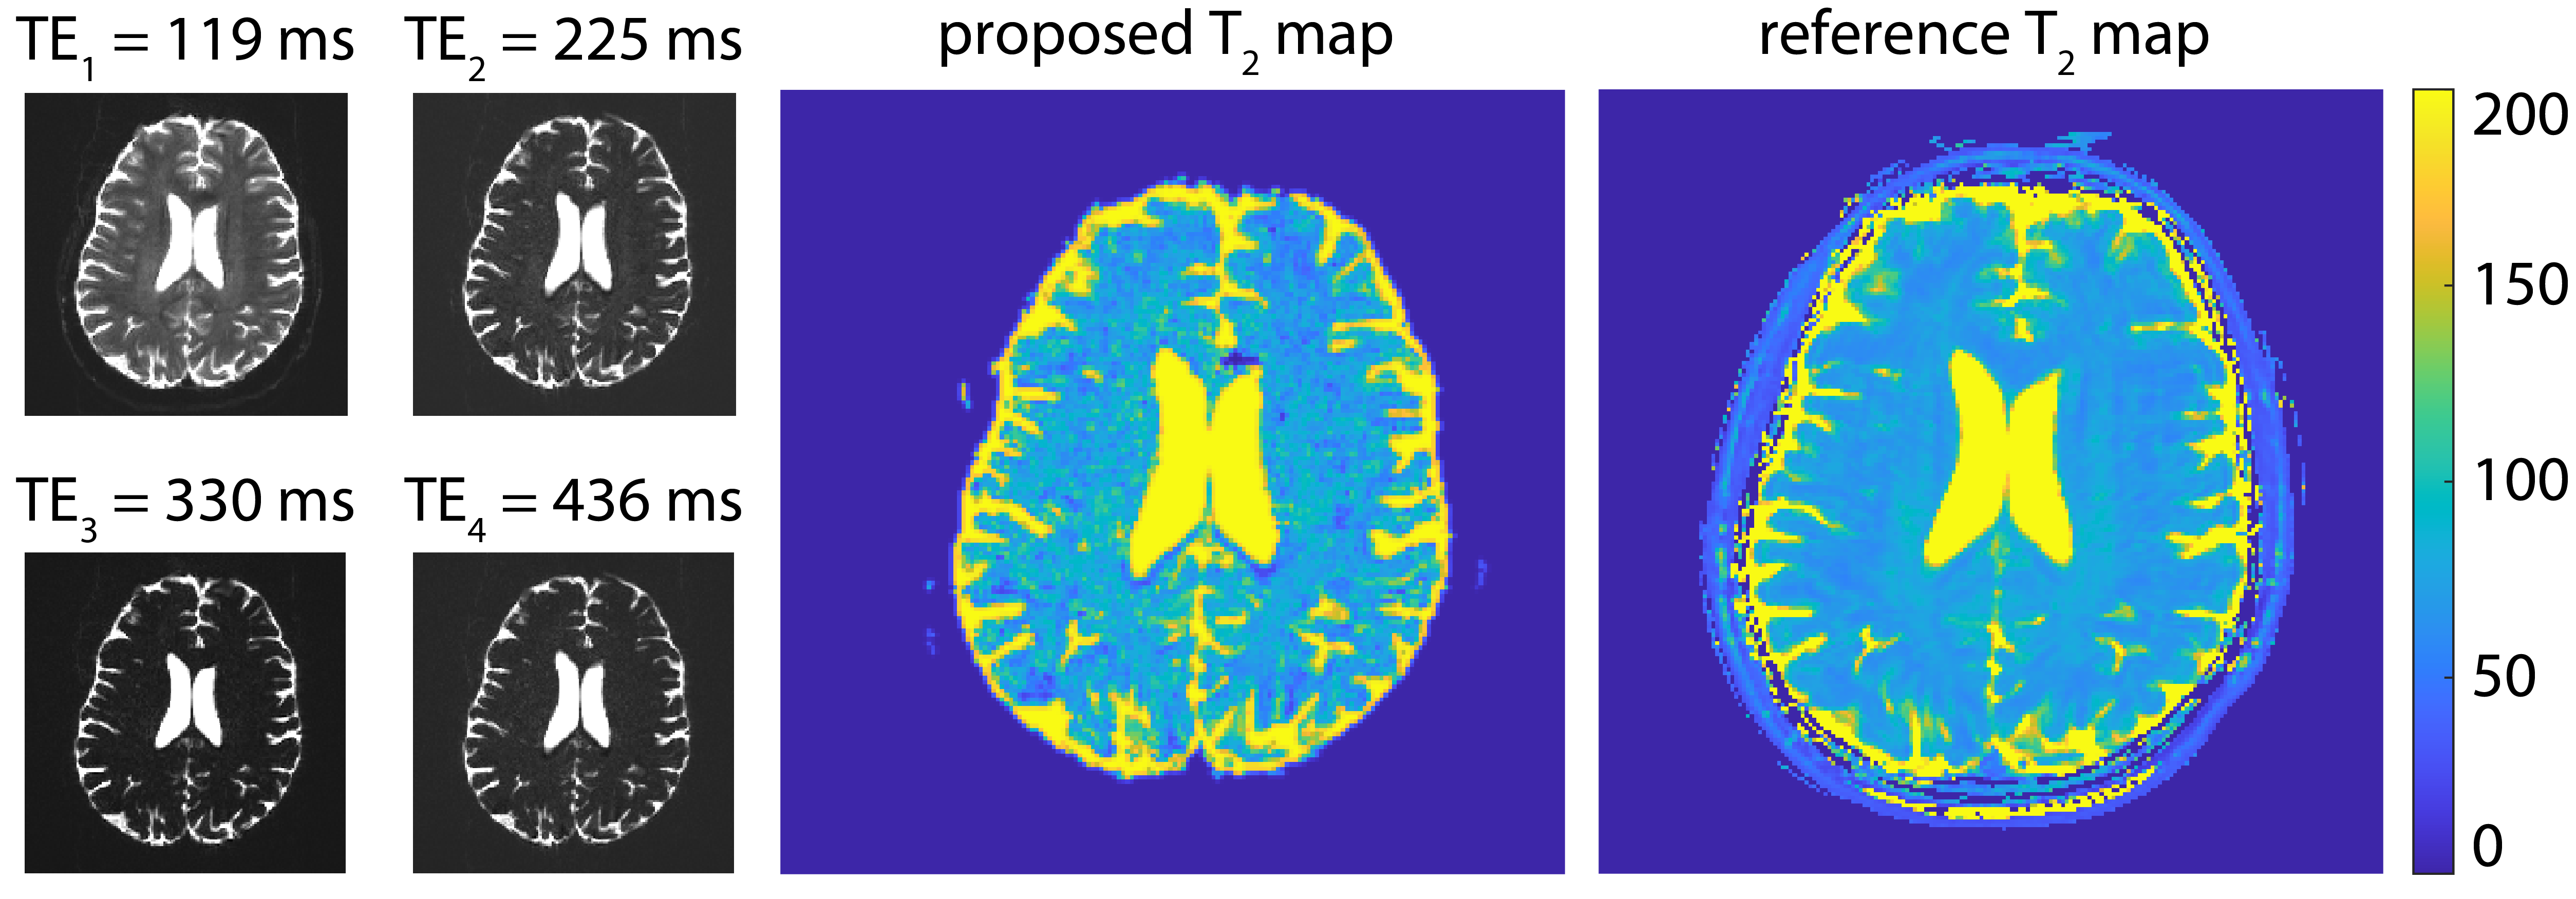
Figure 4 displays the T2 mapping estimations for the phantom measurements. The T2 values measured within each vial demonstrate close agreement with the reference up to 500 ms, followed by an underestimation of T2 relaxation times above 500 ms. This may be attributable to the inability to fully capture the slower signal decay with the set of parameters selected. Consistent with the phantom results, in vivo brain images show good correspondence with the T2 map from the 3D GRASE reference, as shown in Figure 5. Quantitative analysis yielded T2 values of 80.6 ± 11.6 ms and 96.3 ± 16.8 ms for gray matter and white matter respectively using the proposed method as opposed to the T2 values of 77.9 ± 14.3 and 93.2 ± 4.5 using the 3D GRASE.Discussion and Conclusion
In this work, the proposed multi-echo EPI pulse sequence achieved rapid T2 mapping while incorporating correction for geometric distortions. In order to eliminate artifacts caused by stimulated echoes, the sequence was modified to include spoiler gradients with variable strengths along the x, y, and z axes. By randomly altering the magnitude of the spoiler gradients in each direction, coherent stimulated echoes were suppressed. The acquisition of sequential echo readouts at varied effective echo times allowed estimation of T2 relaxation values without corruption by motion. T2 values exceeding 500 ms are commonly observed in cerebrospinal fluid (CSF), while brain tissues, exhibits T2 values within the range of 80-100 ms for gray and white matter. thus demonstrating the potential of our method as a quantitative diagnostic tool.Acknowledgements
This research was supported in part by NIH grant R01NS121657. Research reported in this publication was supported by the Office Of The Director, National Institutes Of Health of the National Institutes of Health under Award Number S10OD025111.References
- Ding, X.Q., Kucinski, T., Wittkugel, O., Goebell, E., Grzyska, U., Görg, M., Kohlschütter, A. and Zeumer, H., 2004. Normal brain maturation characterized with age-related T2 relaxation times: an attempt to develop a quantitative imaging measure for clinical use. Investigative radiology, 39(12), pp.740-746. https://doi.org/10.1097/00004424-200412000-00005
- Liao, C., Bilgic, B., Tian, Q., Stockmann, J.P., Cao, X., Fan, Q., Iyer, S.S., Wang, F., Ngamsombat, C., Lo, W.-C., Manhard, M.K., Huang, S.Y., Wald, L.L., Setsompop, K., 2021. Distortion-free, high-isotropic-resolution diffusion MRI with gSlider BUDA-EPI and multicoil dynamic B0 shimming. Magn. Reson. Med.86, 791–803. https://doi.org/10.1002/mrm.28748
- Cao X, Wang K, Liao C, et al. Efficient T2 mapping with blip-up/down EPI and gSlider-SMS (T2 -BUDA-gSlider). Magn Reson Med. 2021; 86: 2064-2075. https://doi.org/10.1002/mrm.28872
- Gallichan D, Andersson JL, Jenkinson M, Robson MD, Miller KL. Reducing distortions in diffusion-weighted echo planar imaging with a dual-echo blip-reversed sequence. Magn Reson Med 2010; 64: 382–390. https://doi.org/10.1002/mrm.22318
- Afacan O, Hoge WS, Wallace TE, Gholipour A, Kurugol S, Warfield SK. Simultaneous motion and distortion correction using dual- echo diffusion weighted MRI. J Neuroimaging 2020; 30 3: 276-285. https://doi.org/10.1111/jon.12708
- Smith SM. Fast robust automated brain extraction. Human Brain Mapping 2002;17:143–55. https://doi.org/10.1002/hbm.10062
- Andersson JL, Skare S, and Ashburner J, How to correct susceptibility distortions in spin-echo echo-planar images: application to diffusion tensor imaging Neuroimage, 20 (2) (2003), pp. 870-888. https://doi.org/10.1016/s1053-8119(03)00336-7
- Jenkinson, M., Beckmann, C. F., Behrens, T. E. J., Woolrich, M. W. & Smith, S. M. FSL. Neuroimage 62, 782–790 (2012). https://doi.org/10.1016/j.neuroimage.2011.09.015
- Karakuzu, A. et al. qMRLab: Quantitative MRI analysis, under one umbrella. J. Open Source Software. 5, 2343 (2020). https://doi.org/10.1016/j.neuroimage.2011.09.015
- Piredda GF , Hilbert T , Canales-Rodriguez EJ , et al. Fast and high-resolution myelin water imaging: Accelerating multi-echo GRASE with CAIPIRINHA. Magn Reson Med. 2021;85:209-222. https://doi.org/10.1002/mrm.28427
- Bernstein, M. A., King, K. F. & Zhou, X. J. Handbook of MRI Pulse Sequences (Academic Press, 2004).
- Keenan KE, Stupic KF, Russek SE, Mirowski E. MRI-visible liquid crystal thermometer. Magn Reson Med. 2020; 84: 1552-1563. https://doi.org/10.1002/mrm.28224
Figures