3819
A maximum a posteriori method for quantitative $$$T_1$$$ mapping with uncertainty using MP2RAGE1Department of Electrical and Computer Engineering, Vanderbilt University, Nashville, TN, United States, 2Vanderbilt University Institute of Imaging Science, Vanderbilt University Medical Center, Nashville, TN, United States, 3Department of Radiology and Radiological Sciences, Vanderbilt University Medical Center, Nashville, TN, United States, 4Department of Biomedical Engineering, Vanderbilt University, Nashville, TN, United States, 5Department of Computer Science, Vanderbilt University, Nashville, TN, United States
Synopsis
Keywords: Quantitative Imaging, Quantitative Imaging, Brain, Simulations, Signal Representations, T1 Mapping
Motivation: The MP2RAGE sequence allows for quantitative MRI imaging of $$$T_1$$$ in the brain, but current methods do not provide a way to measure uncertainty in this mapping.
Goal(s): We introduce a probabilistic signal representation to allow for $$$T_1$$$ mapping with uncertainty maps.
Approach: Using a Monte Carlo simulation, we generate a probability distribution for the MP2RAGE images that allows us to map the posterior distribution of $$$T_1$$$ and generate a measure of uncertainty.
Results: Our $$$T_1$$$ map numerically agrees with previous single-echo MP2RAGE methods with limited data while providing a way to map statistical measures like expected value or standard deviation.
Impact: Our posterior distribution allows for uncertainty quantification in $$$T_1$$$ mapping with MP2RAGE, and it opens up the possibility for other probabilistic methods. The proposed method allows for a better quantitative understanding with only a minor modification to the acquisition sequence.
Introduction
Quantitative $$$T_1$$$ mapping allows for measurement of magnetic resonance relaxation tissue parameters independent of scanner differences across sites. While there are many methods for quantitative $$$T_1$$$ mapping, the magnetization prepared two rapid acquisition gradient echoes (MP2RAGE) sequence offers an alternative to gold-standard $$$T_1$$$ mapping methods with a much shorter acquisition time.1 By mathematically modeling the gradient echo readout (GRE) images, we can generate a quantitative $$$T_1$$$ map from the MP2RAGE image.2 However, state-of-the-art approaches lack methods to quantify the uncertainty in this $$$T_1$$$ map.Here, we use a Monte Carlo simulation to estimate the posterior probability of multi-echo MP2RAGE values from a set of $$$T_1$$$ values. Previous work has shown how multi-echo MP2RAGE can create estimates for $$$T_2^*$$$ and magnetic susceptibility, but $$$T_1$$$ maps were still calculated using a single echo.3,4 Here, we find the maximum a posteriori (MAP) estimate of $$$T_1$$$ from multi-echo MP2RAGE images, allowing us to map statistical values like the expected value and standard deviation of $$$T_1$$$.
Methods
The MP2RAGE image combines information from multiple GREs to create a $$$T_1$$$-weighted image independent of $$$T_2^*$$$ and $$$M_0$$$. Given two complex-valued GRE images $$$\text{GRE}_1$$$ and $$$\text{GRE}_2$$$ collected at inversion times $$$TI_1$$$ and $$$TI_2$$$, the corresponding MP2RAGE image is$$S_{1,2} = \text{Re}\left(\frac{\text{GRE}_1^*\text{GRE}_2}{|\text{GRE}_1|^2+|\text{GRE}_2|^2}\right).$$
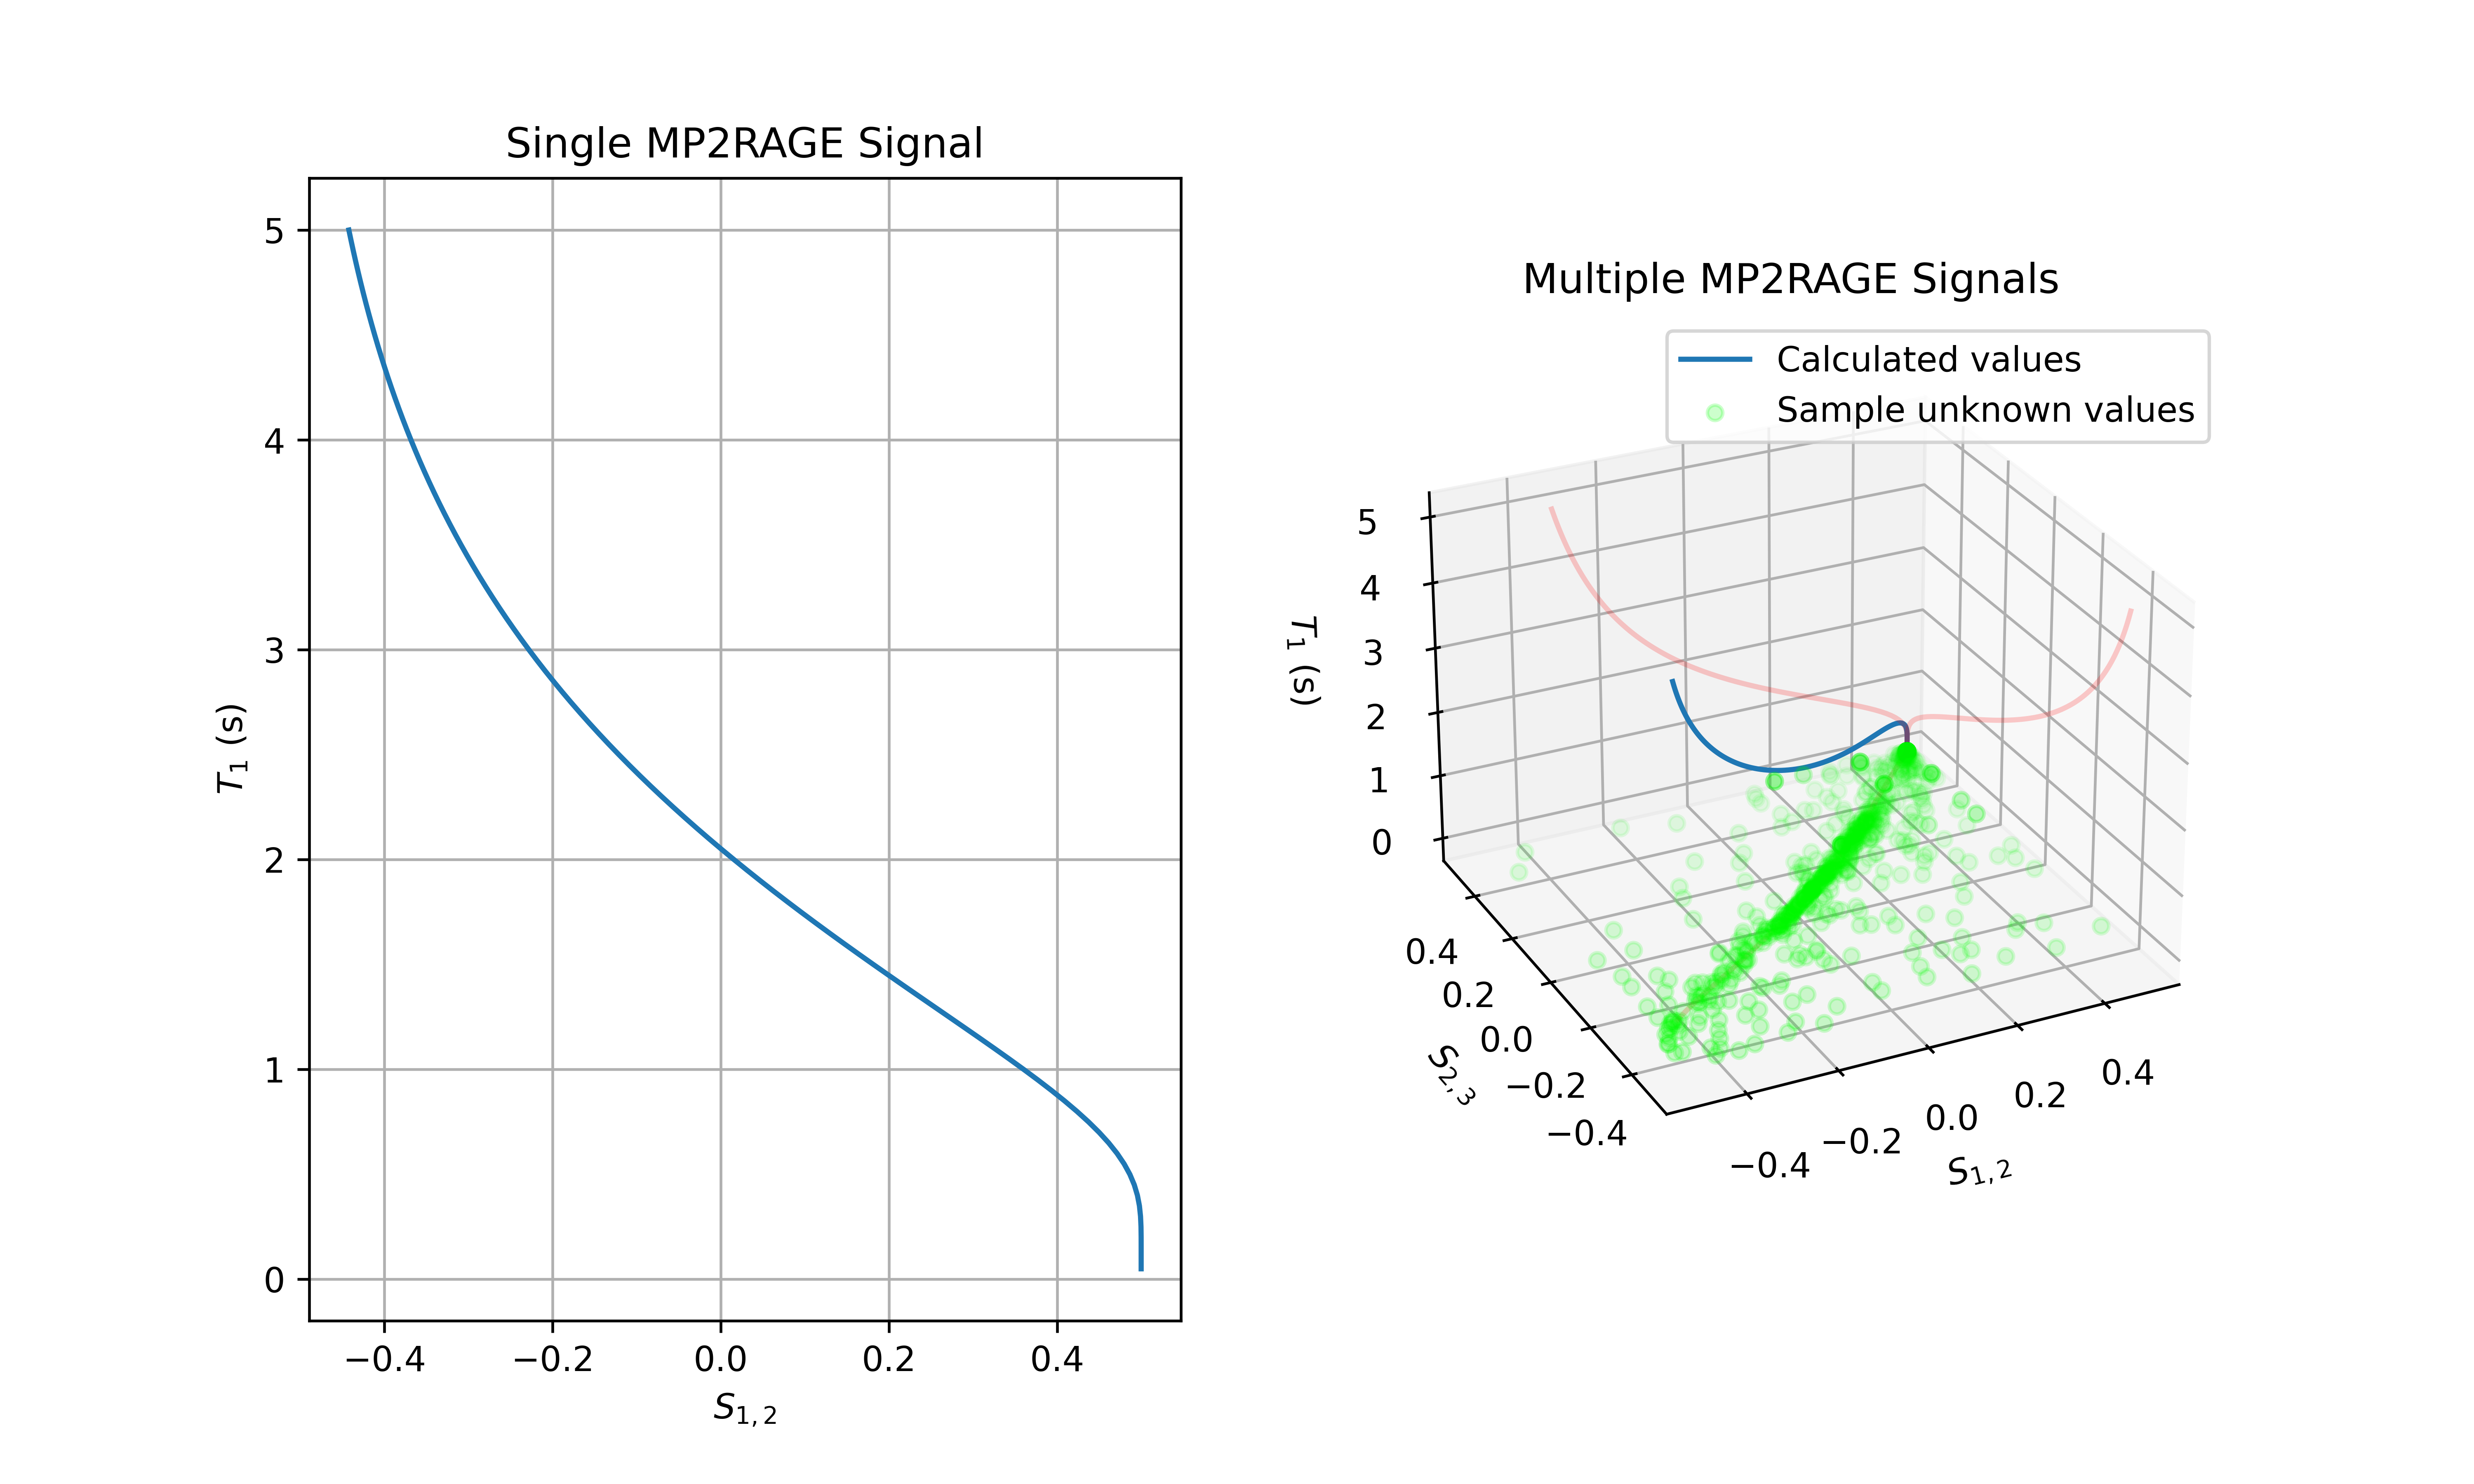
From the acquisition parameters, we mathematically model the GREs for a range of $$$T_1$$$ values to create a lookup table for $$$T_1$$$ given $$$S_{1,2}$$$.2 With the addition of a third GRE, we can calculate the pairwise MP2RAGE images $$$S_{1,2}$$$ and $$$S_{2,3}$$$. However, we cannot create a lookup table since the signal equations do not cover all potential values for $$$S_{1,2}$$$ and $$$S_{2,3}$$$, especially since there is noise inherent to the acquired GREs (Fig. 1).
Using a Monte Carlo simulation, we can calculate what $$$S_{1,2}$$$ and $$$S_{2,3}$$$ would be for GREs with additive Gaussian noise ($$$\sigma^2=0.005$$$ estimated from the corpus callosum of an acquired GRE). We simulate 100 million trials to estimate the posterior distribution of $$$S_{1,2}$$$, $$$S_{2,3}$$$, and $$$T_1$$$. From this distribution, we calculate the MAP estimate of $$$T_1$$$ using a uniform prior. We calculate the likelihood of $$$T_1$$$ given MP2RAGE image values $$$S_{1,2}$$$ and $$$S_{2,3}$$$ under the model with Gaussian noise $$$\mathcal{L}_g({T_1|S_{1,2},S_{2,3}})$$$. We estimate this probability by summing all simulated occurrences in the voxel containing $$$S_{1,2}$$$, $$$S_{2,3}$$$, and $$$T_1$$$ and normalizing by the sum of occurrences of $$$T_1$$$ across all values of $$$S_{1,2}$$$ and $$$S_{2,3}$$$. We compare this likelihood to the likelihood of $$$T_1$$$ under a uniform model, $$$\mathcal{L}_u({T_1|S_{1,2},S_{2,3}})=c$$$, where $$$c$$$ is a constant value. We create a relative likelihood
$$\alpha = \frac{\max\mathcal{L}_g({T_1|S_{1,2},S_{2,3}})}{\max\mathcal{L}_g({T_1|S_{1,2},S_{2,3}}) + \mathcal{L}_u({T_1|S_{1,2},S_{2,3}})}$$
and generate a 2D lookup table where $$$\alpha$$$ is greater than a threshold of $$$T=0.5$$$, assigning each voxel to the maximum likelihood estimate of $$$T_1$$$, which corresponds to the MAP estimate under a uniform prior. We assign voxels where $$$\alpha<T$$$ to $$$T_1=0$$$.
From the posterior distribution, we can calculate other statistical metrics. For example, we can calculate the expected value and standard deviation of $$$P(T_1|S_{1,2},S_{2,3})$$$, which provides a measure of uncertainty for $$$T_1$$$.
To test this method, we obtained 3 GREs from a patient scanned on a 7T Philips Achieva scanner at Vanderbilt University Medical Center, acquired from ImageVU under IRB 111087. The acquisition consisted of a typical MP2RAGE sequence modified by the addition of a third GRE to allow for greater flexibility in $$$T_1$$$ mapping while maintaining the same $$$\text{MP2RAGE}_{TR}$$$. The parameters were $$$TI_1=1010\;\text{ms}$$$, $$$TI_2=3310\;\text{ms}$$$, $$$TI_3=5610\;\text{ms}$$$, $$$TR=6\;\text{ms}$$$, and $$$\text{MP2RAGE}_{TR}=8.25\;\text{s}$$$. Each GRE block used 225 pulses, flip angles of 4°, and an inversion pulse efficiency of 0.84. We generated the MAP estimate of $$$T_1$$$, expected value, and standard deviation of $$$T_1$$$ to compare to the original single-echo MP2RAGE $$$T_1$$$ map.
Results and Discussion
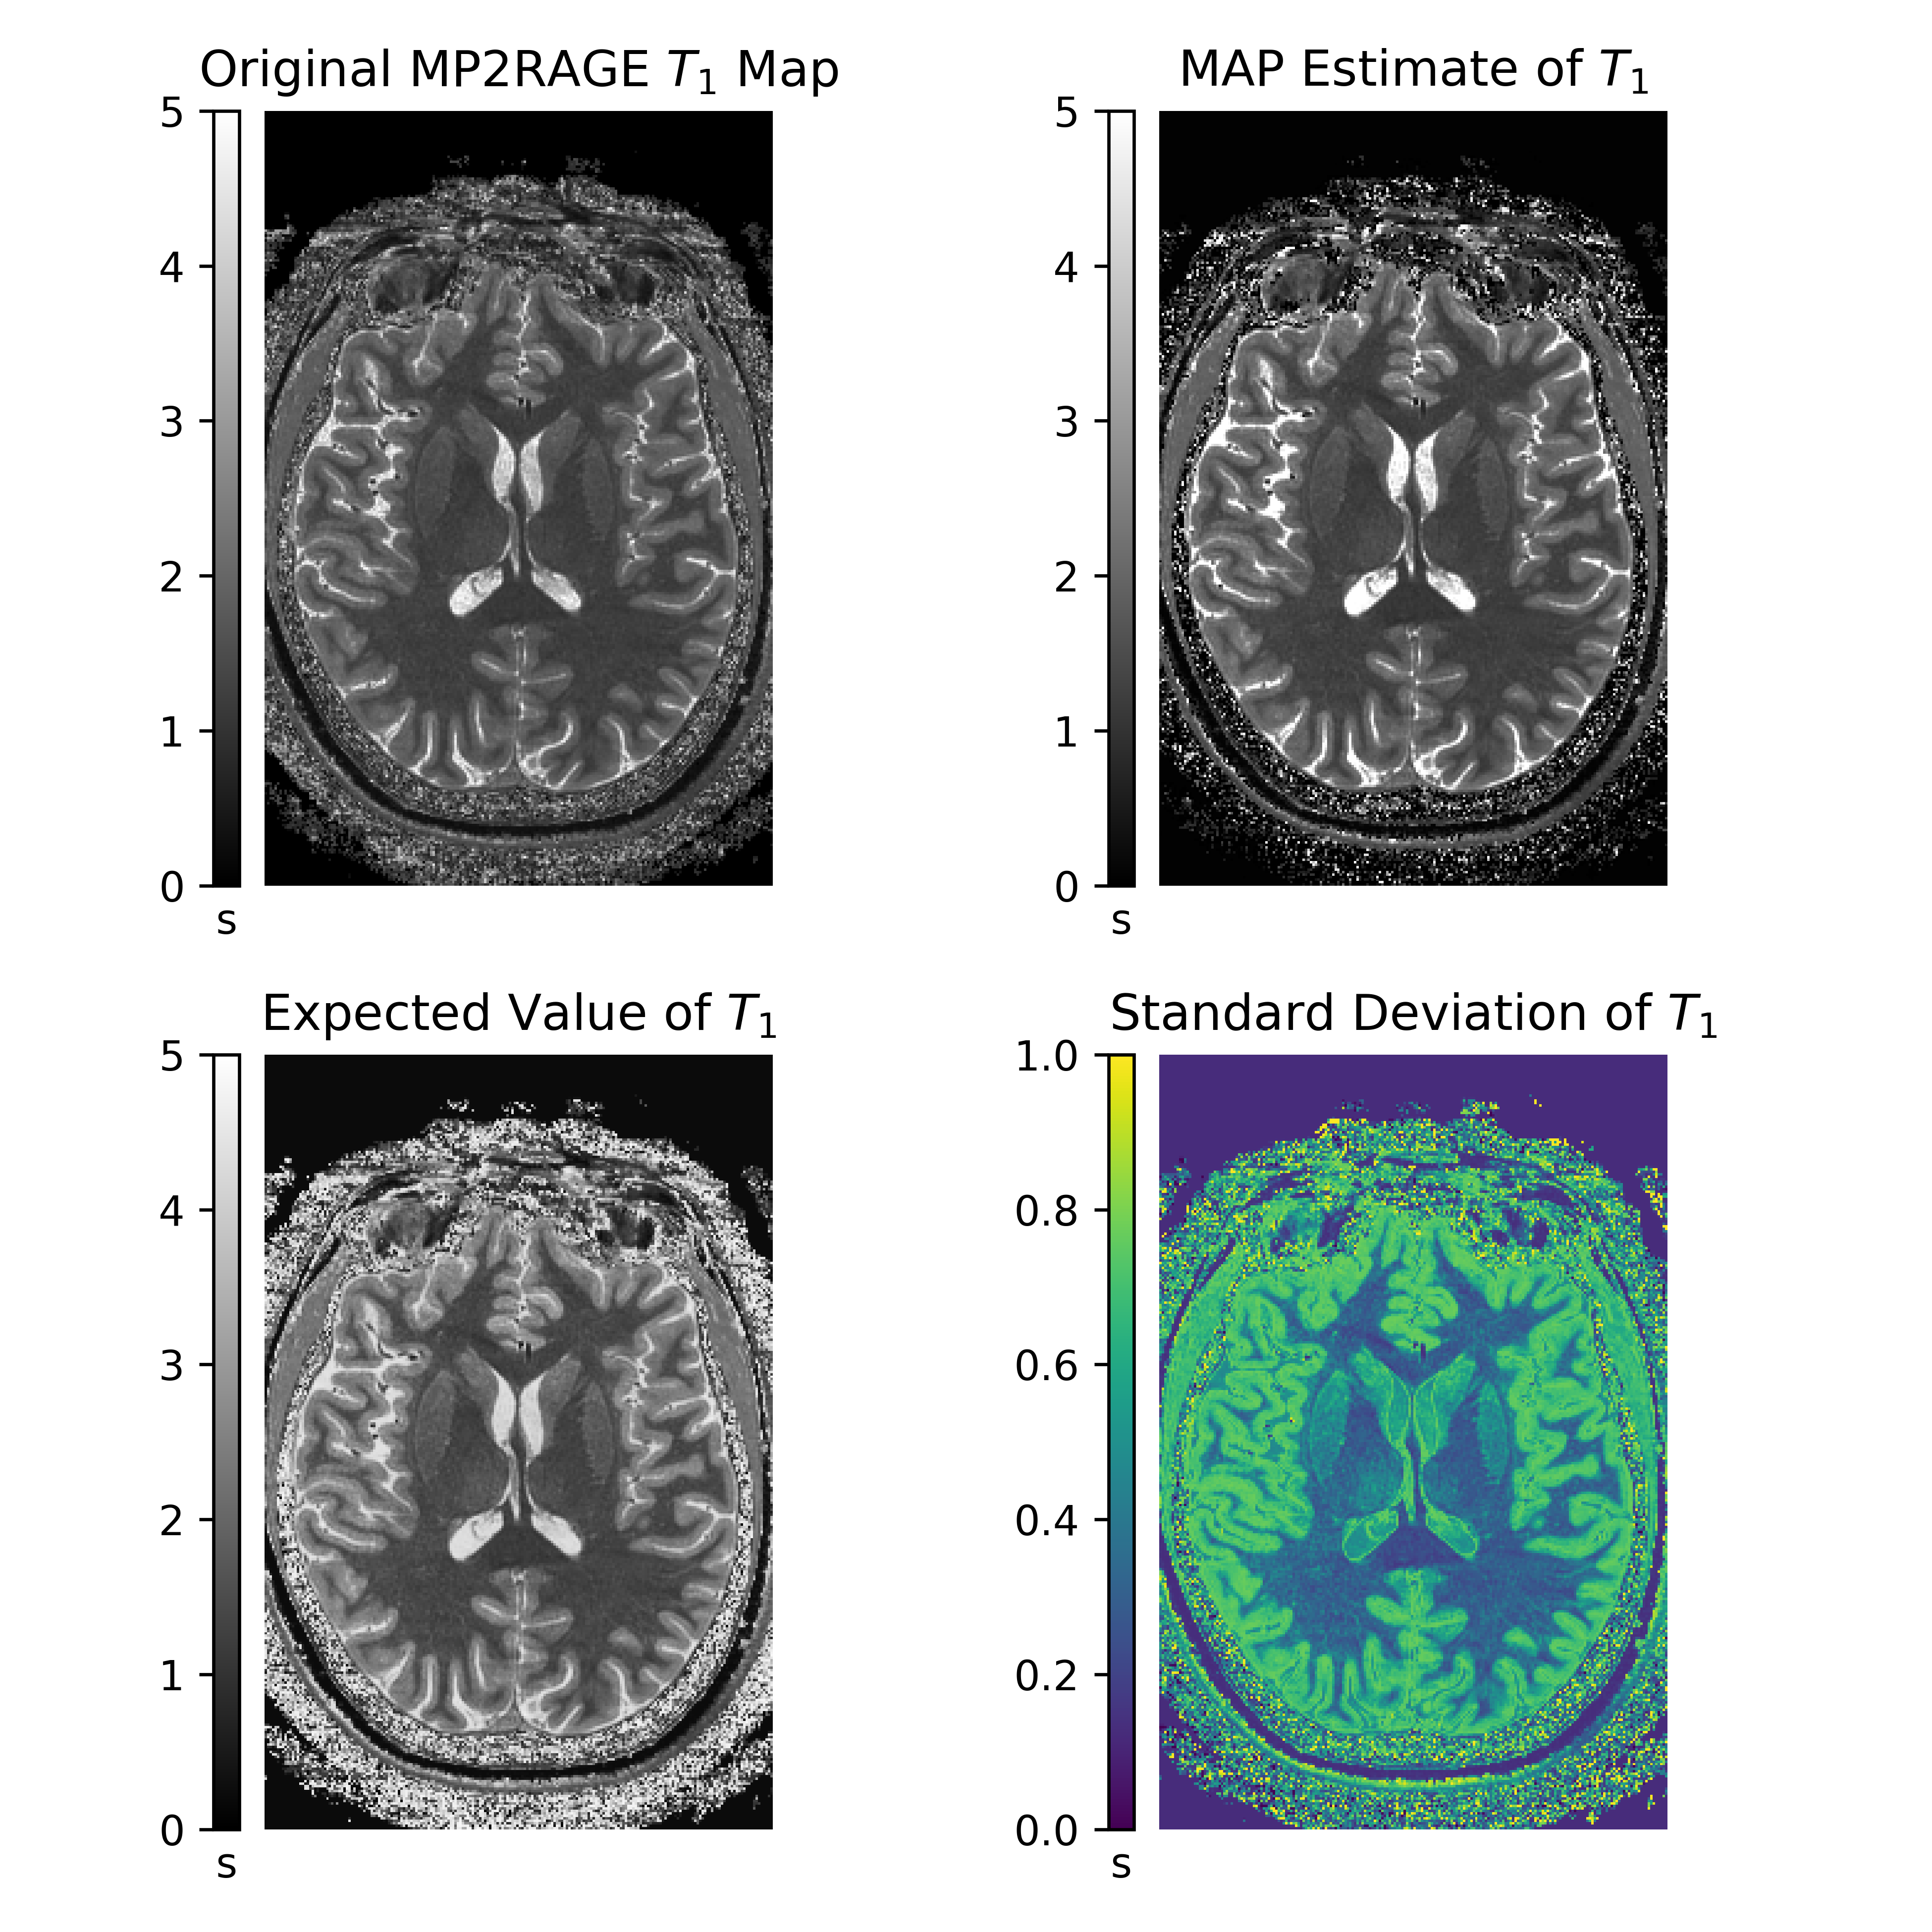
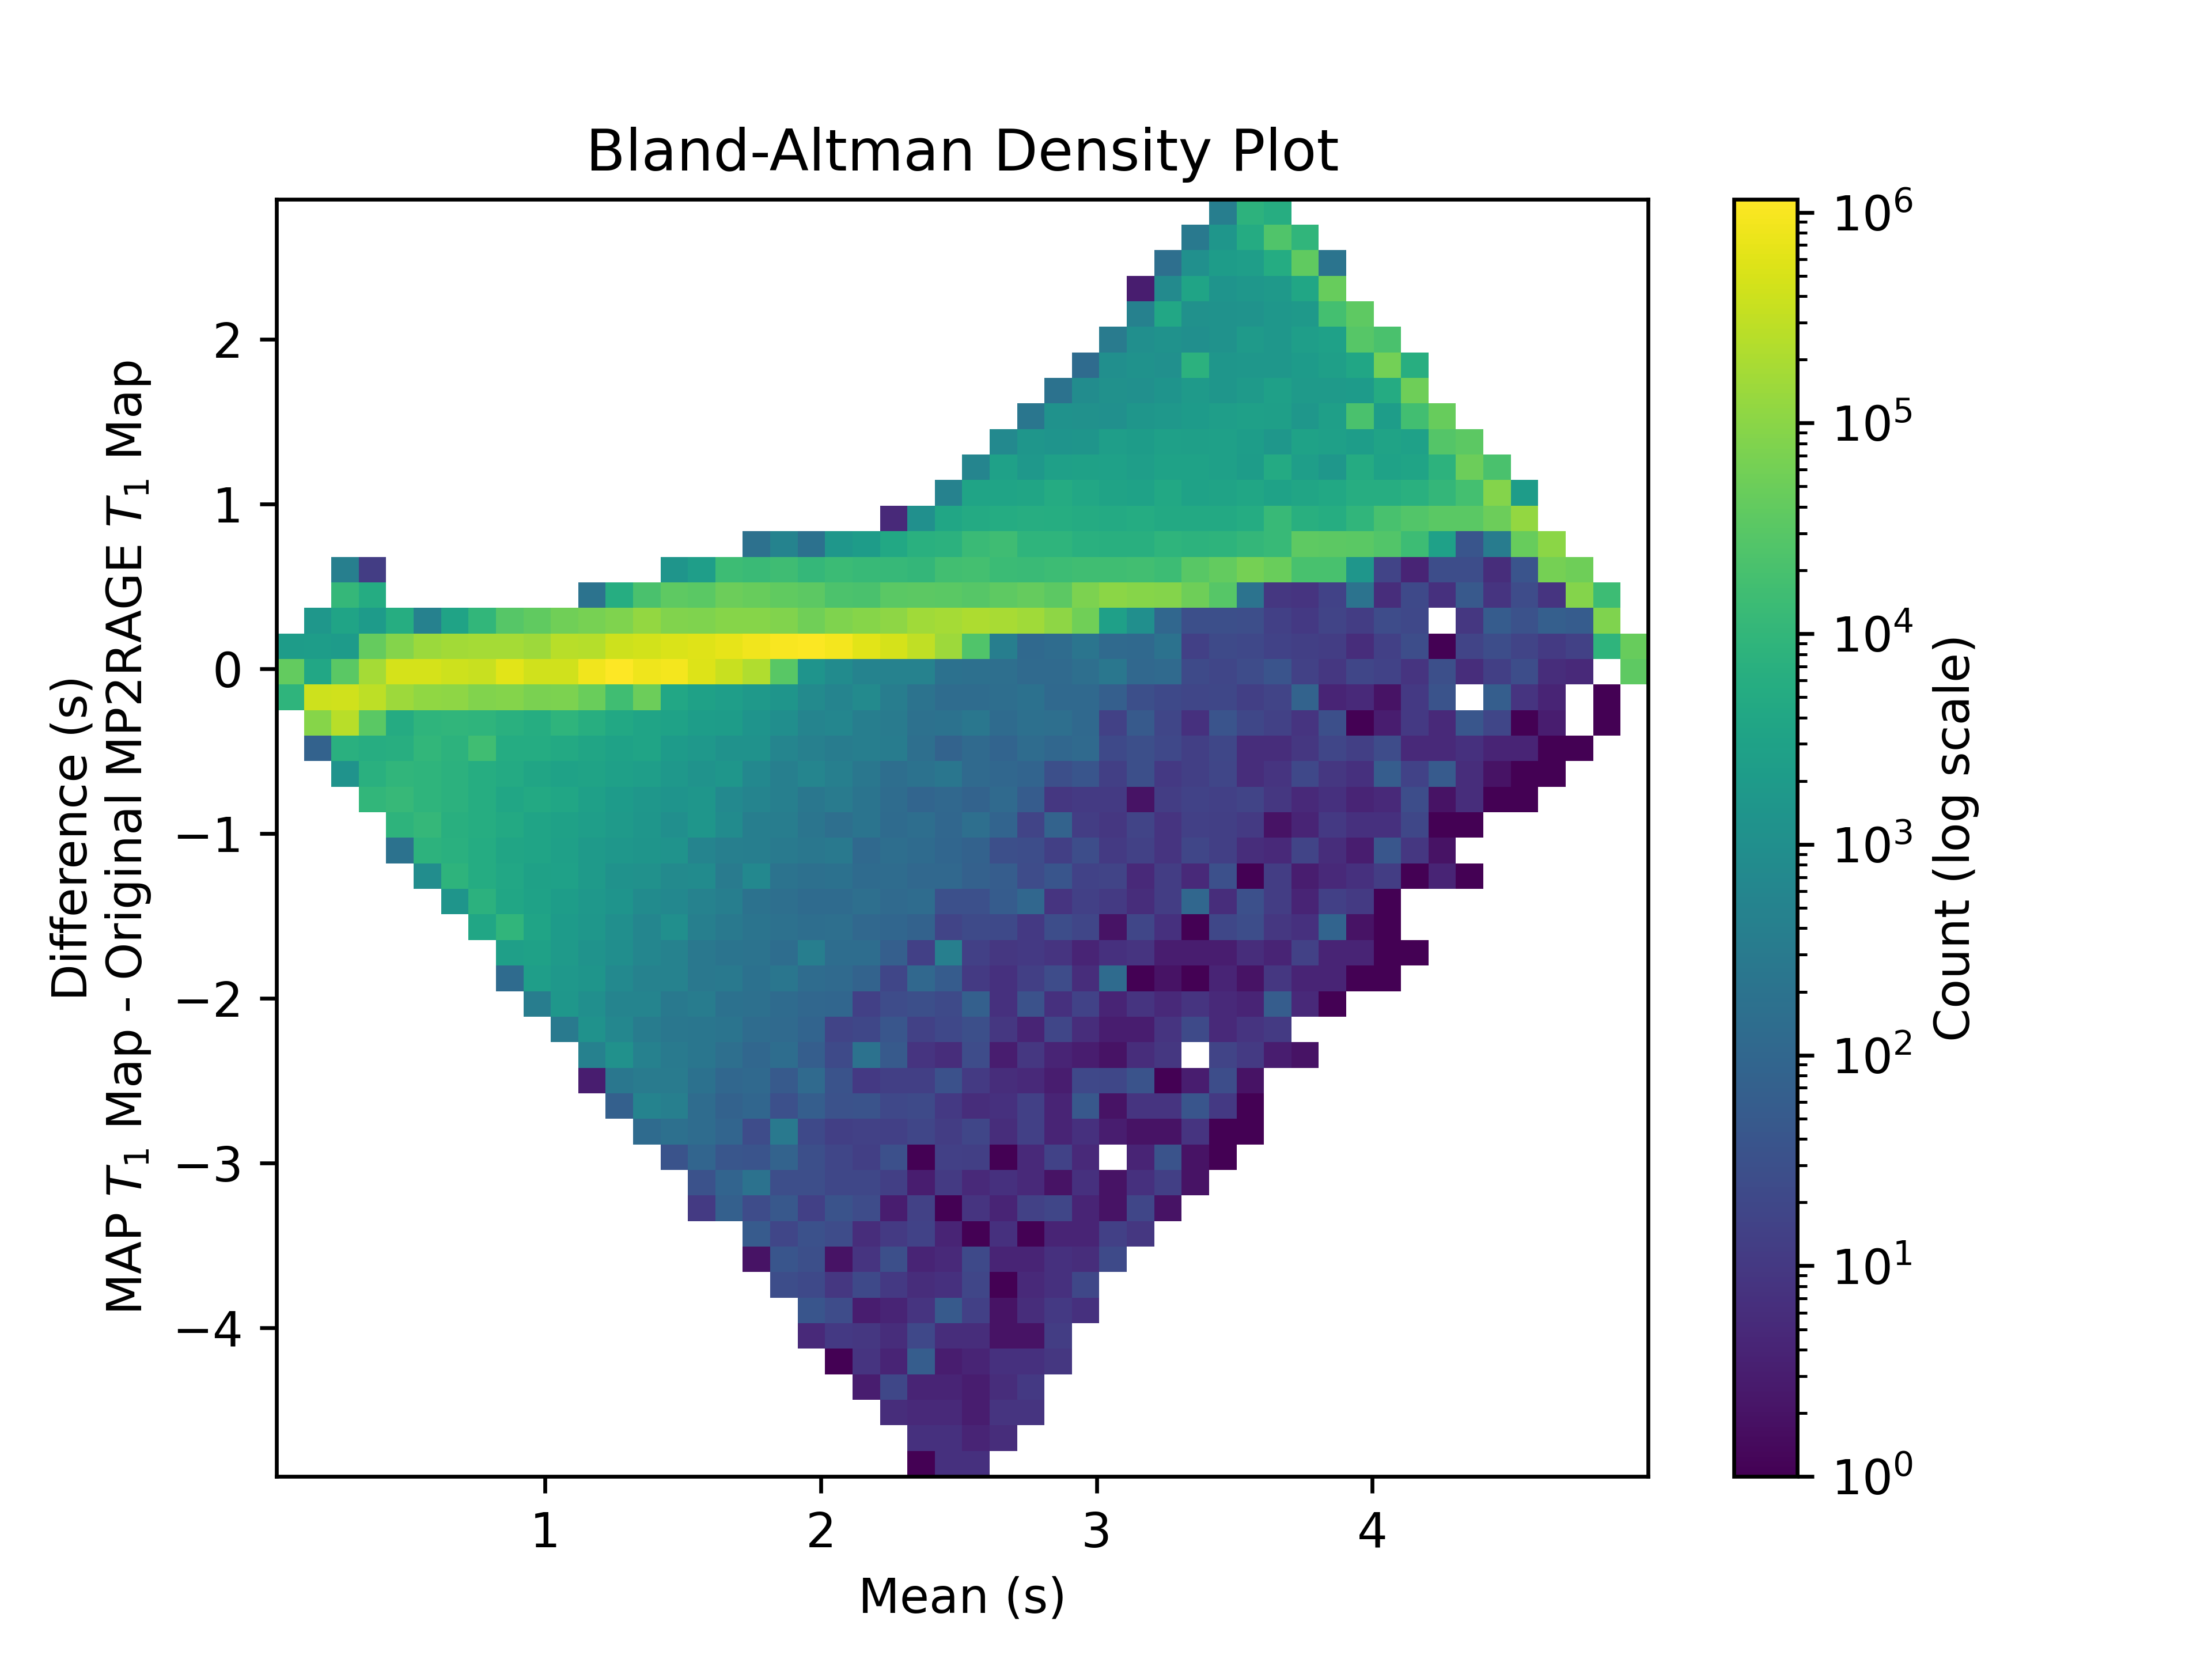
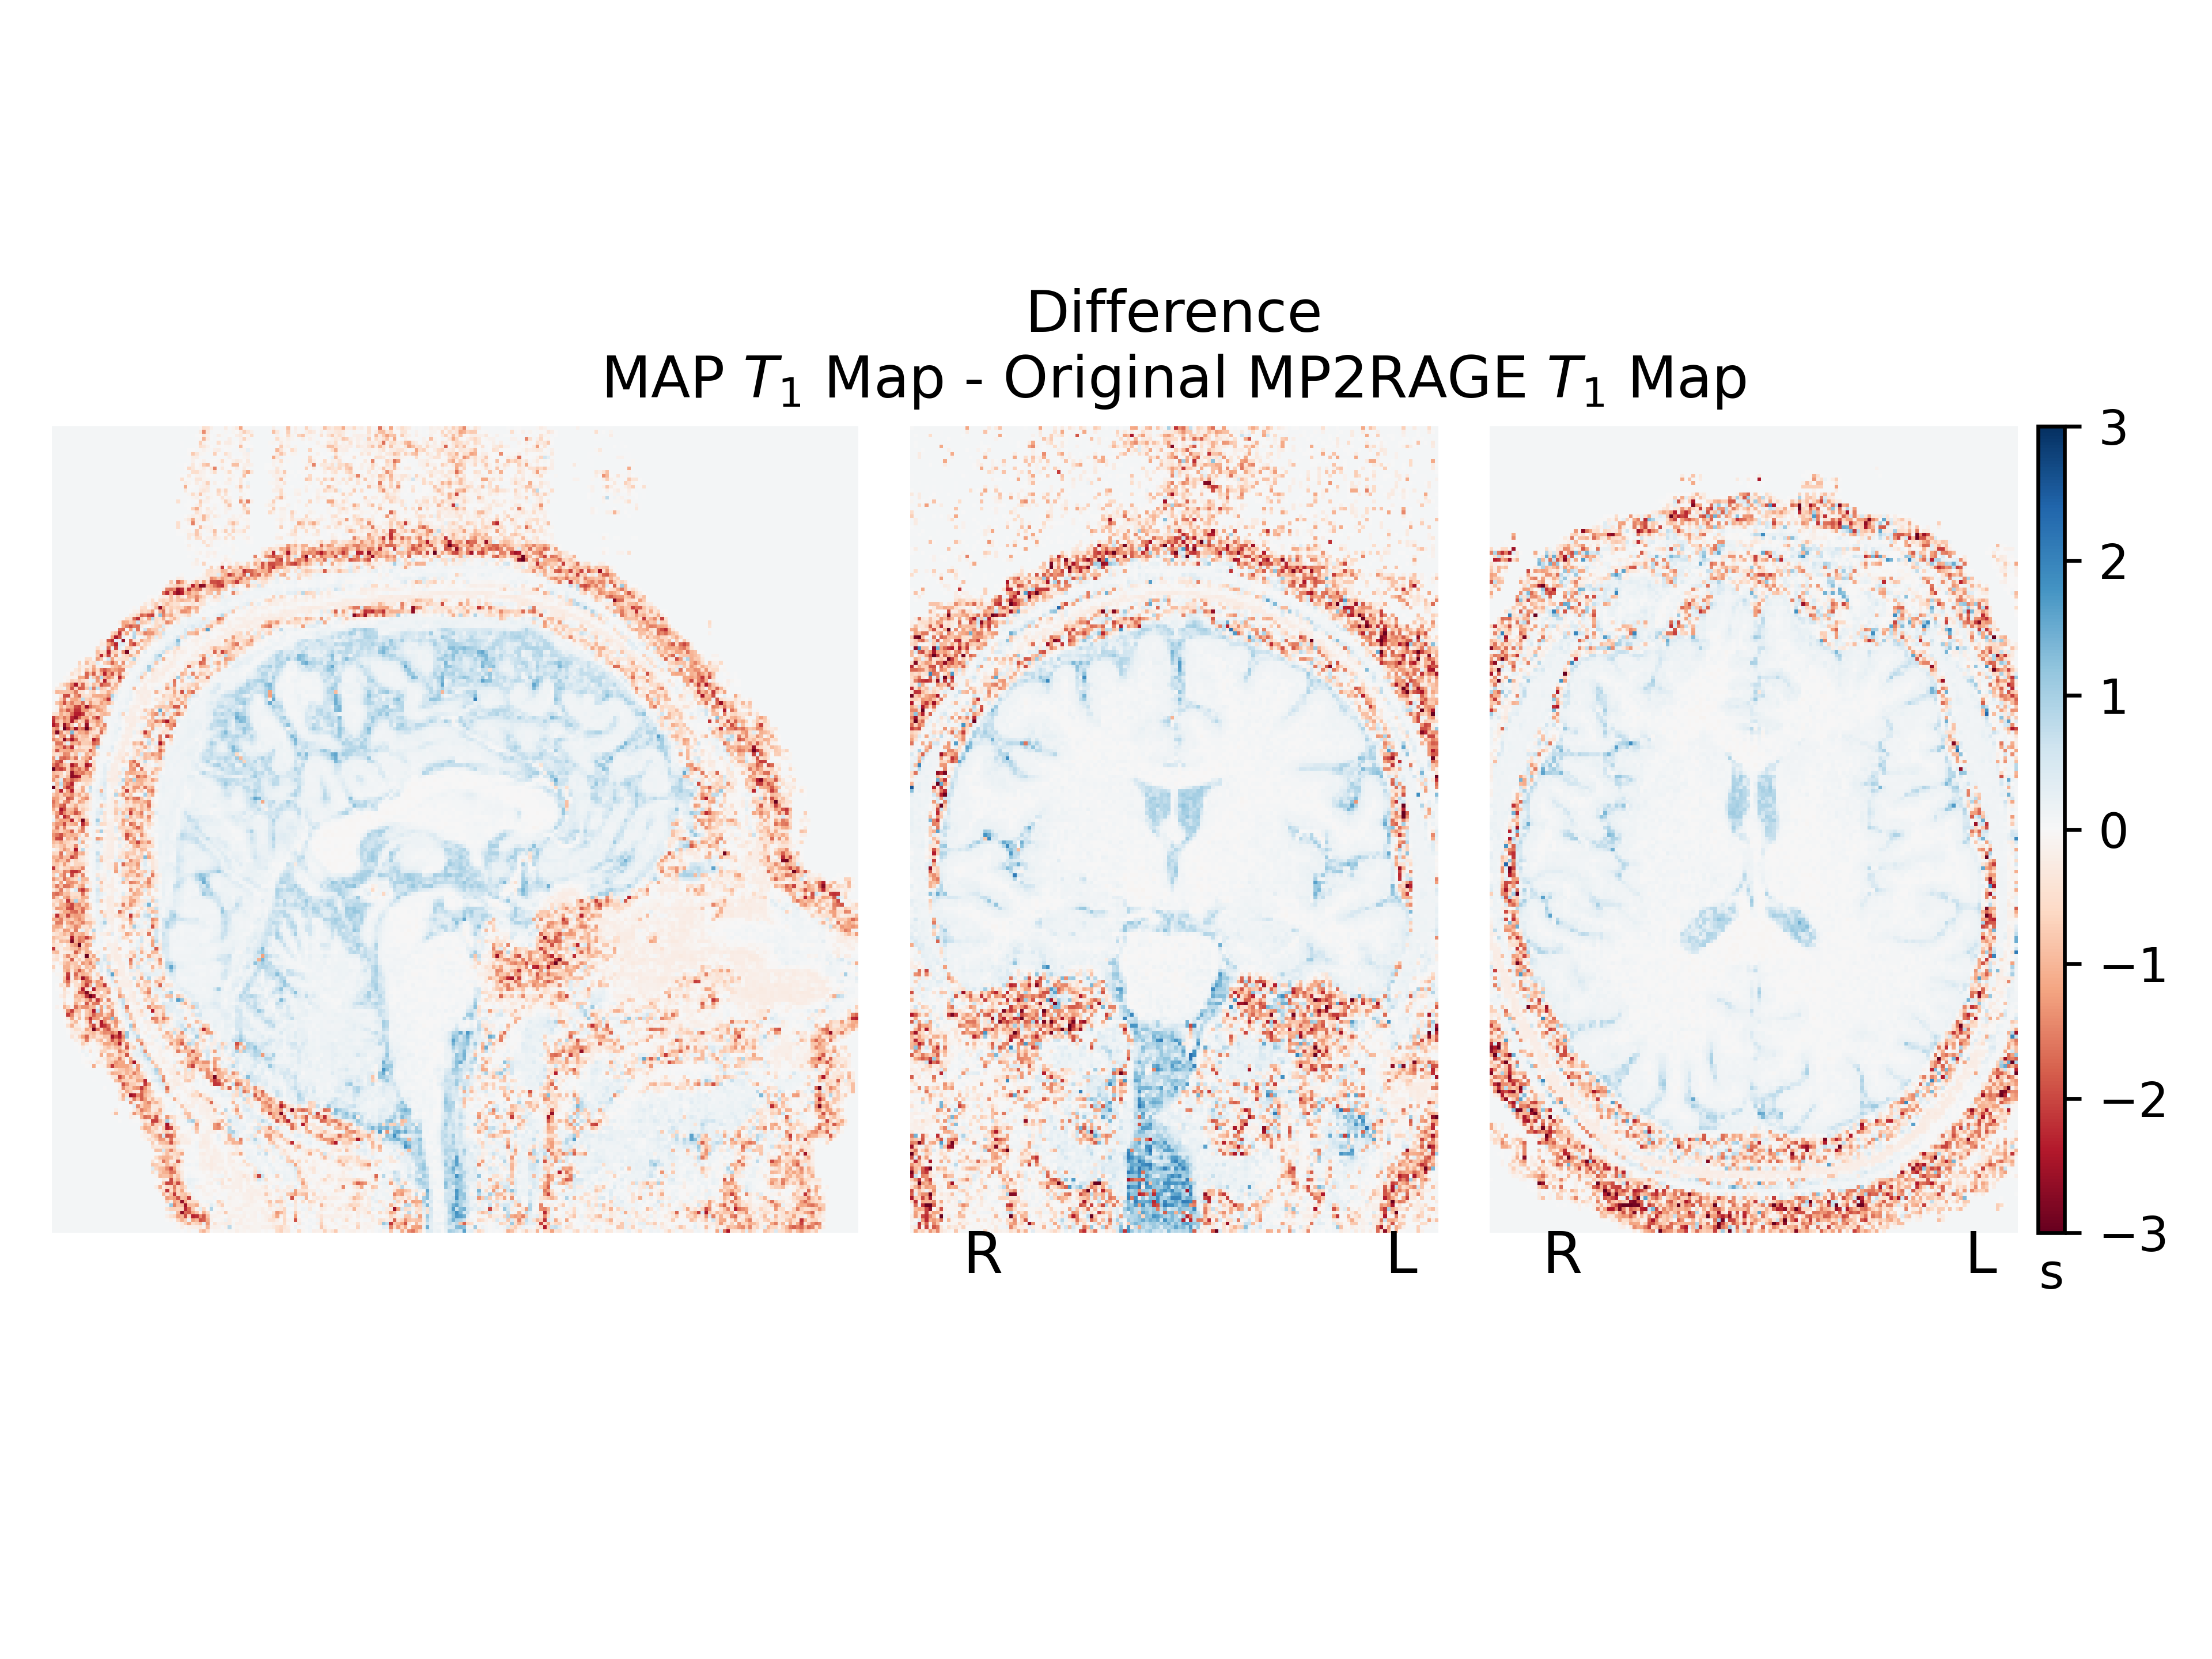
The MAP estimate and expected value maps for $$$T_1$$$ appear qualitatively similar to the typical single-echo method. The standard deviation map aligns with our intuition, with noisier areas corresponding to a higher standard deviation (Fig. 2). The single-echo $$$T_1$$$ map and multi-echo MAP estimate of $$$T_1$$$ agree numerically, with no major biases between the two (Fig. 3). The two estimates produce similar $$$T_1$$$ values in the brain (Fig. 4).Conclusion
The probabilistic approach described here allows us to combine information from multiple echoes. The Monte Carlo simulation opens the possibility for statistical measures on the posterior distribution of $$$T_1$$$ like the MAP estimate and standard deviation, providing a measure of uncertainty. While our method relies on knowledge of the noise level in the GREs, it allows for a better statistical understanding of the quantitative mapping with only a minor modification to the MP2RAGE sequence that does not require additional scan time.Acknowledgements
This work was supported by NIH grants 5K01EB030039, 5F32NS101788, and K01EB032898.References
- Tsialios P, Thrippleton M, Glatz A, Pernet C. Evaluation of MRI sequences for quantitative T1 brain mapping. J Phys Conf Ser 2017; 931.
- Marques JP, Kober T, Krueger G, van der Zwaag W, Van de Moortele PF, Gruetter R. MP2RAGE, a self bias-field corrected sequence for improved segmentation and T1-mapping at high field. Neuroimage 2010; 49: 1271–1281.
- Metere R, Kober T, Möller HE, Schäfer A. Simultaneous quantitative MRI mapping of T1, T2* and magnetic susceptibility with multi-echo MP2RAGE. PLoS One 2017; 12.
- Caan MWA, Bazin P, Marques JP, de Hollander G, Dumoulin SO, van der Zwaag W. MP2RAGEME: T1, T2*, and QSM mapping in one sequence at 7 Tesla. Hum Brain Mapp 2019; 40: 1786–1798.
Figures