3818
Decoding Sensitivity of Quantitative Susceptibility Mapping: Influence of Background Field Removal and Inversion Algorithms1Buffalo Neuroimaging Analysis Center, Department of Neurology at the Jacobs School of Medicine and Biomedical Sciences, University at Buffalo, The State University of New York, Buffalo, NY, United States, 2Jacobs Multiple Sclerosis Center, Department of Neurology, Jacobs School of Medicine and Biomedical Sciences, University at Buffalo, The State University of New York, Buffalo, NY, United States, 3Department of Computer Science and Automation, Technische Universitat Ilmenau, Ilmenau, Germany, 4Center for Biomedical Imaging, Clinical and Translational Science Institute, University at Buffalo, The State University of New York, Buffalo, NY, United States
Synopsis
Keywords: Quantitative Imaging, Quantitative Susceptibility mapping, Dipole inversion, BFR, Background field, Sensitivity, Reproducibility, Reference region
Motivation: Quantitative Susceptibility Mapping (QSM) is widely applied in clinical research. However, its accuracy relies on the choice of background field removal (BFR) and inversion algorithms. This raises the question: What is the sensitivity of algorithms toward the detection of in-vivo group differences and over-time susceptibility changes?
Goal(s): Explore the impact of BFR and inversion algorithms on the detection of over-time susceptibility changes.
Approach: Utilizing six BFRs and twenty-one inversion algorithms, we studied the sensitivity to detect aging-related over-time susceptibility changes.
Results: RESHARP+iSWIM within overall DGM, RESHARP+AMP-PE in putamen, PDF+IterTIK in caudate, PDF+TKD in globus pallidus and RESHARP+iSWIM in thalamus demonstrated the highest sensitivity.
Impact: The importance of algorithm and reference region choice in QSM studies, impacting findings beyond demographics and clinical characteristics. Future research should employ varied QSM algorithms to assess their impact on longitudinal QSM changes, enhancing the quality of clinical investigations.
Introduction
Quantitative Susceptibility Mapping (QSM) is increasingly being applied in clinical research, particularly for quantifying brain iron levels in neurodegenerative diseases and studying normal aging.1-3 To foster QSM’s clinical translation technical consensus recommendations4 have recently been presented.Accurate susceptibility measurements rely on precise background field removal (BFR) and dipole inversion.4 Benchmarking studies have explored similarities, differences, and limitations of BFR and dipole inversion algorithms5,6,7, demonstrating that algorithms exist that can reconstruct susceptibility maps with very high-quality when compared to the respective gold standard susceptibility map. However, these benchmarking studies have limited practical relevance because they leave a critical question unanswered: What is the sensitivity of algorithms toward the detection of group differences and over-time changes?
In the present study, we aimed to answer this question by investigating the sensitivity of top-ranked (QSM challenge7) and widely-used algorithms12-35 in detecting group-level changes in brain susceptibility. Our research extends an investigation presented at the 2023 ISMRM meeting8 by incorporating additional algorithms, optimizing algorithmic parameters in collaboration with original developers, and facilitating a direct comparison to the age-related brain iron changes reported by Hallgren and Sourander (H&S) in 1958.9
Methods
Given the absence of in-vivo brain susceptibility ground truth, our assessment relied on the assumption that over-time DGM susceptibility changes in healthy adults align with H&S’s established aging-related non-heme iron concentration changes.9Participants: We enrolled N=23 healthy subjects who participated in previous studies that included a specific QSM sequence8,10 when their age was at least 37 years. In this age range, H&S reported increasing iron in globus pallidus (GP), caudate, and putamen, and decreasing iron in thalamus. Additionally, DGM myelin levels are stable in this age range.37 We enrolled subjects in the order of the date of their first available scan to maximize follow-up time in the final dataset.
Data acquisition: We acquired follow-up QSM (median=10 years) at the same scanner and with the same sequence as the baseline scan.8 We conducted scan-rescan experiments in five subjects (four repeats with full repositioning).10
QSM Reconstruction38: Best-path unwrapping11 was followed by six BFR algorithms12-17, 4th order polynomial fitting, 21 inversion algorithms applied to each BFR18-35, and whole brain referencing to minimize variation.10 For deep-learning (DL) methods, field maps were rotated (axial) and resampled (isotropic); susceptibility maps were transformed back.
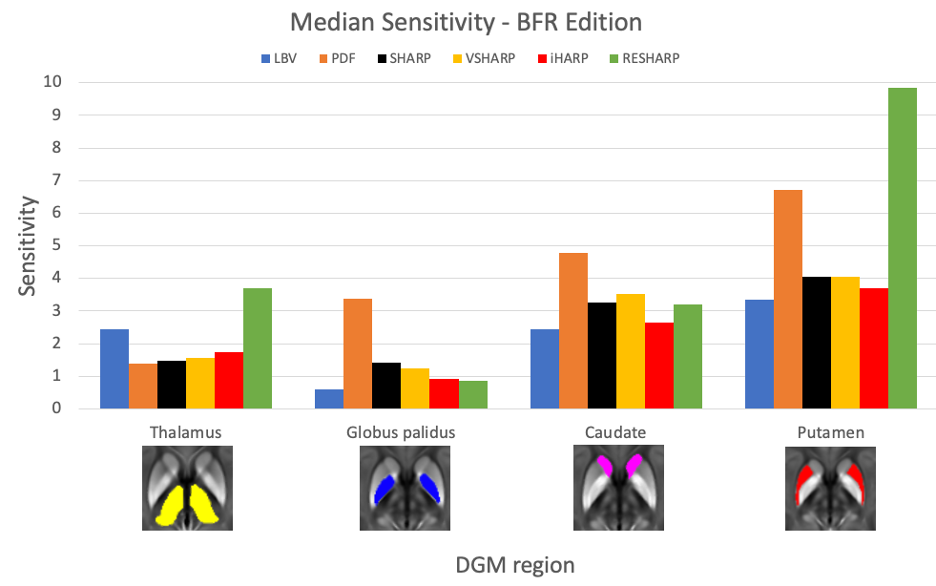
Statistical analysis: For each algorithm combination (“pipeline”), we calculated a previously introduced sensitivity metric8: over-time change / reproducibility. Furthermore, to assess the impact of BFRs on regional sensitivity, we computed for each BFR and DGM region the median sensitivity across all inversion algorithms.
Results
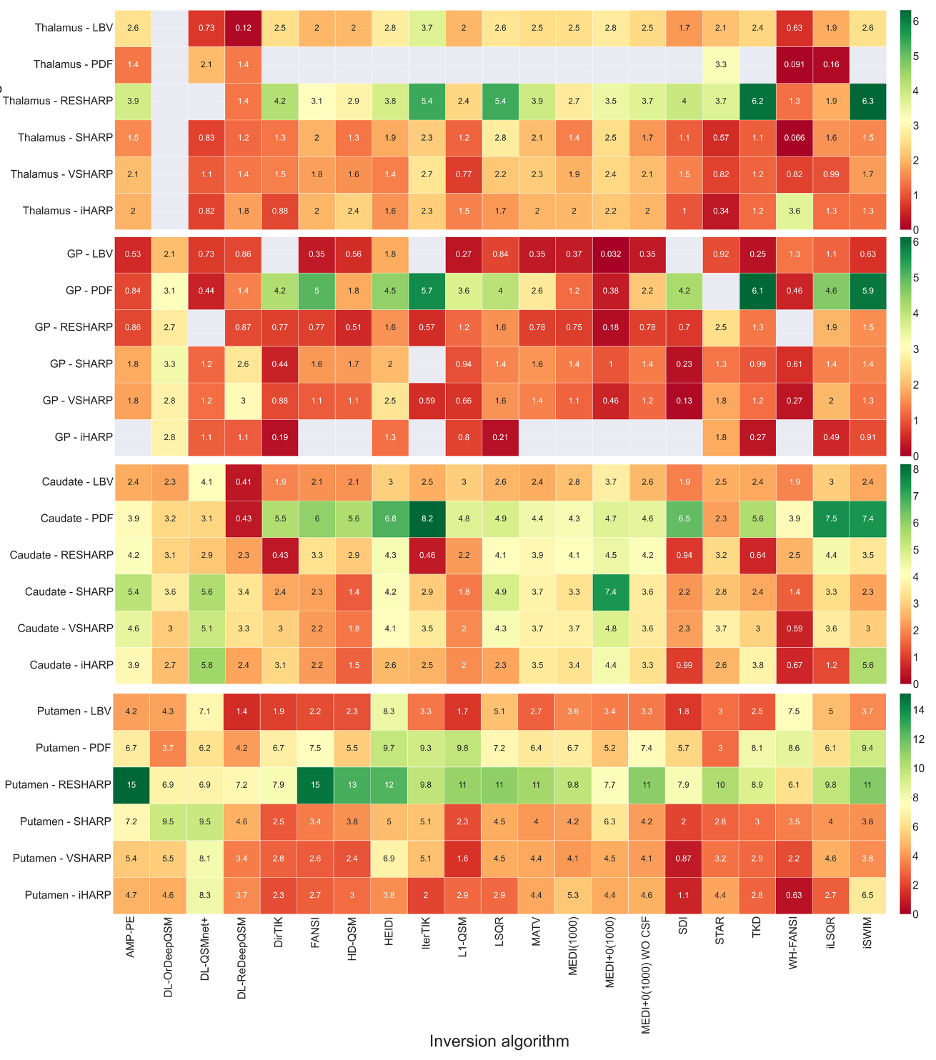
Regional Pipeline Sensitivity (PS) (Fig. 1): Most pipelines detected H&S-consistent over-time changes (non-gray boxes in heat maps). However, only iLSQR and the improved-DeepQSM were H&S-consistent regardless of the BFR choice.Sensitivity varied across regions, reflective of differences in iron accumulation rate: lowest in GP (≤6.1, expected H&S iron change: 0.10 mg/100g tissue wet-weight), thalamus (≤6.3, -0.35 mg/100g), followed by caudate (≤8.2, 0.24 mg/100g) and putamen (≤15, 0.51 mg/100g). PDF performed best for caudate and GP but didn't align with H&S-predicted thalamic changes. RESHARP excelled in putamen and thalamus but yielded moderate results in caudate and GP.
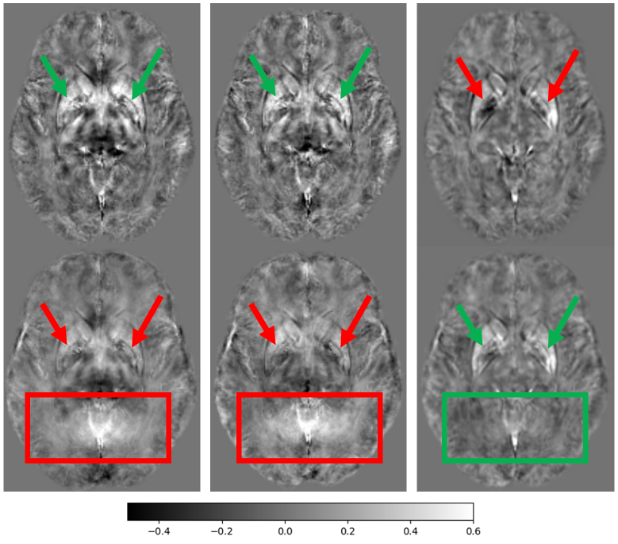
Figure 3 visualizes systematic reconstruction artifacts contributing to group-average over-time changes (red-boxes).
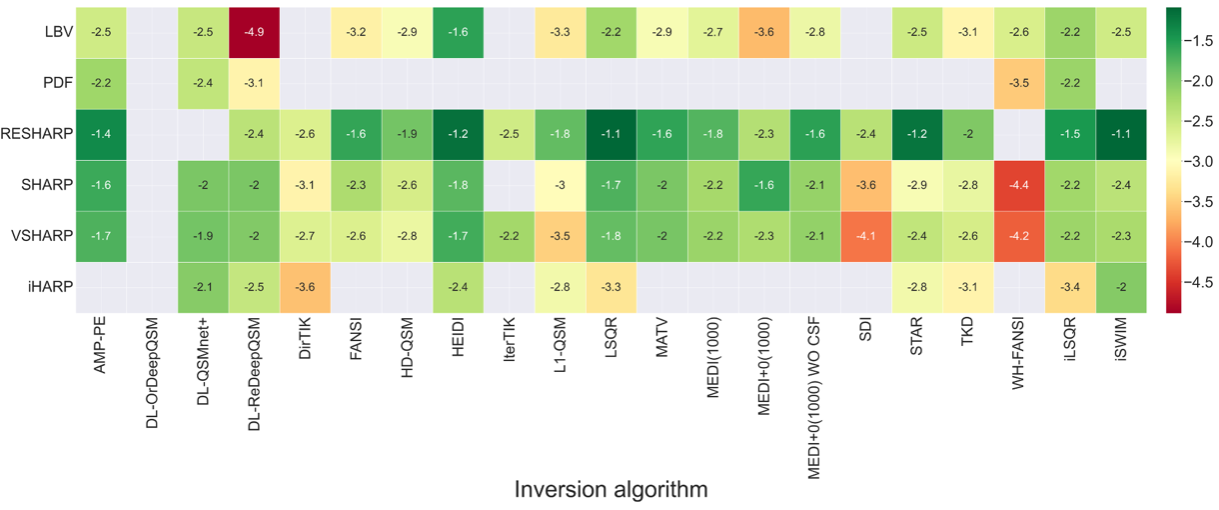
Overall PS (Fig. 2): Most inversion algorithms, except for DeepQSM, QSMnet+, WH-FANSI, and IterTK, exhibited high sensitivity and H&S-consistent over-time changes with SHARP-based BFRs (RESHARP, SHARP, VSHARP).
Effect of BFR choice (Fig.4): PDF demonstrated overall highest sensitivity in caudate and GP, whereas RESHARP in thalamus and putamen.
Cause of differences in sensitivity: Differences in sensitivity in GP, caudate, and thalamus were driven by differences in reproducibility, whereas both differences in reproducibility and over-time changes were seen in putamen (e.g., Fig. 3).
Discussion
This study is the first comprehensive analysis of the impact of both BFR and inversion algorithm choice on the detection real-world group-level susceptibility differences.BFR artifacts appeared as likely drivers of reduced sensitivity and H&S-inconsistent over-time changes in some algorithm configurations (Fig. 3). Increased robustness of SHARP-based BFRs may be related to the intrinsic low-pass filtering capability. Residual transceiver-phase contributions in our data may have amplified these effects.4 The potential for biased study outcomes due to observed discrepancies in over-time changes with some algorithm configurations (Fig. 3) is alarming and will require further investigation.
Conclusion
Region-dependent sensitivity may justify using different pipelines, depending on the region of interest. We suggest RESHARP+iSWIM as a general one-fits-all pipeline, RESHARP+AMP-PE for studies focusing on putamen, PDF+IterTIK for caudate, PDF+TKD for GP, and RESHARP+iSWIM for thalamus.Acknowledgements
We are grateful to Dr. Carlos Milovic (Pontificia Universidad Católica de Valparaíso) for his advice on the implementation and parameter optimization of FANSI and WH-FANSI and Pascal Spincemaille (Cornell-Weill Medical College) for his valuable advice on the PDF implementation for single-echo data. Research reported in this publication was supported by the National Institute of Neurological Disorders And Stroke of the National Institutes of Health under Award Number R01NS114227 and the National Center for Advancing Translational Sciences of the National Institutes of Health under Award Number UL1TR001412. The content is solely the responsibility of the authors and does not necessarily represent the official views of the National Institutes of Health. The German Federal Ministry of Education and Research (BMBF) grant AVATAR (16KISA024, funded by the European Union - NextGenerationEU), the German Academic Exchange Service (DAAD PPP 57599925), and an ISMRM Research Exchange Grant awarded to T.J.References
[1] Eskreis-Winkler, S. et al. The clinical utility of QSM: disease diagnosis, medical management, and surgical planning. NMR Biomed. 30, e3668 (2017).
[2] Wang, Y. et al. Clinical quantitative susceptibility mapping (QSM): Biometal imaging and its emerging roles in patient care. J. Magn. Reson. Imaging 46, 951–971 (2017).
[3] Ravanfar, P. et al. Systematic Review: Quantitative Susceptibility Mapping (QSM) of Brain Iron Profile in Neurodegenerative Diseases. Front. Neurosci. 15, 618435 (2021).
[4] QSM Consensus Organization Committee; Bilgic B, Costagli M, Chan KS, Duyn J, Langkammer C, Lee J, Li X, Liu C, Marques JP, Milovic C, Robinson S, Schweser F, Shmueli K, Spincemaille P, Straub S, van Zijl P, Wang Y; ISMRM Electro-Magnetic Tissue Properties Study Group. Recommended Implementation of Quantitative Susceptibility Mapping for Clinical Research in The Brain: A Consensus of the ISMRM Electro-Magnetic Tissue Properties Study Group. ArXiv [Preprint]. 2023 Jul 5:arXiv:2307.02306v1. PMID: 37461418; PMCID: PMC10350101.
[5] Schweser F, Robinson SD, de Rochefort L, Li W, Bredies K. An illustrated comparison of processing methods for phase MRI and QSM: removal of background field contributions from sources outside the region of interest. NMR Biomed. 2017 Apr;30(4):10.1002/nbm.3604. doi: 10.1002/nbm.3604. Epub 2016 Oct 7. PMID: 27717080; PMCID: PMC5587182.
[6] Langkammer C, Schweser F, Shmueli K, Kames C, Li X, Guo L, Milovic C, Kim J, Wei H, Bredies K, Buch S, Guo Y, Liu Z, Meineke J, Rauscher A, Marques JP, Bilgic B. Quantitative susceptibility mapping: Report from the 2016 reconstruction challenge. Magn Reson Med. 2018;79:1661–1673. doi: 10.1002/mrm.26830
[7] QSM Challenge 2.0 Organization Committee; Bilgic B, Langkammer C, Marques JP, Meineke J, Milovic C, Schweser F. QSM reconstruction challenge 2.0: Design and report of results. Magn Reson Med. 2021 Sep;86(3):1241-1255. doi: 10.1002/mrm.28754. Epub 2021 Mar 30. PMID: 33783037.
[8] Salman, F. Ramesh, A., Jochmann, T., Prayer, M., Bergsland, N., Dwyer, M. G., Jakimovski, D., Zivadinov, R., Schweser, F. Systematic assessment of published QSM inversion algorithms for detecting longitudinal changes in brain susceptibility. ISMRM 2023.
[9] HALLGREN B, SOURANDER P. The effect of age on the non-haemin iron in the human brain. J Neurochem. 1958 Oct;3(1):41-51. doi: 10.1111/j.1471-4159.1958.tb12607.x. PMID: 13611557.
[10] Salman, F. Ramesh, A., Prayer, M., Adegbemigun, A., Jochmann, T., Bergsland, N., Dwyer, M. G., Jakimovski, D., Zivadinov, R., Schweser, F. Decoding Deep Gray Matter Susceptibility: Variance from the reference region, not dipole inversion artifacts, dominates reproducibility. ISMRM 2024.
[11] Hussein S. Abdul-Rahman, Munther A. Gdeisat, David R. Burton, Michael J. Lalor, Francis Lilley, and Christopher J. Moore, "Fast and robust three-dimensional best path phase unwrapping algorithm," Appl. Opt. 46, 6623-6635 (2007)
[12] Sun H, Wilman AH. Background field removal using spherical mean value filtering and Tikhonov regularization. Magn Reson Med. 2014 Mar;71(3):1151-7. doi: 10.1002/mrm.24765. PMID: 23666788.
[13] Zhou D, Liu T, Spincemaille P, Wang Y. Background field removal by solving the Laplacian boundary value problem. NMR Biomed. 2014 Mar;27(3):312-9. doi: 10.1002/nbm.3064. Epub 2014 Jan 7. PMID: 24395595.
[14] Liu T, Khalidov I, de Rochefort L, Spincemaille P, Liu J, Tsiouris AJ, Wang Y. A novel background field removal method for MRI using projection onto dipole fields (PDF). NMR Biomed. 2011 Nov;24(9):1129-36. doi: 10.1002/nbm.1670. Epub 2011 Mar 8. PMID: 21387445; PMCID: PMC3628923.
[15] Schweser F, Deistung A, Lehr BW, Reichenbach JR. Quantitative imaging of intrinsic magnetic tissue properties using MRI signal phase: an approach to in vivo brain iron metabolism? Neuroimage. 2011 Feb 14;54(4):2789-807. doi: 10.1016/j.neuroimage.2010.10.070. Epub 2010 Oct 30. PMID: 21040794.
[16] Li W, Wu B, Liu C. Quantitative susceptibility mapping of human brain reflects spatial variation in tissue composition. NeuroImage. 2011;55(4):1645–1656.
[17] Li W, Avram AV, Wu B, Xiao X, Liu C. Integrated Laplacian-based phase unwrapping and background phase removal for quantitative susceptibility mapping. NMR Biomed. 2014 Feb;27(2):219-27. doi: 10.1002/nbm.3056. Epub 2013 Dec 11. PMID: 24357120; PMCID: PMC3947438.
[18] Huang, S., Lah, J, J., Allen, J, W., Qiu, D. Robust Quantitative Susceptibility Mapping via Approximate Message Passing with Parameter Estimation. arXiv preprint. arXiv:2207.14709, 2022. https://arxiv.org/abs/2207.14709.
[19] Bollmann S, Rasmussen KGB, Kristensen M, Blendal RG, Østergaard LR, Plocharski M, O'Brien K, Langkammer C, Janke A, Barth M. DeepQSM - using deep learning to solve the dipole inversion for quantitative susceptibility mapping. Neuroimage. 2019 Jul 15;195:373-383. doi: 10.1016/j.neuroimage.2019.03.060. Epub 2019 Mar 29. PMID: 30935908.
[20] Karsa, A et al. (2019). High Repeatability of Quantitative Susceptibility Mapping (QSM) in the Head and Neck With a View to Detecting Hypoxic Cancer Sites, In Proceedings of the 27th Annual Meeting of the ISMRM, Montreal, p. 4939
[21] Milovic, C., Bilgic, B., Zhao, B., Acosta-Cabronero, J., Tejos, C., 2018. Fast nonlinear susceptibility inversion with variational regularization. Magnetic resonance in medicine 80, 814–821.
[22] Lambert M, Tejos C, Langkammer C, Milovic C. Hybrid data fidelity term approach for quantitative susceptibility mapping. Magn Reson Med. 2022 Aug;88(2):962-972. doi: 10.1002/mrm.29218. Epub 2022 Apr 18. PMID: 35435267; PMCID: PMC9324845.
[23] Schweser F, Sommer K, Deistung A, Reichenbach JR. Quantitative susceptibility mapping for investigating subtle susceptibility variations in the human brain. Neuroimage. 2012 Sep;62(3):2083-100. doi: 10.1016/j.neuroimage.2012.05.067. Epub 2012 Jun 1. PMID: 22659482.
[24] Li, W., Wu, B., Liu, C., 2011. Quantitative susceptibility mapping of human brain reflects spatial variation in tissue composition. Neuroimage 55, 1645–1656.
[25] Tang J, Liu S, Neelavalli J, Cheng YC, Buch S, Haacke EM. Improving susceptibility mapping using a threshold-based K-space/image domain iterative reconstruction approach. Magn Reson Med. 2013 May;69(5):1396-407. doi: 10.1002/mrm.24384. Epub 2012 Jun 26. PMID: 22736331; PMCID: PMC3482302.
[26] Milovic C, Lambert M, Langkammer C, Bredies K, Irarrazaval P, Tejos C. Streaking artifact suppression of quantitative susceptibility mapping reconstructions via L1-norm data fidelity optimization (L1-QSM). Magn Reson Med. 2022 Jan;87(1):457-473. doi: 10.1002/mrm.28957. Epub 2021 Aug 4. PMID: 34350634.
[27] Guo L, Mei Y, Guan J, Tan X, Xu Y, Chen W, Feng Q, Feng Y. Morphology-adaptive total variation for the reconstruction of quantitative susceptibility map from the magnetic resonance imaging phase. PLoS One. 2018 May 8;13(5):e0196922. doi: 10.1371/journal.pone.0196922. PMID: 29738526; PMCID: PMC5940224.
[28] LLiu, J., Liu, T., Rochefort, L. de, Ledoux, J., Khalidov, I., Chen, W., Tsiouris, A.J., Wisnieff, C., Spincemaille, P., Prince, M.R., Wang, Y., 2012. Morphology enabled dipole inversion for quantitative susceptibility mapping using structural consistency between the magnitude image and the susceptibility map. Neuroimage 59, 2560–2568.
[29] Liu, Z., Spincemaille, P., Yao, Y., Zhang, Y., Wang, Y., 2018. MEDI+0: Morphology enabled dipole inversion with automatic uniform cerebrospinal fluid zero reference for quantitative susceptibility mapping. Magnetic resonance in medicine 79, 2795–2803.
[30] Jung, W., Yoon, J., Ji, S., Choi, J, S., Kim, J, M., Nam, Y., Kim, E, Y., Lee, J. Exploring linearity of deep neural network trained QSM: QSMnet+. NeuroImage, Volume 211, 2020. 116619. ISSN 1053-8119, https://doi.org/10.1016/j.neuroimage.2020.116619.
[31] Schweser, F et al. (2013). Toward online reconstruction of quantitative susceptibility maps: superfast dipole inversion, Magnetic Resonance in Medicine vol 69 issue 6, 1581-1593.
[32] Wei, H., Dibb, R., Zhou, Y., Sun, Y., Xu, J., Wang, N., Liu, C., 2015. Streaking artifact reduction for quantitative susceptibility mapping of sources with large dynamic range. NMR in biomedicine 28, 1294–1303.
[33] Wharton, S., Schäfer, A., Bowtell, R., 2010. Susceptibility mapping in the human brain using threshold-based k-space division. Magnetic resonance in medicine 63, 1292–1304.
[34] Milovic, C., Bilgic, B., Zhao, B., Langkammer, C., Tejos, C., Cabronero, J.A., 2019. Weak-harmonic regularization for quantitative susceptibility mapping. Magnetic resonance in medicine 81, 1399–1411.
[35] Jochmann, T., Jakimovski, D., Küchler, N., Zivadinov, R., Haueisen, J., Schweser, F.Quantitative mapping of susceptibility and non-susceptibility frequency with DEEPOLE QUASAR. ISMRM 2021.
[36] Milovic, C., Fuchs, P., Arsenov, O., Kiersnowski, O, C., Murdoch, R., Muralidharan, L., Nassar, J., and Shmueli, K. Exhaustive Comparison of QSM Background Field Removal and Masking using a Realistic Numerical Head Phantom. ISMRM 2023 (4178).
[37] Dvorak, A.V., Swift-LaPointe, T., Vavasour, I.M. et al. An atlas for human brain myelin content throughout the adult life span. Sci Rep 11, 269 (2021). https://doi.org/10.1038/s41598-020-79540-3.
[38] QSM reconstruction pipeline using the following: https://gitlab.com/R01NS114227/pi4s
Figures