3817
T1 and T2 Mapping for Identifying Malignant Lymph Nodes in Head and Neck Squamous Cell Carcinoma1Radiology Department, Peking Union Medical College Hospital, Beijing, China, 2MR Research Collaboration, Siemens Healthineers Ltd., Beijing, China
Synopsis
Keywords: Quantitative Imaging, Quantitative Imaging
Motivation: Find a novel Quantitative parameters of imaging to differentiate between metastatic lymph nodes and reactive lymph node hyperplasia in HNSCC.
Goal(s): This study seeks to assess the ability of T1 and T2 mapping to differentiate between metastatic lymph nodes and reactive lymph node hyperplasia in HNSCC.
Approach: Quantitative measurements derived from preoperative T1 and T2 mapping and DWI of metastatic and non-metastatic lymph nodes were compared using independent samples t-test or Mann–Whitney U test.
Results: Metastatic lymph nodes exhibited significantly lower mean T2 values, higher apparent diffusion coefficient (ADC) and higher standard deviation of T1 values (T1SD) (p < 0.001).
Impact: Our findings indicate that malignant cervical lymph nodes exhibit significantly lower T2 values and higher T1SD and ADC values compared to benign lymph nodes in HNSCC. This finding has important implications for achieving preoperative high-accuracy nodal staging in HNSCC.
Introduction
Cervical lymph node metastasis in head and neck squamous cell carcinoma (HNSCC) is a crucial prognostic factor, significantly reducing disease-free survival and worsening overall prognosis, and it necessitates more aggressive treatment and follow-up. Although DWI is an essential functional imaging modality widely used to distinguish between benign and malignant lesions, it has been controversial in differentiating lymph node status in HNSCC. T1 and T2 mapping techniques have been successfully applied in various types of cancer, including the differential diagnosis of benign and malignant lesions [1, 2] and the prediction of pathologic features of cancer [3, 4]. The main objective of this study was to investigate the clinical applicability of T1 and T2 mapping compared to DWI for distinguishing between benign and metastatic cervical lymph nodes, aiming to achieve more accurate nodal staging in HNSCC.Methods:
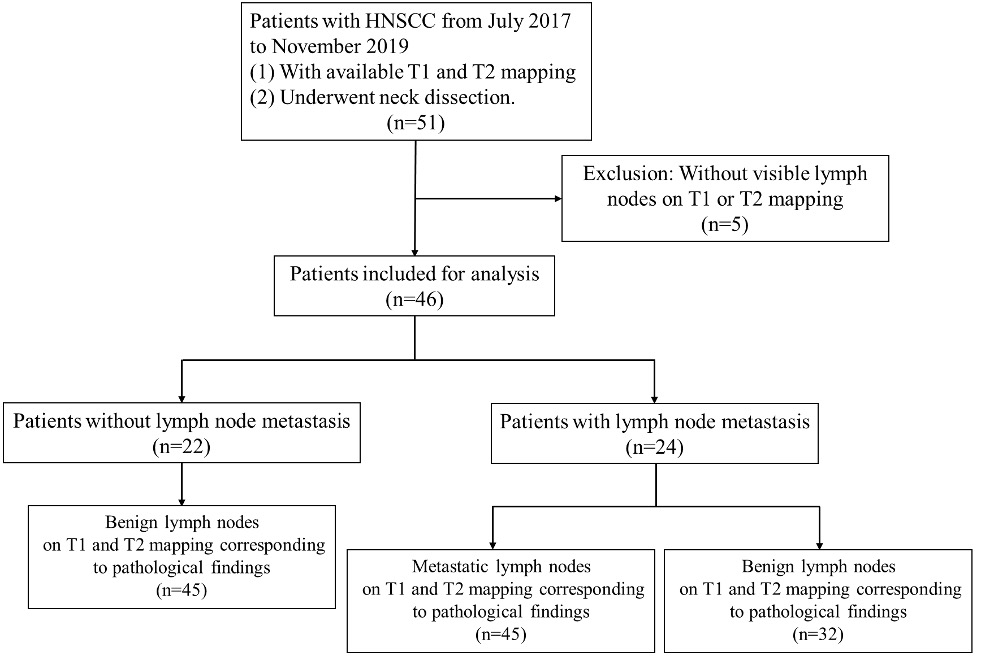
Between July 2017 and November 2019, 46 HNSCC patients underwent neck MRI inclusive of T1 and T2 mapping and DWI.(Fig. 1) Patients with suspected cervical lymph node metastasis underwent elective neck dissection along with surgical removal of primary cancer based on pre-surgery imaging or clinicopathological high-risk factors. The localization of metastatic lymph nodes on MRI was first determined by each neck level and then matched by the largest diameter of metastatic lymph nodes measured on the contrast-enhanced T1-weighted StarVIBE sequence and on pathologic slices.All the examinations were performed on a clinical 3-Tesla scanner (MAGNETOM Skyra, Siemens Healthcare, Erlangen, Germany) with a 20-channel head-neck coil. T1 mapping was derived from Magnetization Prepared 2 Rapid Acquisition Gradient Echoes (MP2RAGE) sequence with inversion times of 700 ms and 2500 ms, and flip angles of 4° and 5°. T2 mapping was obtained using a research multi-echo spin echo (MSE) sequence with GRAPPATINI acceleration technique.Quantitative measurements derived from preoperative T1 and T2 mapping and DWI of metastatic and non-metastatic lymph nodes were compared using independent samples t-test or Mann–Whitney U test. Receiver operating characteristic curves and the DeLong test were employed to determine the most effective diagnostic methodology.
Results:
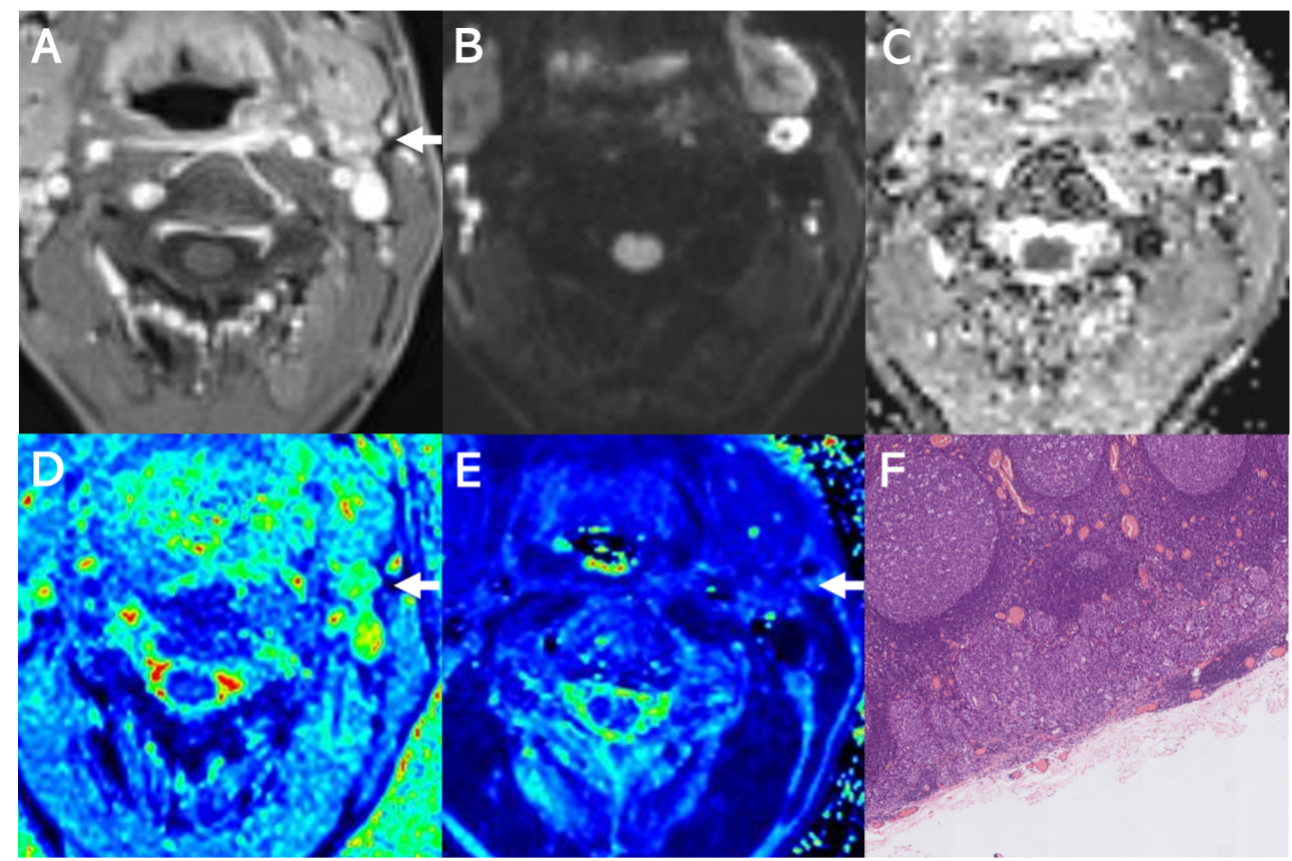
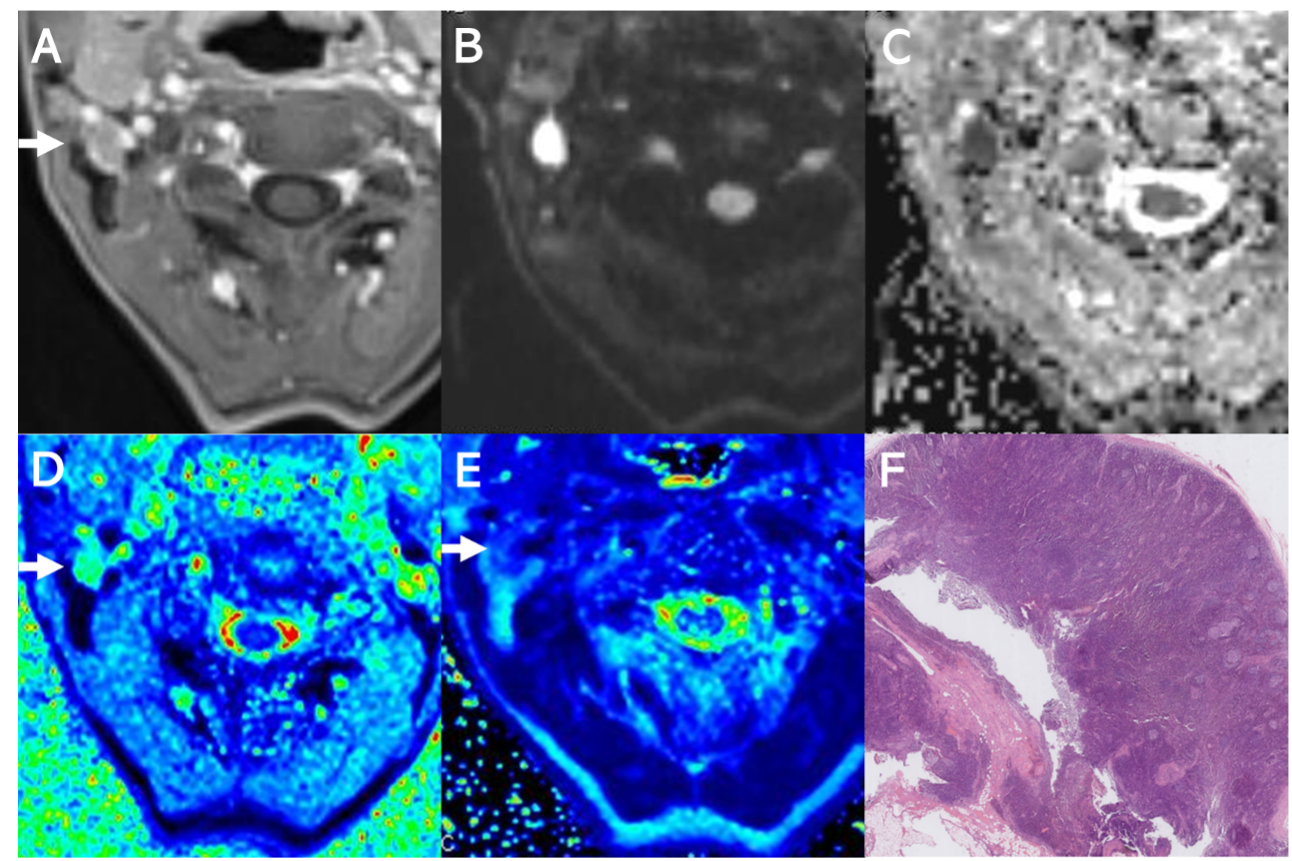
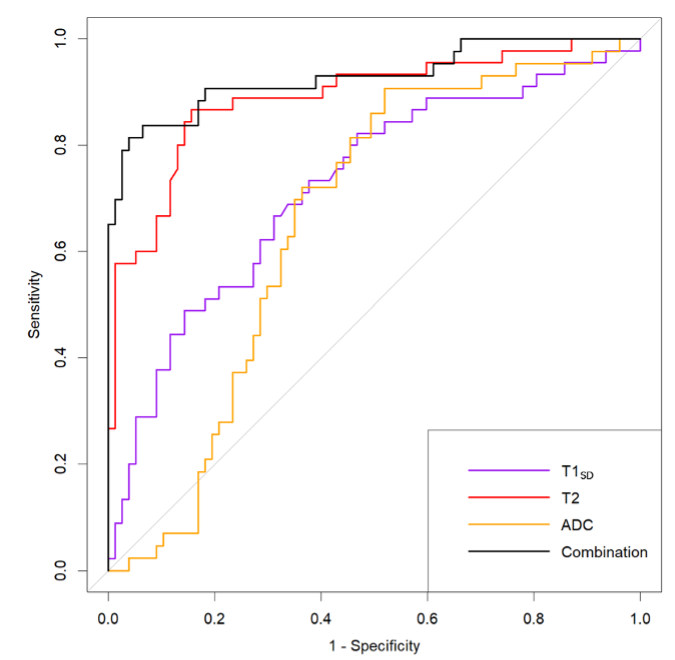
We examined a total of 122 lymph nodes, 45 (36.9%) of which were metastatic proven by pathology. Mean T2 values for metastatic lymph nodes were significantly lower than those for benign lymph nodes (p < 0.001). Conversely, metastatic lymph nodes exhibited significantly higher apparent diffusion coefficient (ADC) and standard deviation of T1 values (T1SD) (p < 0.001). (Fig.2, 3)T2 generated a significantly higher area under the curve (AUC) of 0.890 (0.826-0.954) compared to T1SD (0.711 [0.613-0.809]) and ADC (0.660 [0.562-0.758]) (p = 0.007 and p < 0.001). Combining T2, T1SD, ADC, and lymph node size achieved an AUC of 0.929 (0.875-0.983), which did not significantly enhance diagnostic performance over using T2 alone (p = 0.089).(Fig.4)
Discussion:
Our study revealed that metastatic lymph nodes exhibit significantly shorter T2 than benign ones. Notably, metastatic lymph nodes without necrosis have even significantly shorter T2 than metastatic lymph nodes with necrosis. The pathophysiology underpinning the diminished T2 value is thought to reflect the reduction in tumor water content and a lower T2 is also associated with an increase in tumor cellularity and necrosis. [5-7]. Experimental tumor models have substantiated that T2 value is a more sensitive measure of tumor water content than ADC.The results of our study showed that T2 significantly surpassed ADC in diagnostic performance, suggesting its feasibility in discerning between benign and malignant lymph nodes. Therefore, T2 mapping may serve as a non-invasive technique for nodal staging in HNSCC.At the pathological level, the T1 of experimental tumors has positively correlated with increased tumor water content and cellular proliferation and is negatively correlated with tumor necrosis. [6,7]. The significantly higher T1SD for metastatic lymph nodes suggests a more complex heterogeneity inside the metastatic lymph nodes and calls for further exploration of radiomic features on T1 mapping, as mapping methodologies can offer precision on a voxel-by-voxel basis. Despite T1 and T2 mapping, along with DWI, appearing to denote different facets of intrinsic tumor microstructure, the composite use of T1SD or T2 values with ADC did not significantly enhance the diagnostic performance.Conclusion:
Our findings indicate that malignant cervical lymph nodes exhibit significantly lower T2 values and higher T1SD and ADC values compared to benign lymph nodes in HNSCC. T2 mapping has the potential to serve as an in vivo biomarker for distinguishing between metastatic and non-metastatic lymph nodes. This finding has important implications for achieving preoperative high-accuracy nodal staging in HNSCC.Acknowledgements
This work was supported by National Natural Science Foundation of China (82371962); National High Level Hospital Clinical Research Funding (grant number 2022-PUMCH-B-67); 2021SKY Beijing Imaging Research Fund of China International Medical Foundation (Z-2014-07-2101).References
1. Mai J, Abubrig M, Lehmann T, Hilbert T, Weiland E, Grimm MO, et al. T2 Mapping in Prostate Cancer. Invest Radiol. 2019;54(3):146-52.
2. Wang F, Yang Q, Zhang Y, Liu J, Liu M, Zhu J. 3D variable flip angle T1 mapping for differentiating benign and malignant liver lesions at 3T: comparison with diffusion weighted imaging. BMC Med Imaging. 2022;22(1):146.
3. Adams LC, Ralla B, Jurmeister P, Bressem KK, Fahlenkamp UL, Hamm B, et al. Native T1 Mapping as an In Vivo Biomarker for the Identification of Higher-Grade Renal Cell Carcinoma: Correlation With Histopathological Findings. Invest Radiol. 2019;54(2):118-28.
4. Li J, Gao X, Dominik Nickel M, Cheng J, Zhu J. Native T1 mapping for differentiating the histopathologic type, grade, and stage of rectal adenocarcinoma: a pilot study. Cancer Imaging. 2022;22(1):30.
5. Fernández-Jiménez R, Sánchez-González J, Aguero J, Del Trigo M, Galán-Arriola C, Fuster V, et al. Fast T2 gradient-spin-echo (T2-GraSE) mapping for myocardial edema quantification: first in vivo validation in a porcine model of ischemia/reperfusion. J Cardiovasc Magn Reson. 2015;17:92.
6. Jakobsen I, Kaalhus O, Lyng H, Rofstad EK. Detection of necrosis in human tumour xenografts by proton magnetic resonance imaging. Br J Cancer. 1995;71(3):456-61.
7. Rofstad EK, Steinsland E, Kaalhus O, Chang YB, Høvik B, Lyng H. Magnetic resonance imaging of human melanoma xenografts in vivo: proton spin-lattice and spin-spin relaxation times versus fractional tumour water content and fraction of necrotic tumour tissue. Int J Radiat Biol. 1994;65(3):387-401.
Figures