3810
Automated image prescription for liver MRE using an AI method trained without manual labeling1Department of Radiology, University of Wisconsin-Madison, Madison, Wisconsin, USA, University of Wisconsin-Madison, Madison, WI, United States, 2Department of Medical Physics, University of Wisconsin-Madison, Madison, Wisconsin, USA, University of Wisconsin-Madison, Madison, WI, United States, 3GE HealthCare, Waukesha, WI, United States, 4Department of Biomedical Engineering, University of Wisconsin-Madison, Madison, Wisconsin, USA, University of Wisconsin-Madison, Madison, WI, United States, 5Department of Medicine, University of Wisconsin-Madison, Madison, Wisconsin, USA, University of Wisconsin-Madison, Madison, WI, United States, 6Department of Emergency Medicine, University of Wisconsin-Madison, Madison, Wisconsin, USA, University of Wisconsin-Madison, Madison, WI, United States, 7Department of Electrical and Computer Engineering, University of Wisconsin-Madison, Madison, Wisconsin, USA, University of Wisconsin-Madison, Madison, WI, United States
Synopsis
Keywords: Other AI/ML, Machine Learning/Artificial Intelligence
Motivation: MRE is a reliable, quantitative method for the assessment and staging of liver fibrosis. The standard manual MRE image prescription requires proper placement over the liver to ensure consistent MRE quantification. Scan positioning is relatively time-consuming and prone to error and inconsistency.
Goal(s): To develop and implement an automated methodology for MRE prescription from localizers, trained entirely from technologist-prescribed clinical exams.
Approach: Extracted MRE scan coordinates from 354 clinical exams and trained a YOLOv8-nano object detection network to predict prescription planes from a multi-plane localizer series.
Results: We successfully developed a method for automated MRE prescription with implementation on a clinical MRI system.
Impact: Automatic image plan prescription for MRE can minimize technologist-dependent planning errors and scan inconsistency. This may lead to subsequent improvements in both the value and reproducibility of MRE as a quantitative biomarker of liver fibrosis.
Introduction
Magnetic resonance elastography (MRE) is a procedure that visualizes the propagation of shear waves during MR image acquisition to estimate quantitative maps of tissue stiffness1. Abdominal MRE is widely considered the noninvasive reference standard for the detection and staging of liver fibrosis2. MRE image plane prescription typically includes four axial image slices through the widest transverse dimension of the liver2. These are prescribed manually by technologists on multi-plane localizers or coronal T2-weighted single-shot fast spin-echo images. However, manual image prescription is time-consuming, and is prone to error and inconsistency3.Suboptimal positioning of the MRE scan volume can reduce the diagnostic quality of MRE due to suboptimal liver coverage or interference from the lungs inside the prescribed MRE volume2. Furthermore, variability in volume of manually-prescribed images could lead to increase variability impairing the ability of MRE to detect longitudinal changes during treatment.
Prior studies have proposed systems for automatic image prescription of the heart4 and liver5, but there is no existing method for automatic MRE image plane prescription. Therefore, this work aims to develop and validate a deep learning-based system for the automated prescription of MRE volumes on multi-plane localizers.
Methods
The local Picture Archiving and Communication System (PACS) was queried for clinical MRE exams performed between 2019 and 2022 with IRB approval.A board-certified radiologist reviewed and classified each technologist-prescribed MRE volume as adequate or inadequate based on the prescribed coverage. Exams with adequate prescriptions were prospectively split into training and evaluation datasets, with an 80%/20% train-test split used. Sex and field strength were used as stratification criteria.
The center coordinate and extents of the MRE prescription were extracted from the retrieved DICOM series and projected onto the corresponding multi-plane localizer images. Each 2D localizer image was normalized and labeled with its corresponding bounding box to define the MRE prescription. A YOLOv8-nano5 model was trained for 100 epochs on an NVIDIA Tesla V100 GPU to predict the MRE prescription coordinates from 2D localizer images. Augmentations including scaling, translation, contrast adjustment, and horizontal reflection were used for training.
For each series, a center point for the MRE prescription was generated by averaging the predicted prescription's center in each direction (AP/LR/SI) across every 2D localizer slice. This predicted volume center is combined with a scanner-dependent FOV (AP/LR) for the MRE acquisition and is used to acquire 4 slices (SI direction, thickness=10mm, slice gap=0mm) as illustrated in Figure 1. Model performance was evaluated using the error between the centers of the manually-prescribed and automatically-prescribed volumes.
The trained prescription model was implemented on a 3.0T clinical MRI system (Signa Premier, GE HealthCare, Waukesha, WI) and prospectively evaluated on healthy volunteers. Volunteers were scanned twice, being removed from the scanner between the two scans to evaluate consistency across timepoints. Each scan included a multi-plane localizer and automatically-prescribed MRE.
Results
Our search query returned 430 clinical MRE exams. Prescriptions with adequate coverage (n=354) were split into training (n=283, 80%) and evaluation (n=71, 20%) datasets, with sex and field strength as stratification criteria.Figure 2 shows three examples of the manually-prescribed and automatically-prescribed MRE volumes from the evaluation set with good agreement between volumes. Figure 3 shows the distribution of errors (mm) between manually-prescribed and automatically-prescribed MRE volumes.
The trained prescription model was successfully implemented on an MRI system at our site and prospectively evaluated on 4 healthy volunteers. Figure 4 shows the on-scanner MRE prescriptions generated for one of the volunteers across the two scans. The total on-scanner time to produce the 3D MRE prescription was approximately 3 seconds, compared to an average time of 41s required for manual prescription by trained technologists.
Discussion
We successfully developed a fully automated MRE prescription system to address the limitations of manual image prescription. The proposed MRE prescription model performed well on the evaluation dataset, showing strong agreement between manual and automatic prescriptions. The model’s performance may show further improvements by using a larger model, but a small size was selected to enable rapid execution on the system console's CPU. Further, this model was implemented on a GE 3.0T system and several volunteers were scanned, demonstrating its feasibility and promising prospective performance. Limitations of this work include that performance was evaluated compared to clinical prescriptions, which may not be considered ground truth. A larger prospective study is ongoing at our center.Acknowledgements
We acknowledge support from NIH grant R01EB031886. We wish to acknowledge support from GE Healthcare who provides research support to the University of Wisconsin. We wish to acknowledge support from the University of Wisconsin-Madison Office of the Vice Chancellor for Research and Graduate Education with funding from the Wisconsin Alumni Research Foundation, as well as from the UW Departments of Radiology and Medical Physics.
Dr. Reeder is the John H. Juhl Endowed Chair of Radiology.
This material is based upon work supported by the National Science Foundation Graduate Research Fellowship Program under Grant No. DGE-2137424. Any opinions, findings, and conclusions or recommendations expressed in this material are those of the author(s) and do not necessarily reflect the views of the National Science Foundation.
References
1. Venkatesh SK, Ehman RL. Magnetic resonance elastography of abdomen. Abdom Imaging. 2015; 40(4):745–759.
2. Guglielmo FF, Venkatesh SK, Mitchell DG. Liver MR Elastography Technique and Image Interpretation: Pearls and Pitfalls. RadioGraphics. 2019; 39(7):1983–2002.
3. Wagner M, Corcuera-Solano I, Lo G, et al. Technical Failure of MR Elastography Examinations of the Liver: Experience from a Large Single-Center Study. Radiology. 2017; 284(2):401–412.
4. Blansit K, Retson T, Masutani E, Bahrami N, Hsiao A. Deep Learning–based Prescription of Cardiac MRI Planes. Radiology: Artificial Intelligence. 2019; 1(6).
5. Geng R, Buelo CJ, Sundaresan M, et al. Automated MR Image Prescription of the Liver Using Deep Learning: Development, Evaluation, and Prospective Implementation. Magnetic Resonance Imaging. 2023; 58(2):429–441.
Figures
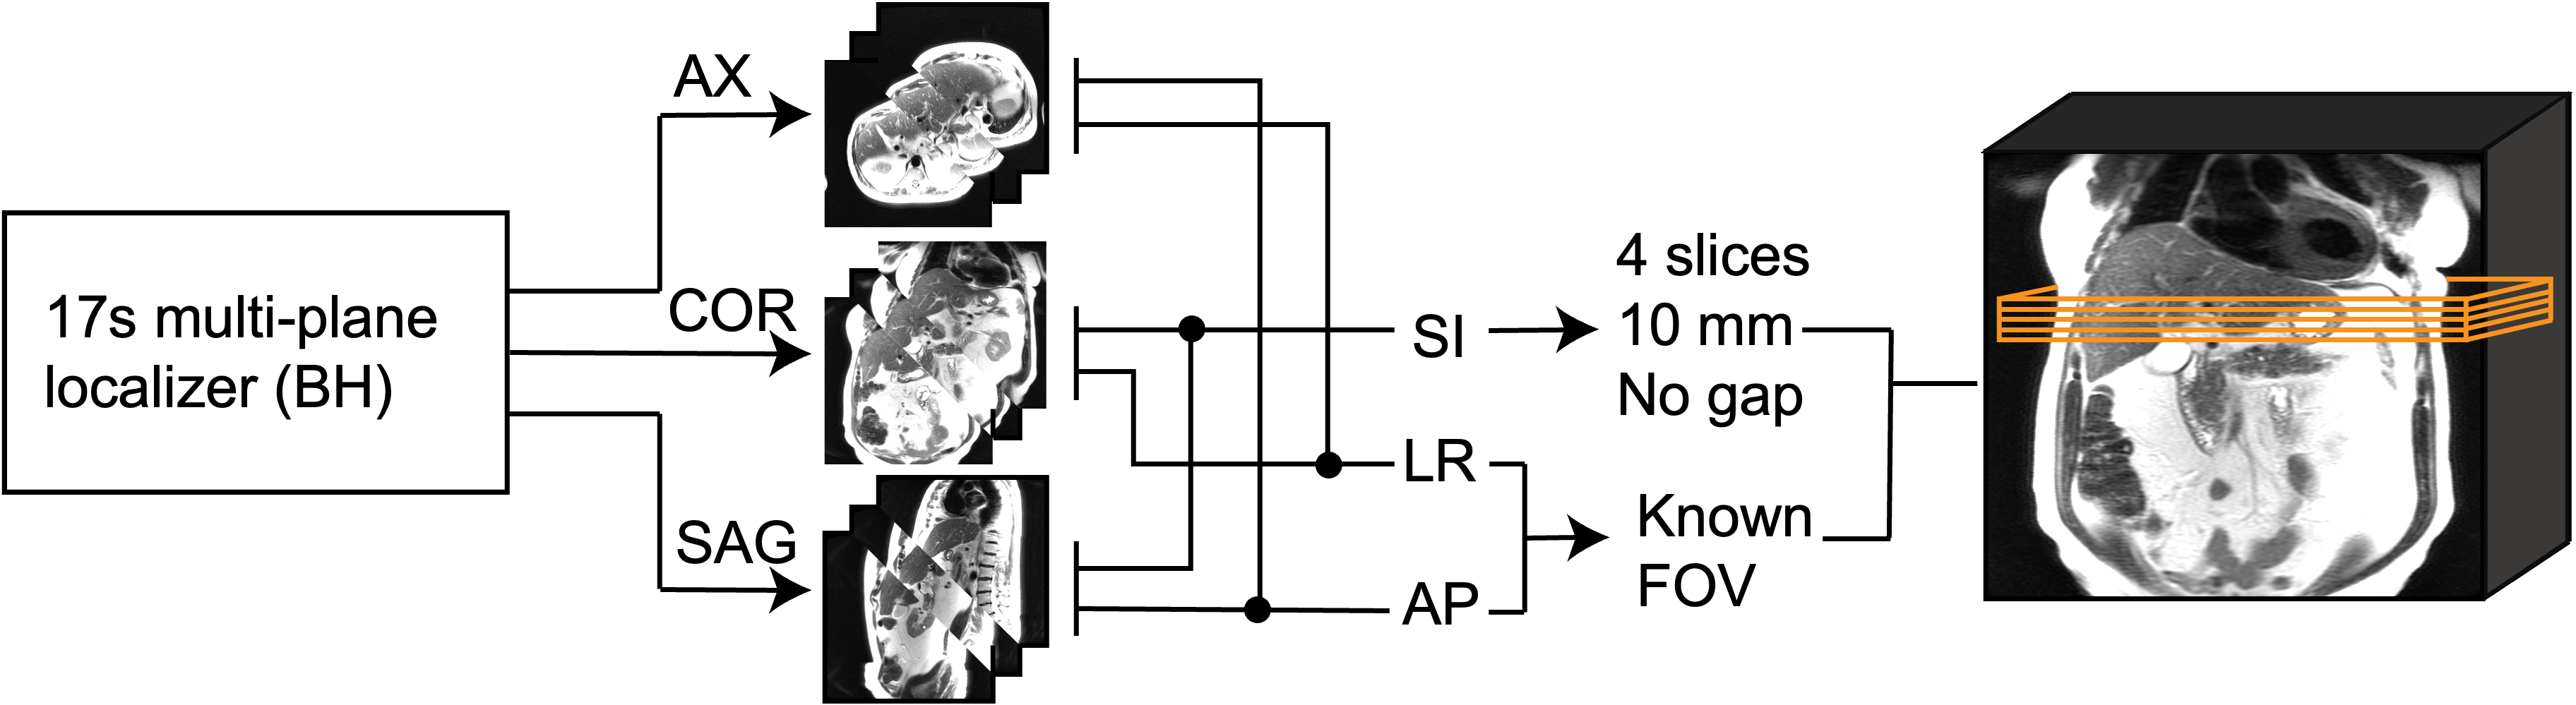
Figure 1. Process diagram illustrating the generation of an automatic MRE image prescription from a multi-plane localizer acquisition. A localizer series is acquired during end-expiration. The neural network is applied to each 2D localizer image to predict the MRE prescription center and FOV in the corresponding orientation. The coordinates are averaged to produce the fully-parameterized multi-slice MRE prescription. The MRE image prescription appears on the console, after which the technologist may begin data acquisition.
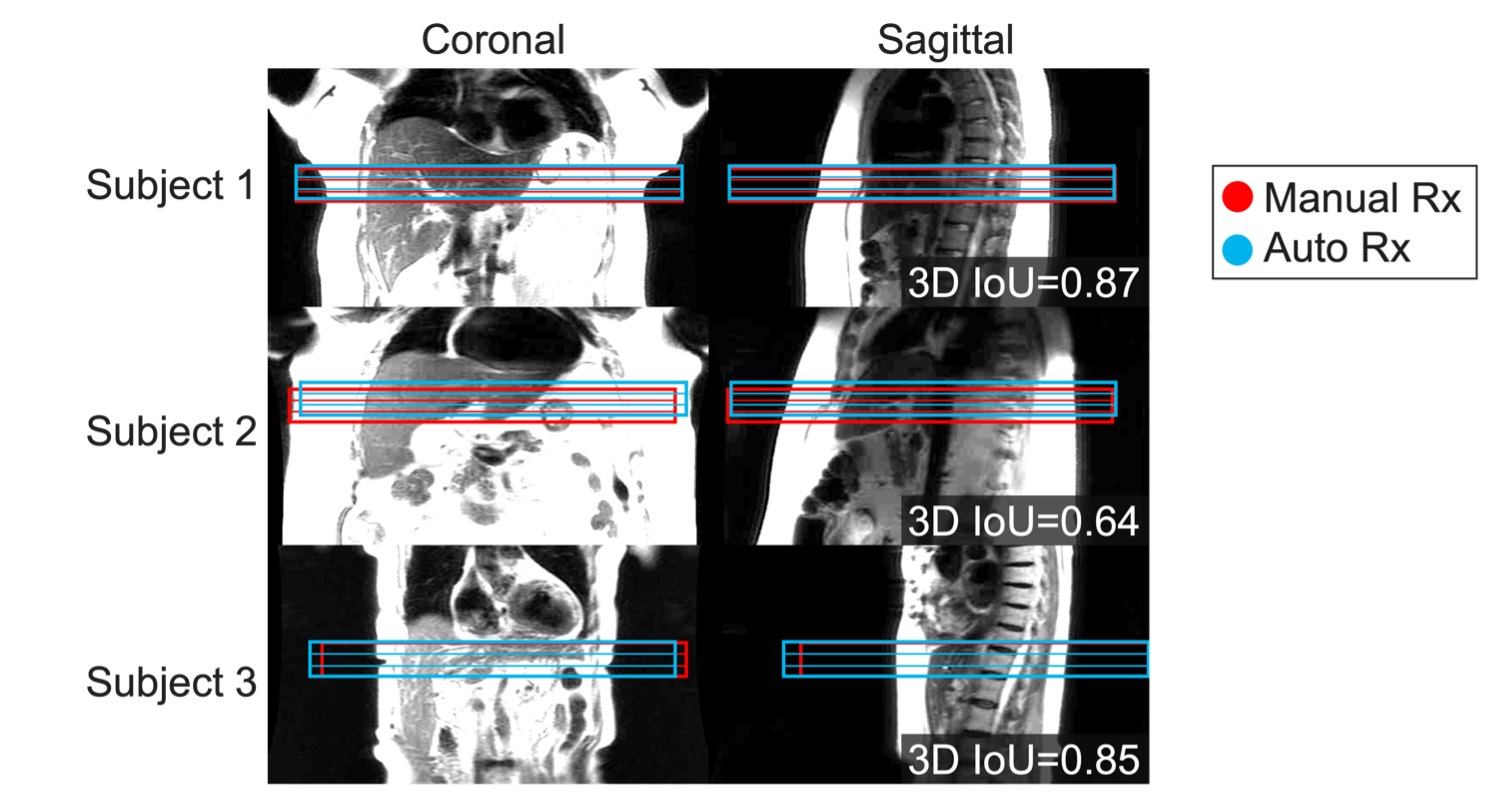
Figure 2. Automatically-prescribed MRE slices (blue) demonstrate good agreement with manually-prescribed volumes (red). Three representative cases from the evaluation set with good agreement between prescriptions and sufficient coverage of the widest transverse liver segment are shown. Each volume consists of 4 slices (thickness=10mm, slice gap=0mm). All automatically-placed MRE slices are well-centered in the AP and LR directions, with accurate positioning in the SI direction to cover sufficient liver tissue while avoiding the lungs and heart.
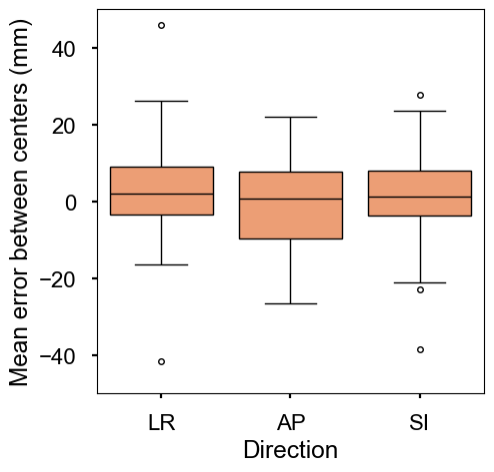
Figure 3. The automatically-generated image prescriptions in the evaluation dataset show good accuracy across all directions. A boxplot of the differences in position between the centers of each prescription in each direction is shown. The error between the centers of the automatic and manual prescriptions is tightly distributed around 0mm for all directions. The deviation shown is to be expected, as there is variability in the absolute accuracy of the prescriptions in the training and evaluation datasets.
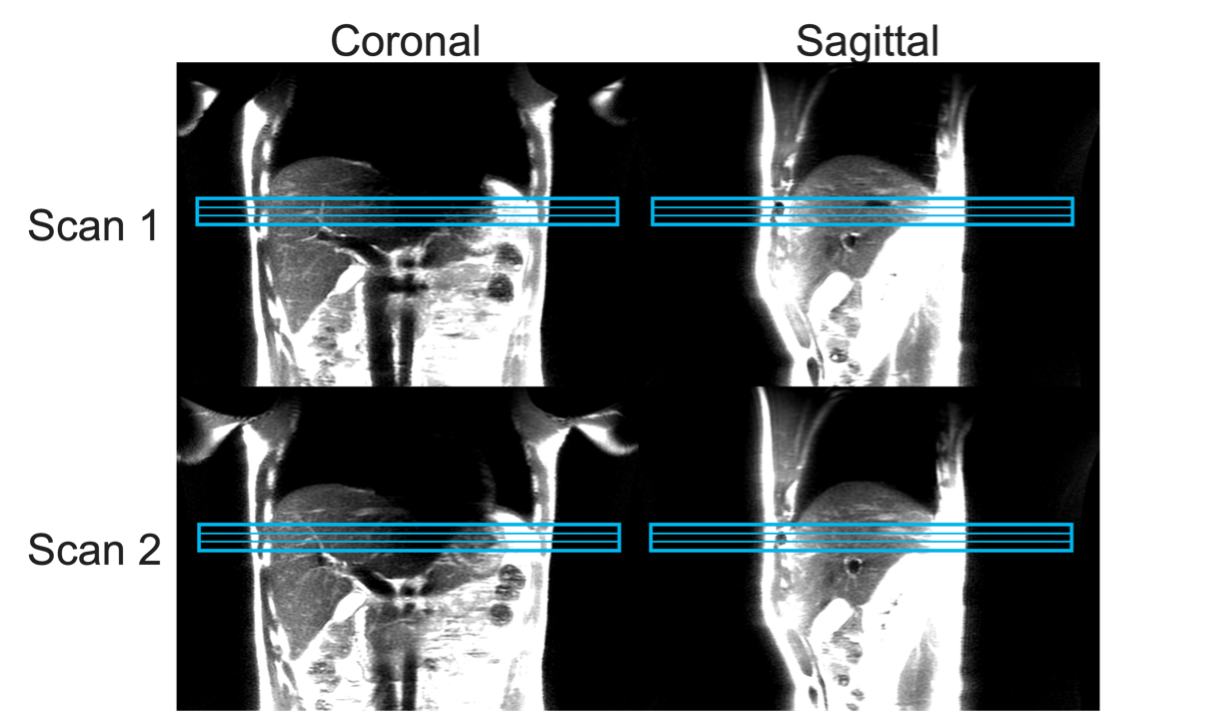
Figure 4. The proposed method for automatic MRE prescription (shown in blue) shows high precision between multiple acquisitions in the same healthy volunteer after removal and repositioning. Each multi-plane localizer series was acquired in a 17-second end-expiration breath hold. For each exam, the automatically-prescribed volume demonstrates sufficient coverage of the widest transverse liver segment.