3796
MRI Signal changes of meniscus in patients with knee osteoarthritis1School of Biomedical Engineering, Anhui Medical University, Hefei, China, 2The First Affiliated Hospital of Anhui Medical University, Anhui Public Health Clinical Center, Hefei, China
Synopsis
Keywords: Diagnosis/Prediction, Joints, meniscus; MRI signal; deep learning
Motivation: The pathogenesis of knee osteoarthritis is affected by many factors. Among them, meniscus of patients with different stages of disease in magnetic resonance imaging reveal different degrees of abnormal signals.
Goal(s): In this work, abnormal meniscus signals in 400 MRI images of 40 cases were quantified.
Approach: The quantitative indicators were evaluated according to the clinical manifestations of patients.
Results: Results showed that the average area ratios of abnormal meniscal signals were different between the case group and the control group, and the different degrees of abnormal signals could be used as biomarkers of knee osteoarthritis.
Impact: The average area ratios of abnormal signals of meniscus can be used as new biomarkers to provide some objective and accurate biomarkers for knee osteoarthritis.
Introduction
Knee osteoarthritis is a complete joint disease, which is synthesized by multiple factors1, 2. The disease is associated with joint pain and progressive destruction of joint cartilage, meniscus structure, and can lead to permanent physical damage in patients. Previous studies have shown that quantitative measurement of meniscus volume and meniscus compression can be used as predictive biomarkers for structural knee osteoarthritis3, 4. At the same time, in a study of knee magnetic resonance images, it was found that the meniscus of patients with different disease stages showed different changes in volume, position and signal intensity5. Therefore, the purpose of this work was to quantify the abnormal meniscus signals in knee images of different patients and explore the relationship between the average area ratio of different abnormal signals and the patients' condition.Methods
Selection of case and control kneesThe OAI public dataset was used for retrospective analysis to study abnormal signals in the meniscus. Control group (n=20) was selected from the participants who did not develop knee osteoarthritis from baseline to 48 months, and case group (n=20) was defined as participants whose knees had no knee osteoarthritis at the baseline (Kellgren and Lawrence grading (KLG) 0 or 1), and knee osteoarthritis (KLG≥2) occurred at follow-up. The two sets of data were analyzed using 10 contiguous slices from the center of MRI images of meniscus of the knee at the baseline and the last year of follow-up. The meniscus labels of 400 MRI images were all labeled by an orthopedic surgeon (more than 5 years of experience).
Meniscus segmentation and abnormal signals quantification
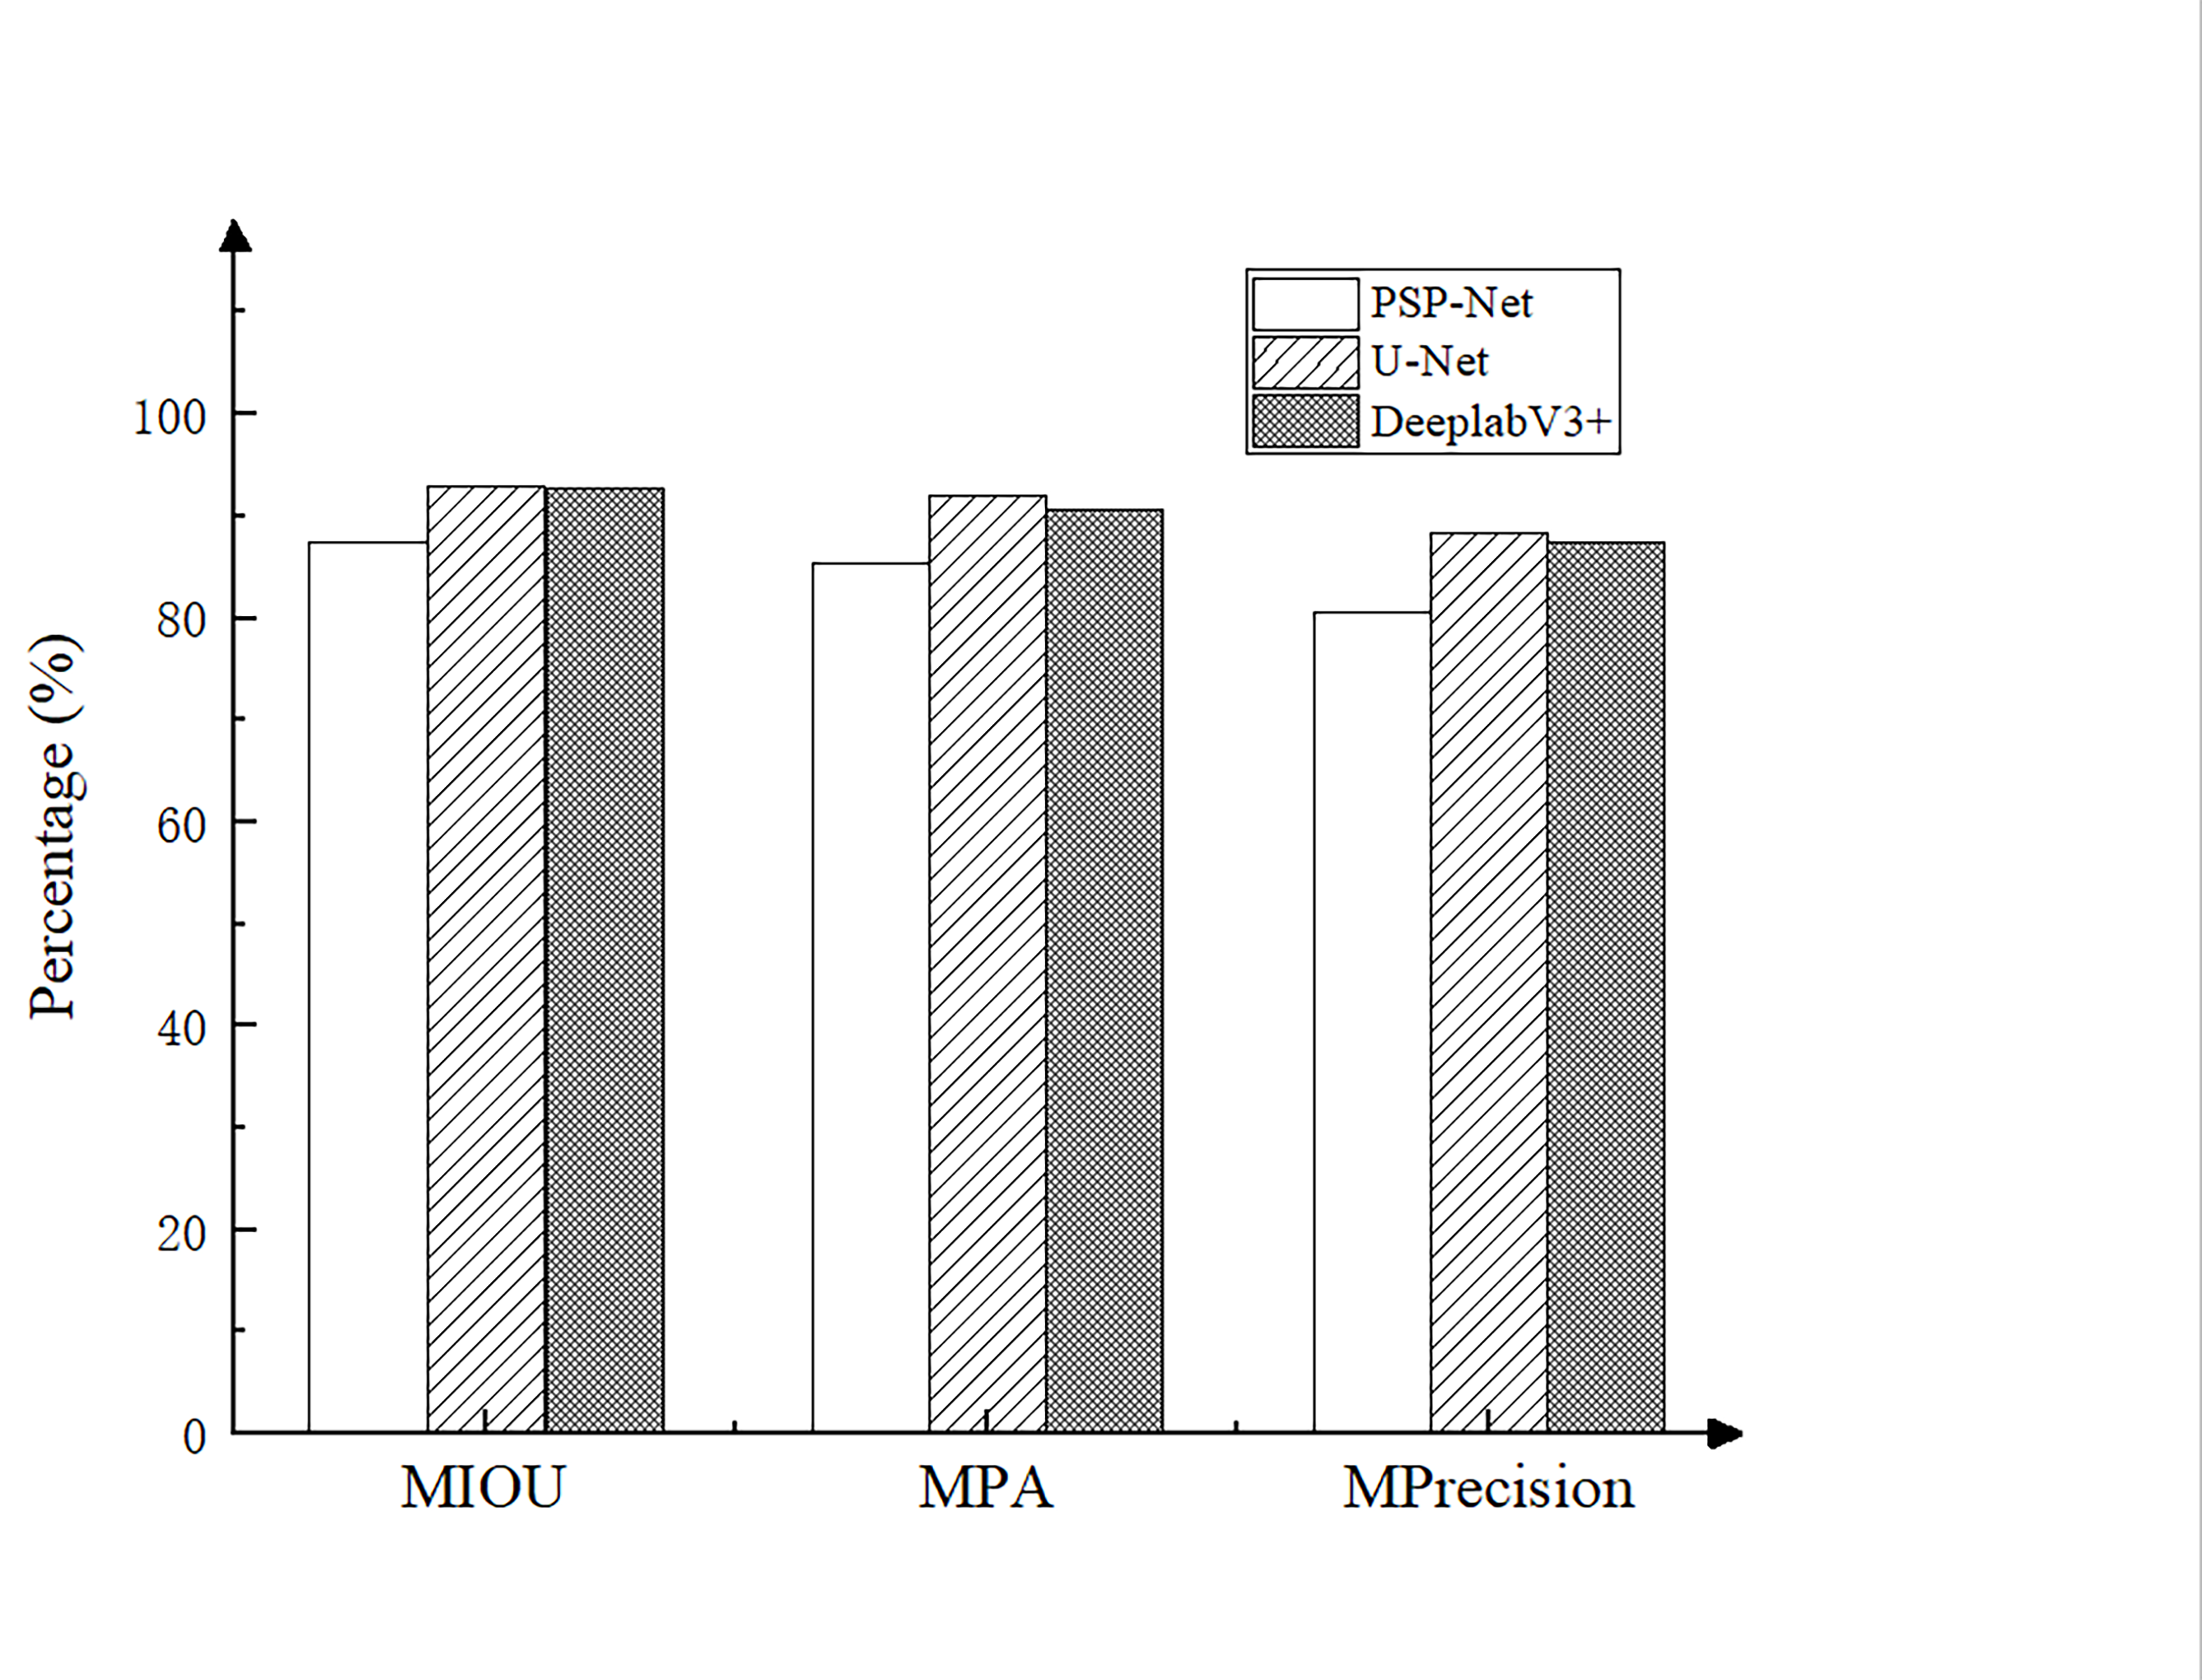
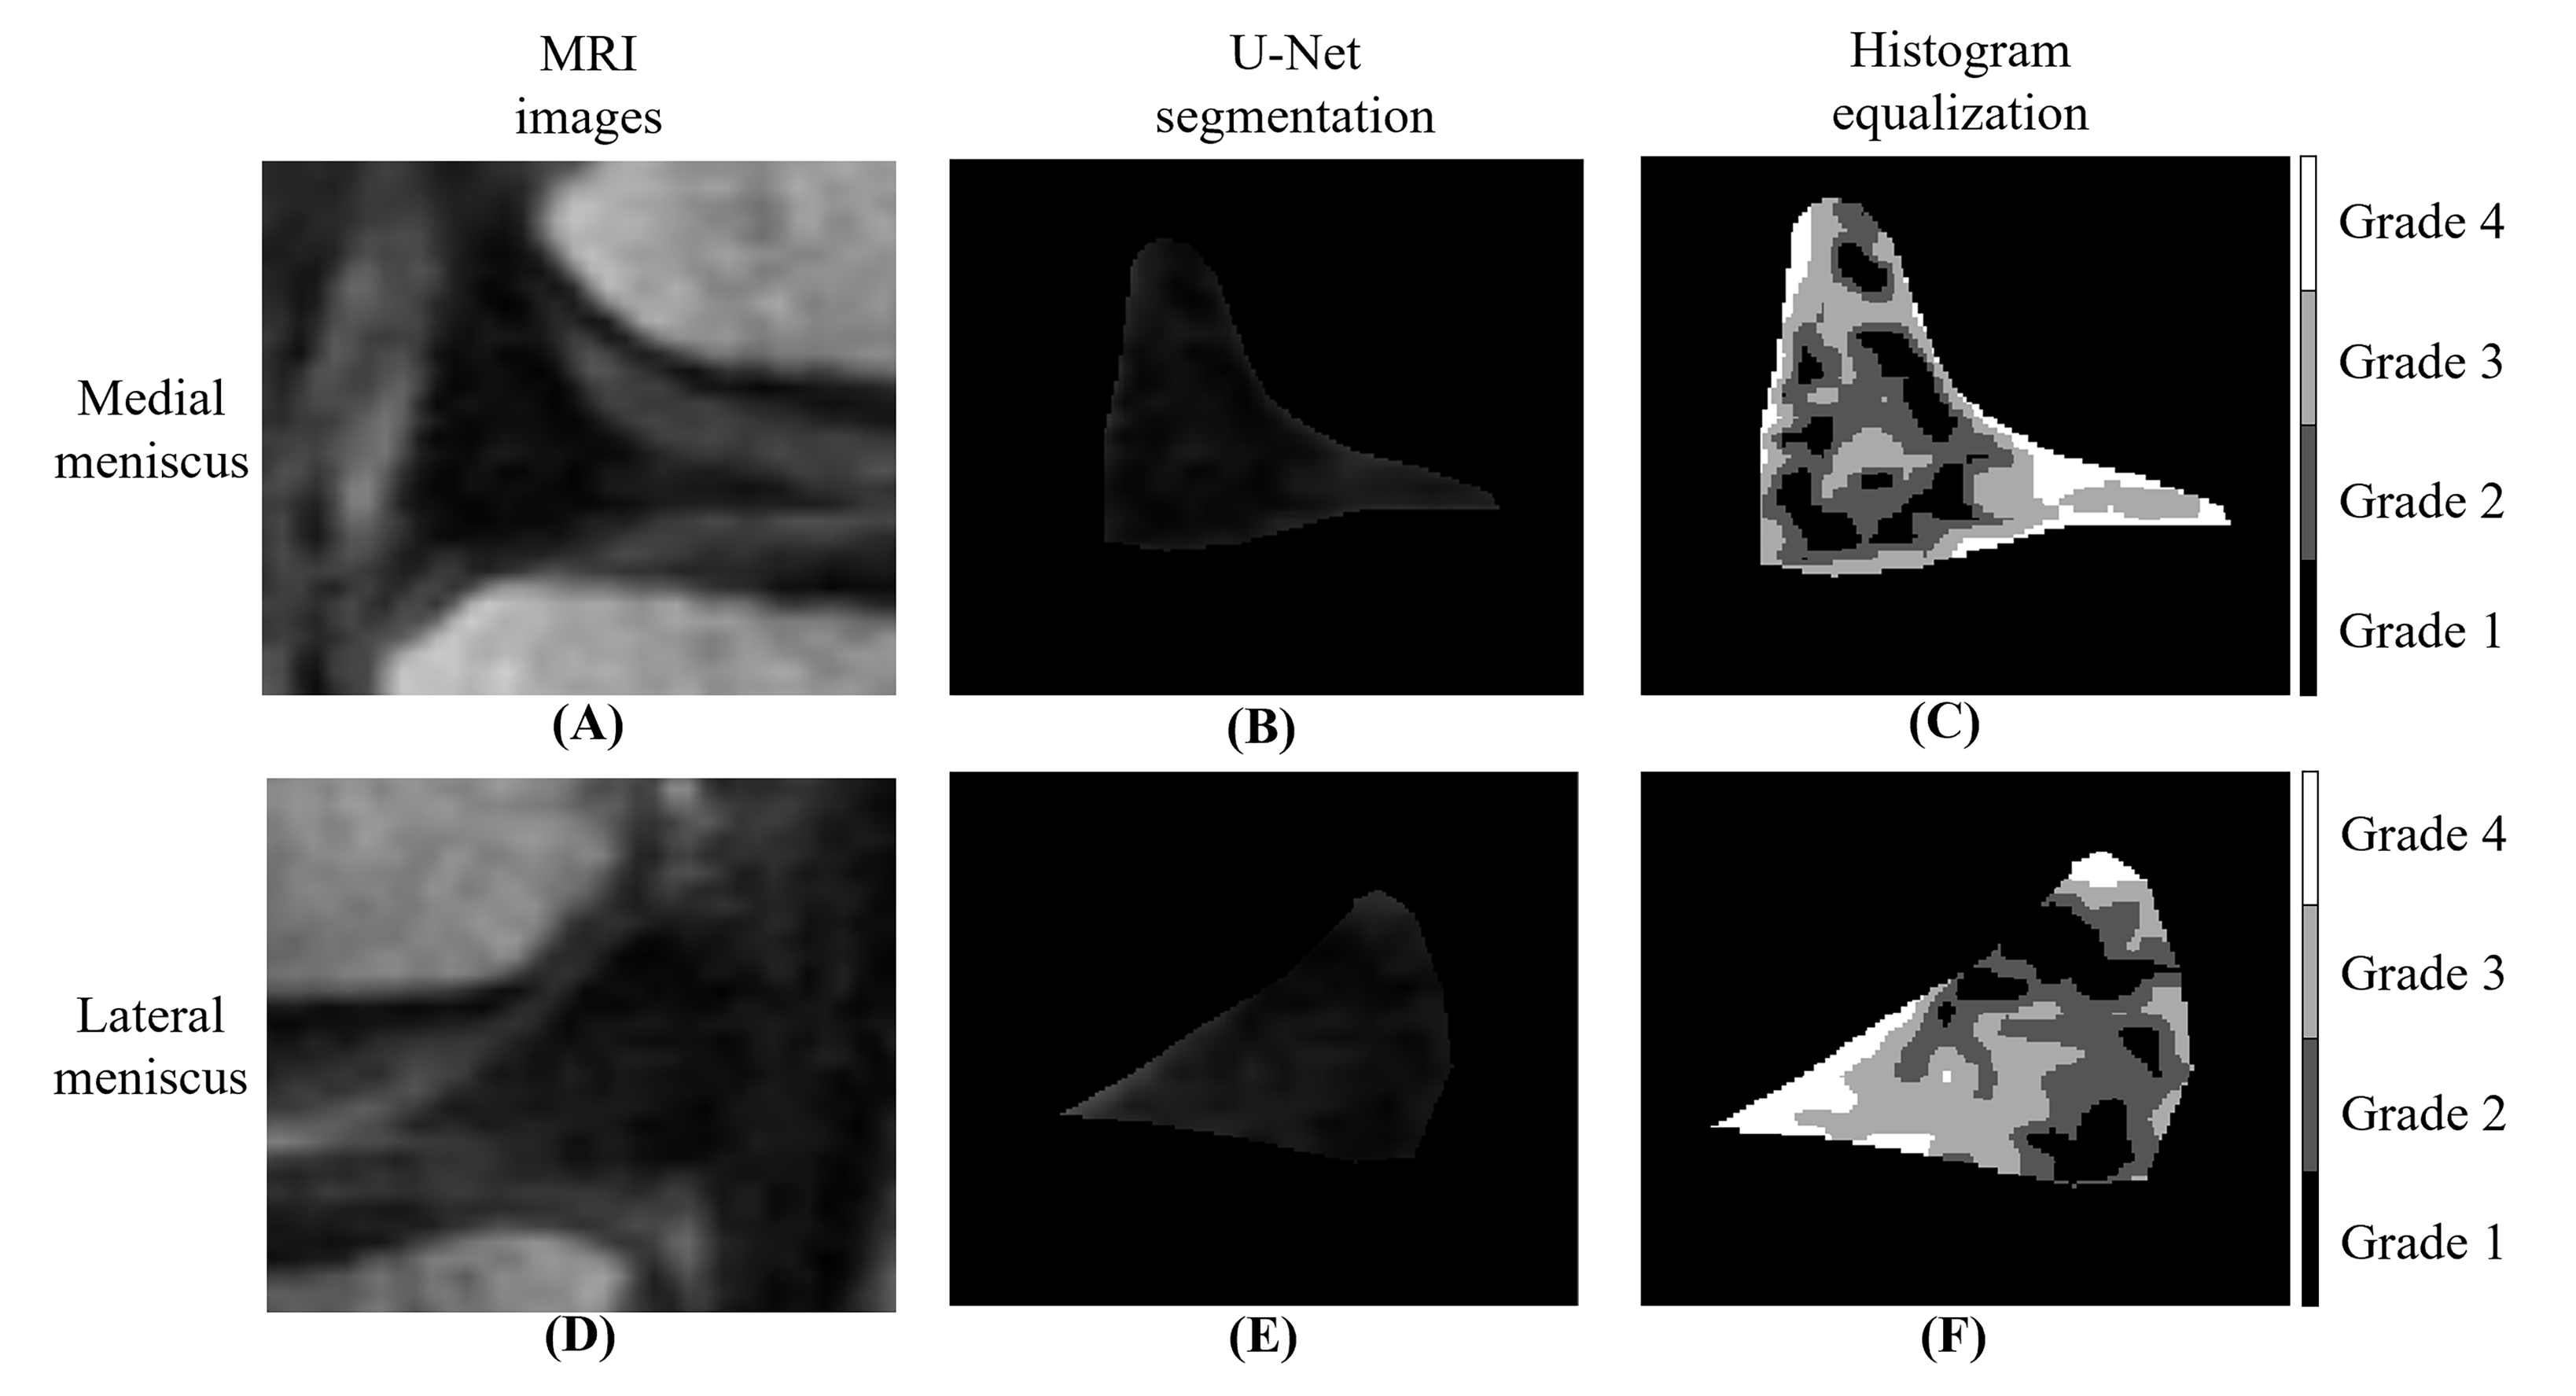
U-Net neural network is more and more widely used in medical image segmentation6. After adjusting the parameters, comparing three common networks of PSPNet, U-Net and DeeplabV3+ by three evaluation indexes (MIOU, MPA and MPrecision), the network with the best performance was selected as the final segmentation network, and the segmentation images of meniscus were obtained. The segmented meniscus images were processed by histogram equalization. Finally, the abnormal signals of meniscus were quantified, and divided into four grades, then the average area ratio of different abnormal signals was measured. The quantitative result of each subject was an average value calculated from the combined measurements of the 10 slices for all the grades.
Statistical analysis
T-test was performed to verify the difference between the two groups, statistical significance was accepted when p<0.05. Experiments were implemented using MATLAB, and PyCharm 2020.
Results
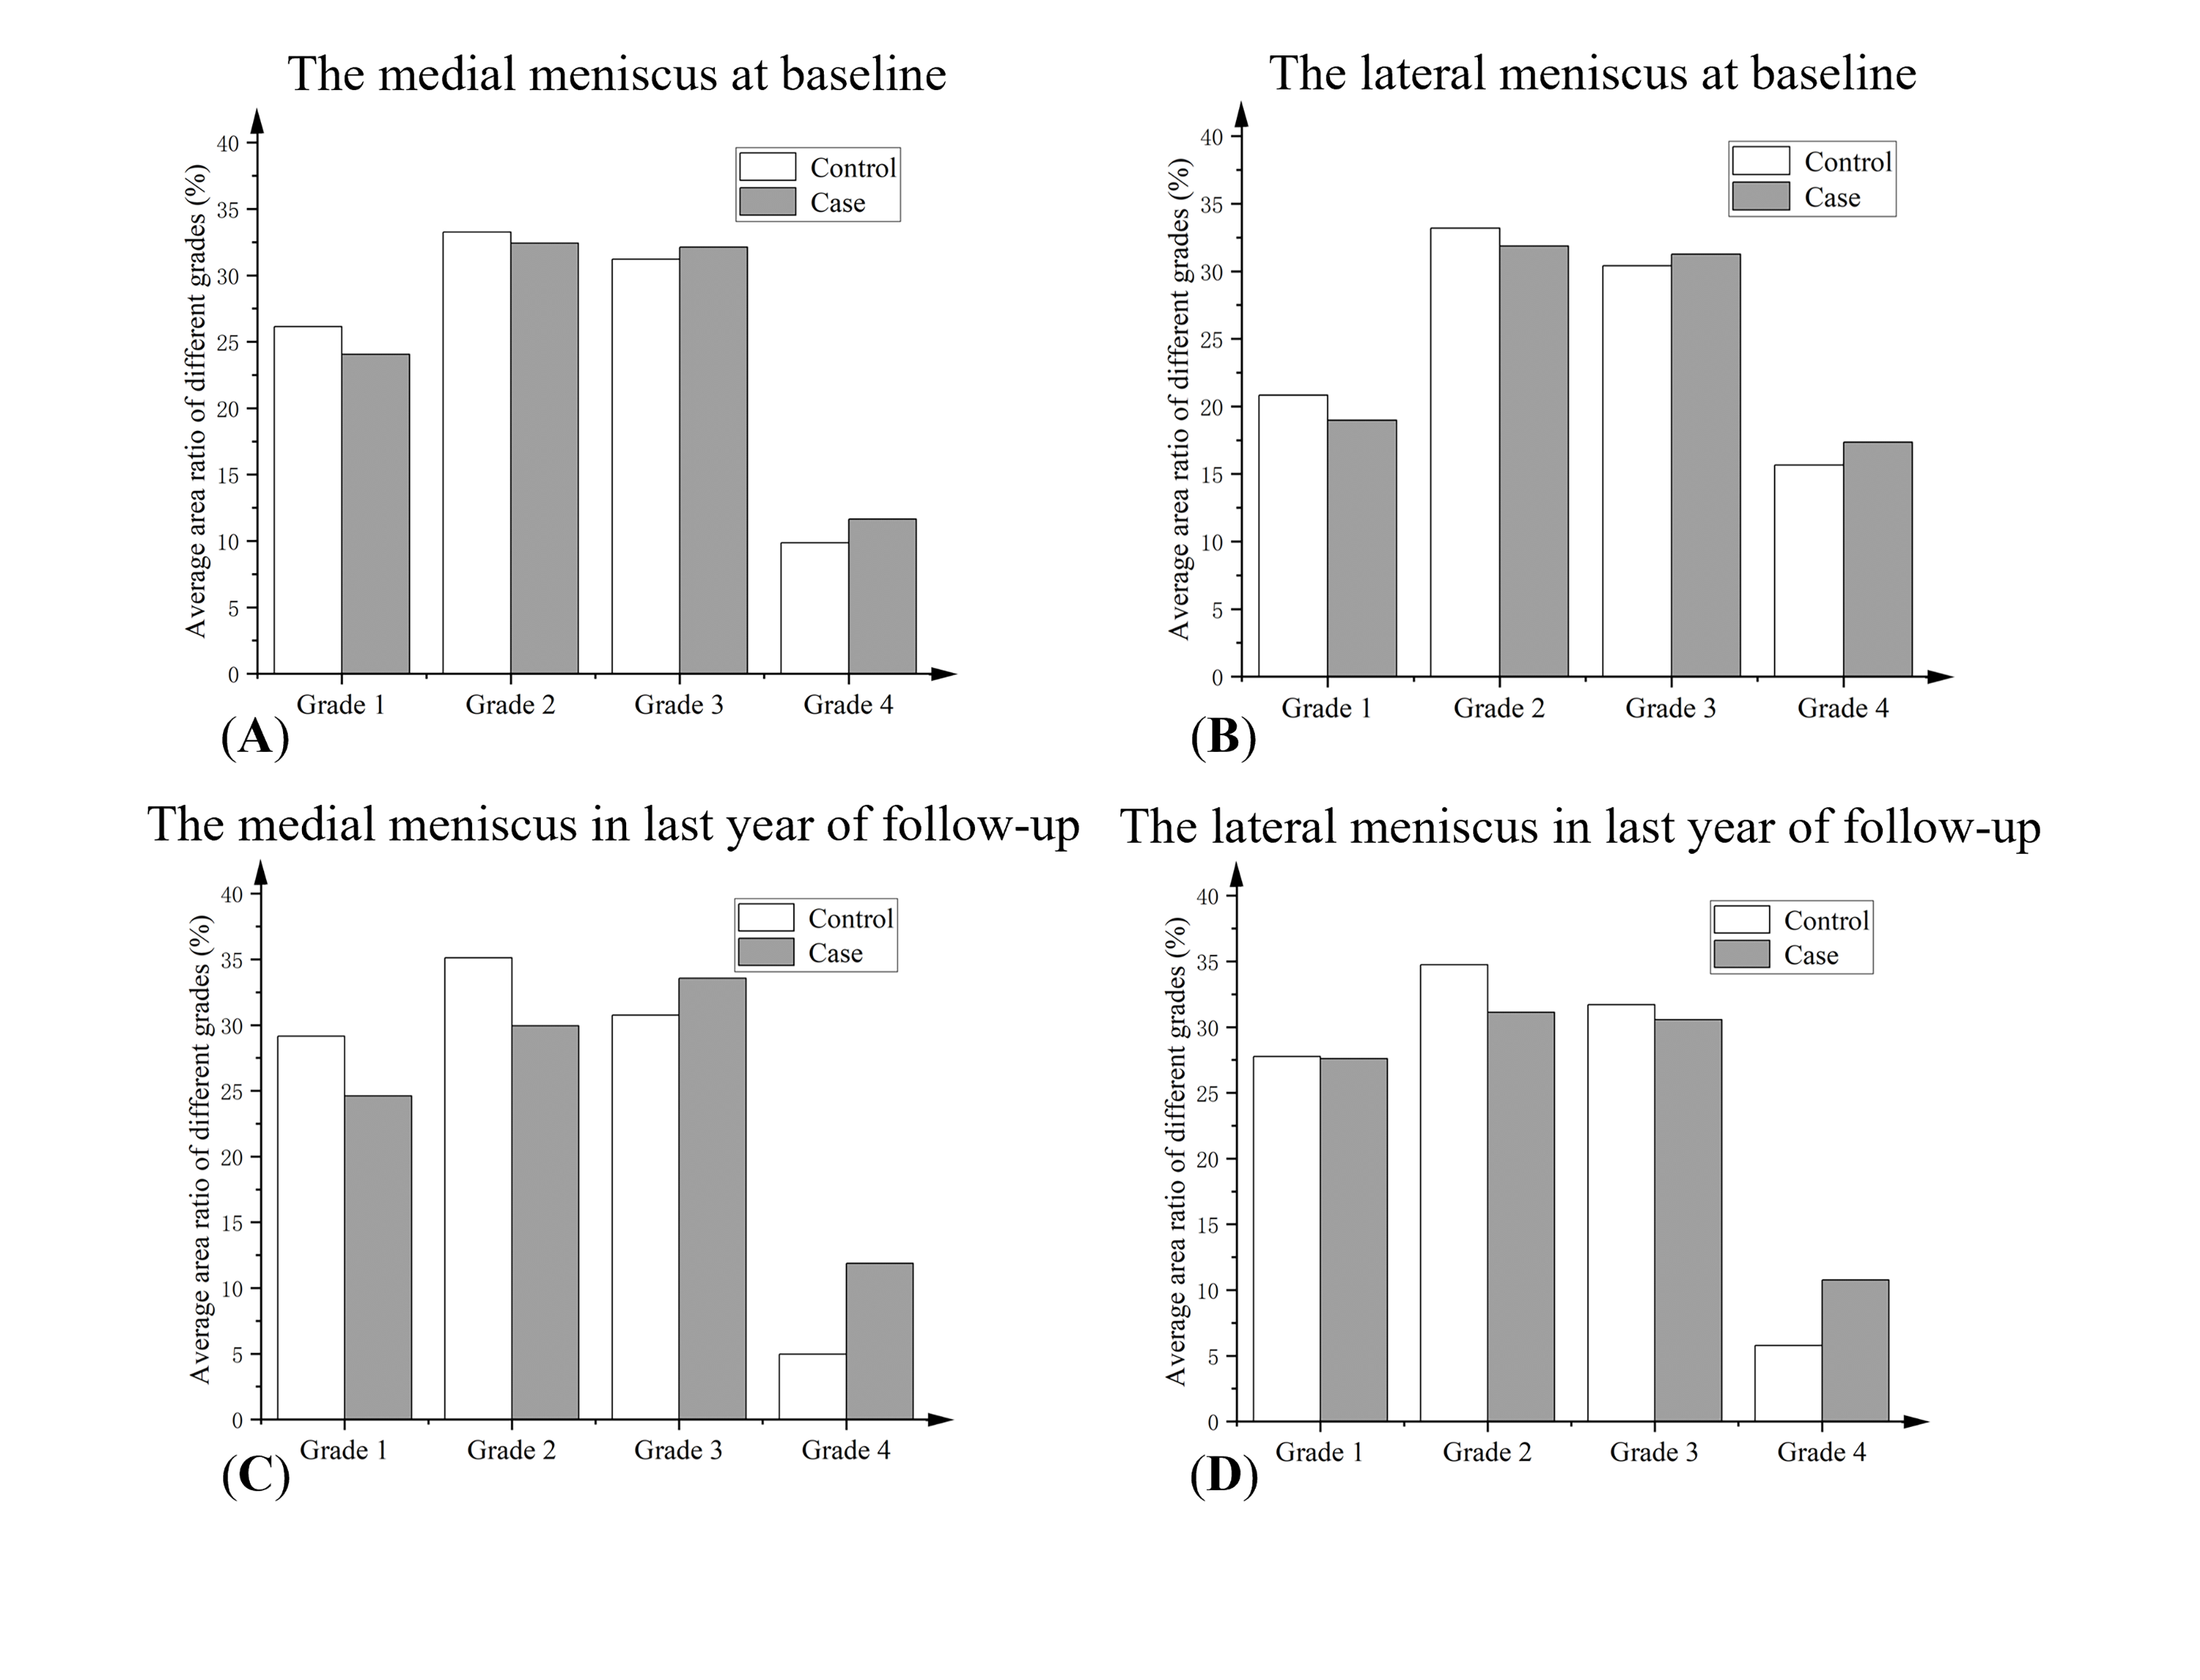
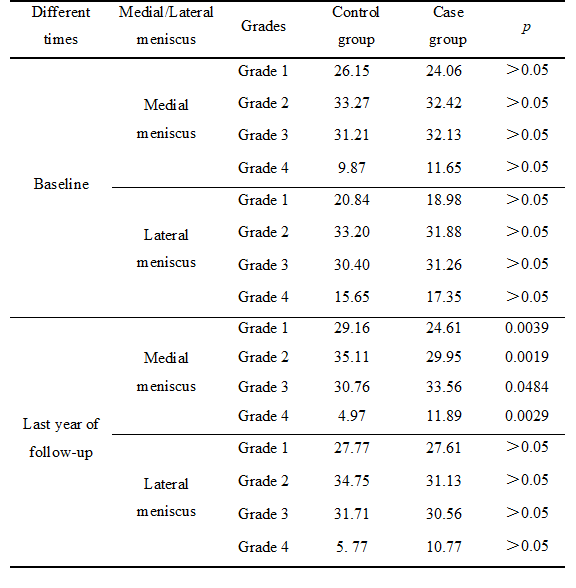
As can be seen from Figure 1, the performance of U-Net is superior to the other two networks in all aspects, U-Net is finally selected as the segmentation network of meniscus. Figure 2 shows an example of U-Net segmentation results of the meniscus in the knee MRI images, and the meniscus images after histogram equalization, which finally shows four different colors of signals in the meniscus region. Figure 3 shows the average area ratios of four different signals in the medial and lateral meniscus of the control and case group during the baseline and the last year of follow-up. Transversally, there were differences in all four grades of signals between the control and the case group at baseline, but the differences were not significant (p>0.05 ). In the last year of follow-up, the differences between the control and case group increased in all grades of signals, and the differences between the two groups had statistically significant in the medial meniscus (p<0.05). Longitudinally, the medial meniscus showed significant growth in all grades of signals in the last year of follow-up, especially the Grade 4. The data in Table 1 confirm these findings.Discussion & Conclusions
In this study, the average area ratios of meniscus abnormal signals were used as new biomarkers for knee osteoarthritis using deep learning and histogram equalization methods, and the feasibility of these biomarkers was verified. Our results show that the average area ratios of abnormal signals in meniscus are closely related to knee osteoarthritis and in agreement with previous research5. The study has two limitations. First, it was a simply cross-sectional study, and follow-up research and the longitudinal development analysis are not considered. Second, this is a single-center study, and the sample size is relatively small. More validation is needed to validate these results by expanding the data volume and reducing measurement errors. These findings may provide some objective biomarkers for the diagnosis of knee osteoarthritis.Acknowledgements
This work receives support from the National Natural Science Foundation of China (62001005), the Anhui Provincial Natural Science Foundation (2008085QH425), and the Grants for Scientific Research of BSKY (XJ201811) from Anhui Medical University. The authors also wish to acknowledge support from the Medical Big Data Supercomputing Center System of Anhui Medical University for their assistance with numerical calculations.References
1. Loeser RF, Goldring SR, Scanzello CR, et al. Osteoarthritis: a disease of the joint as an organ. Arthritis Rheum, 2012, 64(6): 1697–1707.
2. Englund M. The role of biomechanics in the initiation and progression of OA of the knee Best Practice & Research. Clin Rheumatol, 2010, 24(1): 39–46.
3. Dawei Xu, Jan van der Voet, Nils M Hansson, et al. Association between meniscal volume and development of knee osteoarthritis. Rheumatology, 2021, 60(3): 1392–1399.
4. K. Emmanuel, E. Quinn, J. Niu, et al. Quantitative measures of meniscus extrusion predict incident radiographic knee osteoarthritis – data from the Osteoarthritis Initiative. Osteoarthritis and Cartilage, 2016, 24(2): 262-269.
5. Andrea Wenger, Wolfgang Wirth, Martin Hudelmaier, et al. Meniscus body position, size, and shape in persons with and persons without radiographic knee osteoarthritis: quantitative analyses of knee magnetic resonance images from the osteoarthritis initiative, 2013, 65(7): 1804-1811.
6. Zhang H, Goodfellow I, Metaxas D, et al. Self-attention generative adversarial networks. Proceedings of the 36th International Conference on Machine Learning, 2019: 7354-7363.
Figures