3793
Staging of Primary Lymphedema Based on Radiomics Features from Subcutaneous Tissues in Lower Extremity MRI1Department of Radiology, Beijing Shijitan Hospital, Capital Medical University, Beijing, China, Beijing, China, 2Institute of Research and Clinical Innovations, Neusoft Medical Systems Co., Ltd, Shanghai, China
Synopsis
Keywords: Diagnosis/Prediction, Machine Learning/Artificial Intelligence, Primary lower extremity lymphedema
Motivation: Traditional imaging-based staging methods for PLEL rely on subjective assessments by medical professionals and often struggle to capture the micro-level changes associated with lymphedema, which limits the accuracy and granularity of staging.
Goal(s): To explore the value of radiomicss features based on different components extracted from MRI for assessing the staging of PLEL.
Approach: We proposed a machine learning model to integrate multi-region radiomics for automated PLEL staging and employed deep learning for automated subcutaneous tissue segmentation in the lower extremity MRI.
Results: The Dice coefficient for subcutaneous tissue segmentation scored 0.92, and the AUC for lymphedema staging was 0.821.
Impact: The machine learning model based on radiomics in this study shows promising potential and value in lymphedema staging, which is expected to reduce subjective variability and potentially eliminate the need for clinical assays, thus enhancing its clinical applicability.
Background or purpose
Primary lower extremity lymphedema (PLEL) is a chronic progressive swelling of the limbs due to congenital disruption or impairment of lymphatic reflux, excessive accumulation of lymphatic fluid in the subcutaneous soft tissues of the limbs, lipohypertrophy and fibrous connective tissue hyperplasia 1,2. For clinical staging of ISL in PLEL, accurate assessment of subcutaneous tissue edema infiltration and fat deposition is critical, and understanding the fluid and fat composition of patients may help determine the most appropriate clinical treatment for the patients 3,4. Previous studies have evaluated the favorable site and the distribution pattern of the hydrolipidic component of lymphedema and the correlations between hydrolipid content and clinical staging 5. However, conventional MRI characteristics are mostly morphologic and those functional features visible to the naked eye does not allow extraction of microscopic heterogeneity of the lesion area. Therefore, we sought to explore whether more diagnostic imaging information could be obtained to assess PLEL severity with the proposed method.Materials and Methods
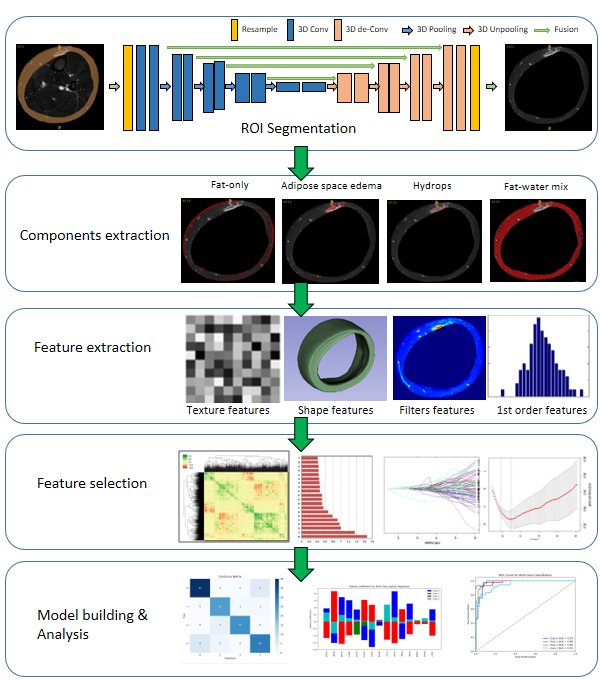
Subjects: This retrospective study included 112 patients with unilateral primary lower extremity lymphedema diagnosed using lymphoscintigraphy. The patients were classified into two stages based on the International Society of Lymphology (ISL) clinical staging criteria by two experienced radiologists with ten years of experience. The dataset was divided into a training set of 78 patients and a test set of 34 patients. Algorithm: In the process of developing the lymphedema staging model (see Figure 1), we initiated with the automated segmentation of subcutaneous tissue's region of interest (ROI) using a 3D-Unet. Subsequently, thresholds were applied to extract the constituents of the four subcutaneous tissues. We employed PyRadiomics 6 to extract an extensive set of 1236 radiomics features from each constituent, encompassing four major categories: morphological, first-order statistical, textural, and filtering features. Following feature extraction, rigorous feature selection was performed as well. Firstly, low-variance features, indicative of noise, were removed to enhance data quality. The feature matrix was then centralized and standardized for comparability. Dimensionality reduction was implemented using Spearman correlation coefficient analysis to eliminate features with correlations exceeding a threshold of 0.8 7, reducing redundant information, which resulted in the selection of the top 20 relevant features. Furthermore, we employed Lasso regression with 10-fold cross-validation to identify the optimal alpha value, in which the Lasso model was trained to retain the 12 most influential features for subsequent classification tasks. To address class imbalance, we used the Synthetic Minority Over-sampling Technique (SMOTE) to oversample the training dataset and rectify class distribution. Subsequently, a logistic regression model was constructed and fitted it with the SMOTE-preprocessed training data. The model was iteratively trained with a maximum of 1000 iterations to ensure optimal performance and convergence. The 3D-Unet segmentation model was trained with a batch size of 8 and for 500 epochs with the weighted Dice coefficient loss as the loss function and the Adam optimizer with an initial learning rate of 5e-4. Statistical analysis: The evaluation metrics used include the Dice coefficient for segmentation performance, as well as Receiver Operating Characteristic (ROC) analysis, AUC, accuracy, precision, recall, and F1 score for classification performance assessment.Results
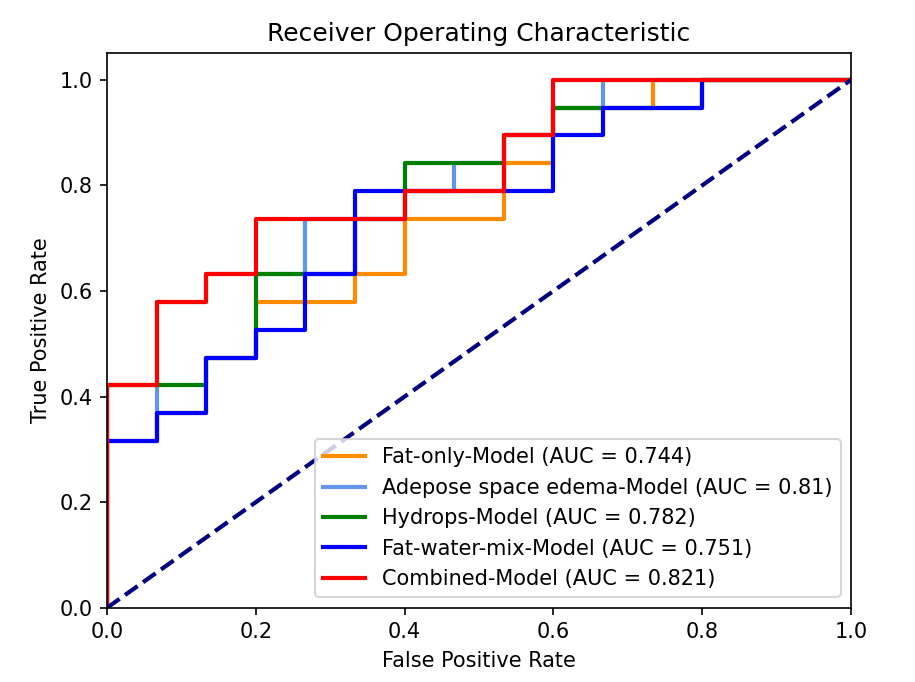
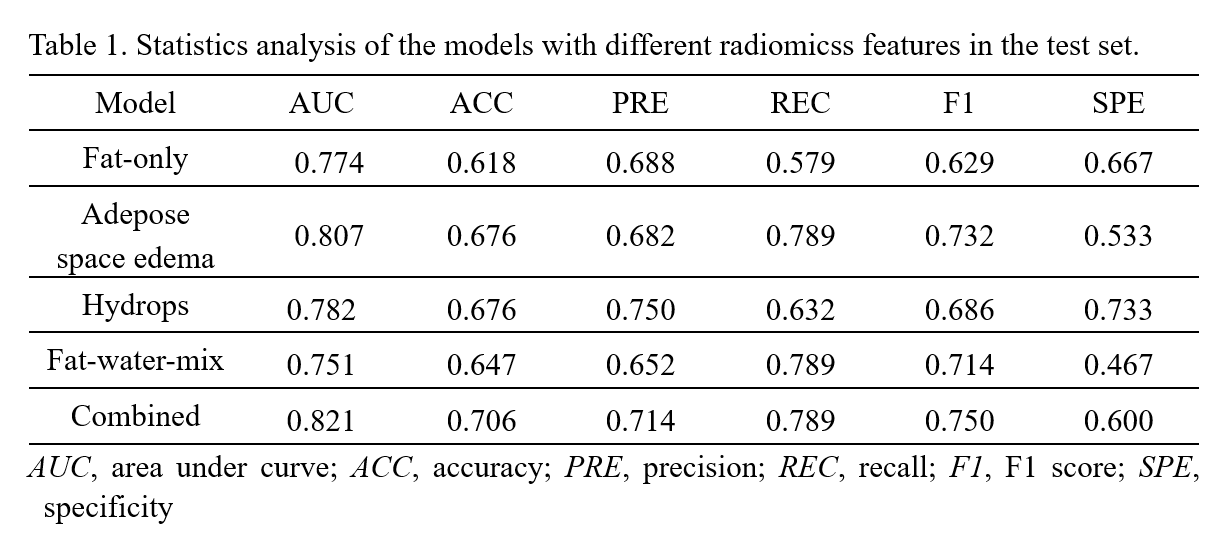
The Dice coefficient for the automated segmentation of subcutaneous tissue was 0.92. The values of AUC were 0.774, 0.807, 0.782, and 0.751 for the staging model utilizing only fat component features, adipose space edema, hydrops, and the fat-water-mix, respectively. Notably, the model incorporating features from all four tissue components exhibited the most favorable performance in terms of both AUC (0.821) and ROC evaluation (see Table 1 & Figure 2).Discussion
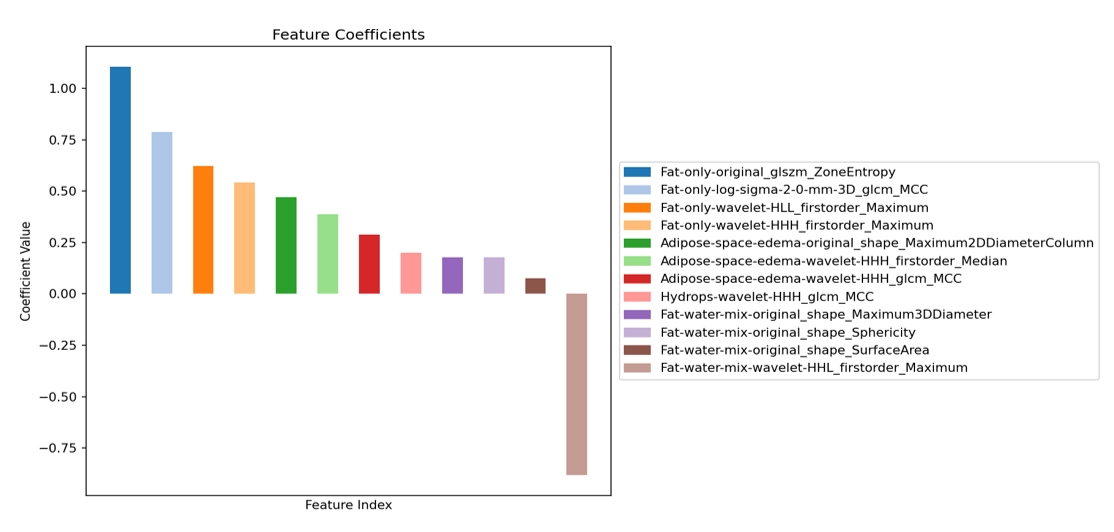
In the individual component-based staging models, the model utilizing radiomics features derived from Adipose space edema exhibits the best staging performance with an AUC of 0.807. In contrast, the combined staging model, incorporating radiomics features from all the four components, outperforms the individual component-based models, achieving an improved AUC of 0.821. This suggests that the integration of radiomics features from multiple tissue components could provide valuable assistance in staging. The mixed model comprises a total of 13 features (see Figure 3), incorporating four different components: Fat-only, Adipose space edema, Hydrops, and Fat-water-mix. Specifically, Fat-only, Adipose space edema, Hydrops, and Fat-water-mix, containing 4, 3, 1, and 4 features, respectively. Notably, "Fat-only-original_glszm_ZoneEntropy" and "Fat-only-log-sigma-2-0-mm-3D_glcm_MCC" exhibit the most significant positive impact on staging, while "Fat-water-mix-wavelet-HHL_firstorder_Maximum" has the most pronounced negative impact. The experimental results confirm the effectiveness of the fusion model and its potential clinical values in assisting lymphedema staging. Future work will further explore the staging value by using multi-parametric MRI for lymphedema.Acknowledgements
No acknowledgement found.References
[1] Maclellan RA, Greene AK. Lymphedema[J]. Semin Pediatr Surg. 2014;23(4):191-197.
[2] Executive Committee of the International Society of Lymphology. The diagnosis and treatment of peripheral lymphedema: 2020 Consensus Document of the International Society of Lymphology[J]. Lymphology 2020;53(1):3-19
[3] Duhon BH, Phan TT, Taylor SL, Crescenzi RL, Rutkowski JM. Current Mechanistic Understandings of Lymphedema and Lipedema: Tales of Fluid, Fat, and Fibrosis[J]. Int J Mol Sci. 2022;23(12):6621
[4] Crescenzi R, Donahue PMC, Garza M, et al. Subcutaneous Adipose Tissue Edema in Lipedema Revealed by Noninvasive 3T MR Lymphangiography[J]. J Magn Reson Imaging. 2023;57(2):598-608.
[5] Dayan JH, Wiser I, Verma R, et al. Regional Patterns of Fluid and Fat Accumulation in Patients with Lower Extremity Lymphedema Using Magnetic Resonance Angiography[J]. Plast Reconstr Surg. 2020;145(2):555-563.
[6] Mu W, Schabath M B, Gillies R J. Images are data: challenges and opportunities in the clinical translation of radiomics[J]. Cancer Research, 2022, 82(11): 2066-2068.
[7] Akoglu H. User's guide to correlation coefficients[J]. Turkish journal of emergency medicine, 2018, 18(3): 91-93.
Figures