3790
T2 Distribution Analysis of Inflamed Bone Marrow Compartments in MR Images with Quantitative T2-mapping1Faculty of Biomedical Engineering, Technion - Israel Institute of Technology, Haifa, Israel, 2Pattern Recognition Lab, Friedrich-Alexander-University Erlangen-Nuernberg, Erlangen, Germany, 3Biomedical Core Facility, Technion - Israel Institute of Technology, Haifa, Israel
Synopsis
Keywords: Diagnosis/Prediction, Inflammation, Relaxometry
Motivation: Conventional methods for imaging inflammation-related bone marrow (BM) changes are limited, necessitating advanced quantitative MRI approaches. However, capturing microscopic details poses challenges. Existing T2 distribution estimation methods' limitations led to the development of P2T2-Boot.
Goal(s): We aimed to improve BM inflammation analysis using P2T2-Boot and assess its ability to differentiate healthy and inflamed BM.
Approach: P2T2-Boot, a neural network for T2 distribution estimation, was developed with bootstrapping techniques, trained on simulated MRI signals, and tested on real mice data.
Results: The bootstrapped model outperformed others at low Signal-to-Noise Ratios and demonstrated superior performance in distinguishing inflammatory and non-inflammatory mice.
Impact: P2T2-Boot significantly enhances detecting BM inflammation, excelling in noisy conditions. Its superiority underscores its potential for advancing disease studies. The method's potential extensions make it a promising tool for advancing inflammation-related disease studies and clinical applications.
INTRODUCTION
Understanding inflammation is crucial for advancing therapies against related diseases. Inflammation induces significant changes in the hematopoietic bone marrow (BM), leading to immune cell release. Conventional techniques such as biopsy and histology offer limited BM insights due to invasiveness, lack of automation, and time constraints. To overcome these limitations, quantitative Magnetic Resonance Imaging (MRI) techniques are essential. While T2 scalar mapping provides a broad view, it lacks microscopic details. Estimating T2 distribution is vital for obtaining pixel-wise compositions necessary for detailed and microscopic BM structure analysis during inflammation. Traditional methods for obtaining T2 distribution from MRI signals have shortcomings, and deep learning models face challenges like overfitting and lack of robustness.To tackle these challenges, we introduce P2T2-Boot, an improved physically primed neural network for T2 distribution estimation using bootstrapping2. This innovative model aims to enhance accuracy and reliability in analyzing BM changes, thereby contributing significantly to inflammation-related disease studies. To assess its capability in discerning healthy and inflamed BM, we conducted a study using mice.
METHODS
Data: Both simulated and real MRI data played a key role in this study. Simulated signals, a fundamental component for training the network, were generated using the Extended Phase Graph algorithm3.For the empirical part, high-resolution real MRI data were acquired from mouse femurs using a 9.4 Tesla Bruker BioSpec 94/20 MRI scanner and a surface coil for higher resolution. The images were acquired with a multi-slice multi-echo (MSME) sequence, each slice consisting of ten T2-weighted images with an echo time (TE) of 10.385ms. The in-plane resolution was 0.1mm × 0.1mm with a slice thickness of 0.04828mm. The data set included three different types of mice: control mice, mice with acute inflammation induced by lipopolysaccharide (LPS) injections, and mice with chronic inflammation induced by streptozotocin (STZ)-induced diabetes and subsequent LPS injections.
Algorithms: We utilized the bootstrapped adaptation of the T2 distribution estimation algorithm, known as P2T2, to enhance robustness and prediction accuracy, especially in noisy data scenarios. This involves generating multiple predictions by averaging signals subsampled from the original input data, specifically focusing on crucial parameters: the TE array and the signal array. These subsampled arrays form the basis of the P2T2 model, which is then trained and tested using these bootstrapped inputs.
This approach, coupled with Gaussian Mixture Model (GMM) fitting, enables assessment of BM compartments. This integration allows to precisely characterize the different BM compartments, making scientifically meaningful conclusions from the data possible.
Experiments:
In initial experiments, hyperparameters, including bootstrapping specifics, were optimized for mouse data. The optimized model was compared with the original P2T2 model, without bootstrapping, and the MIML model5, the ungeneralised P2T2, using diverse metrics like signal approximation and inflammation detection via GMM. After GMM fitting, parameters were computed, and group disparities were rigorously analyzed using ANOVA and Games-Howell post-hoc tests to identify significant variances among the mice groups. Subsequent analysis evaluates whether the use of the P2T2-Boot results in improved discrimination between different types of inflammation, comparing it furthermore to the distinguishability using T2 scalar mapping6.
RESULTS
The bootstrapped model outperformed others in low Signal-to-Noise Ratios (SNRs). Comparing signal approximation and T2 distribution estimates on real mouse data revealed no significant differences between models. All deep learning-based models outperformed T2 scalar mapping, highlighting the bootstrapped method's remarkable ability to distinguish between mice with inflammatory and non-inflammatory conditions during statistical analysis. This approach significantly increased the effect size by an order of magnitude compared to the Multiple Instance Multiple Label (MIML) technique, as evidenced by an ANOVA p-value of 5.68e-03 for MIML and 0.80e-03 for P2T2-Boot. In addition, the Games-Howell p-values associated with P2T2-Boot are significantly lower than those of both P2T2 and MIML, indicating its superior performance in statistical discrimination (Figure 4).DISCUSSION
The superiority of the bootstrapped approach in assessing the distinction between inflamed and non-inflamed mice using real data can be attributed to bootstrapping's capacity to reduce the effect of noise-induced variations in the mean values of the bone metaphysis, thus facilitating the discrimination process. While simulated signals offer insights, the true significance lies in real data performance, where the bootstrapped version demonstrated the most favorable outcomes.CONCLUSION
While all T2 distribution estimation models performed well even with noisy data, the new P2T2-Boot plays a pivotal role in revealing significant trends between inflamed and non-inflamed mice, marking a significant improvement for further research in that area. This methodology, with potential extensions to low-field MRI and human applications, illuminates structural changes in diseases and inflammation. It offers valuable insights, guiding targeted interventions with similar network architectures and minor hyperparameter adjustments.Acknowledgements
This work was supported in part by research grants from the Israel-US Binational Science Foundation, the Israeli Ministry of Science and Technology, the Israel Innovation Authority, and the joint Microsoft Education and the Israel Inter-university Computation Center (IUCC) program. It is furthermore supported by the Israel Science Foundation 446/21 and 660/21.References
1. Shi C, Jia T, Mendez-Ferrer S, Hohl TM, Serbina NV, Lipuma L, et al. Bone marrow mesenchymal stem and progenitor cells induce monocyte emigration in response to circulating toll-like receptor ligands. Immunity. 2011;34(4):590-601.
2. Ben-Atya H, Freiman M. P2T2: A physically-primed deep-neural-network approach for robust T2 distribution estimation from quantitative T2-weighted MRI. Comput Med Imaging Graph. 2023;107:102240.
3. Rakshit S, Wang K, Tamir JI. A GPU-accelerated Extended Phase Graph Algorithm for differentiable optimization and learning. Proc Intl Soc Mag Reson Med. 2021;29.
4. Efron B, Tibshirani RJ. An Introduction to the Bootstrap. CRC Press; 1994.
5. Yu T, Canales-Rodríguez EJ, Pizzolato M, Piredda GF, Hilbert T, Fischi-Gomez E, et al. Model-informed machine learning for multi-component T2 relaxometry. Med Image Anal. 2021;69:101940.
6. Giri S, Chung YC, Merchant A, Mihai G, Rajagopalan S, Raman SV, et al. T2 quantification for improved detection of myocardial edema. J Cardiovasc Magn Reson. 2009;11(1):1-13.Figures
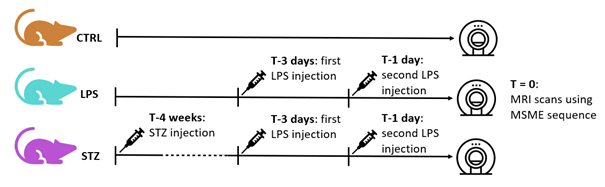
Figure 1: Imaging procedure of the three mice groups. Images of MRI and histology were created using C57BL/6 mice. The study focused on three groups of 12-week-old mice: a control group (CTR-group) of six mice, an LPS-induced acute inflammation group (LPS-group)
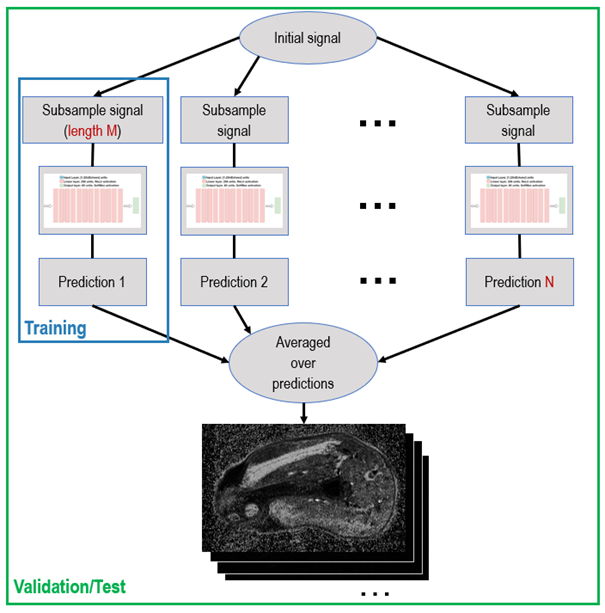
Figure 2: The Bootstrapping procedure of the P2T2 model for training, validation and testing, resulting in a series representing the T2 distribution estimation.
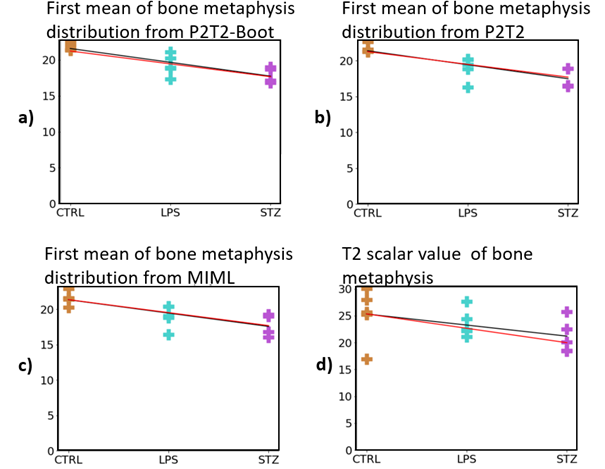
Figure 3: GMM mean parameter of bone metaphysis, describing the first peak of the T2 distribution estimated by three different models, compared with T2 scalar values of bone metaphysis. The goal is to distinguish between the different mice groups: control mice, mice with acute inflammation induced by lipopolysaccharide (LPS) injections, and mice with chronic inflammation induced by streptozotocin (STZ)-induced diabetes and subsequent LPS injections.
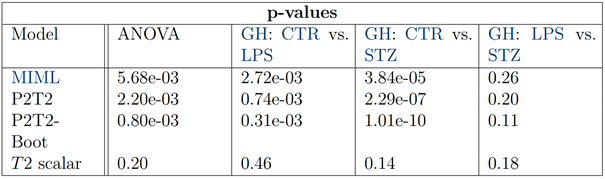
Figure 4: P-values for ANOVA and Games-Howell for the analysis of changes in bone metaphysis with increasing inflammation using different deep learning models and T2 scalar mapping. The goal is to distinguish between the different mice groups: control mice, mice with acute inflammation induced by lipopolysaccharide (LPS) injections, and mice with chronic inflammation induced by streptozotocin (STZ)-induced diabetes and subsequent LPS injections.