3788
Impact of image resolution on neural network based automatic scar segmentation in cardiovascular magnetic resonance imaging1Institute for Biomedical Engineering, University and ETH Zurich, Zurich, Switzerland, 2Center of Surgical Research, University Hospital Zurich, Zurich, Switzerland, 3Department of Health Sciences and Technology, ETH Zurich, Zurich, Switzerland
Synopsis
Keywords: Diagnosis/Prediction, Machine Learning/Artificial Intelligence
Motivation: Deep learning for myocardial scar segmentation offers an alternative to time-consuming and observer-dependent semi-automatic approaches.
Goal(s): The objective of this study was to assess the impact of effective image resolution on neural network training for ventricular scar segmentation.
Approach: Convolutional neural networks were trained on magnetic resonance images with constant matrix size and field-of-view but differing resolutions, and tested on a range of resolutions to investigate the effects.
Results: Neural networks trained on a specific resolution indicated a bias of the scar area estimation when employed to lower -or higher-resolution images. Deploying a network trained on multiple resolutions resulted in reduced resolution dependency.
Impact: The effective image resolution, with constant matrix size and field-of-view, should be considered when training a segmentation model to alleviate unwanted bias in the estimation. Training on multiple resolutions has been shown to increase network precision and robustness.
Introduction
Myocardial scar mass derived from cardiovascular magnetic resonance (CMR) late gadolinium enhancement (LGE) imaging is considered the gold standard for non-invasive myocardial viability assessment in the context of acute and chronic myocardial infarction (MI) 1-4. Myocardial scar mass is of prognostic value in patients with ischemic and non-ischemic cardiomyopathies 5-14. Generally, manual segmentation is time-consuming and requires well-trained observers as well as standardized criteria to account for variations in MRI sequences and hardware. In a multi-center study, significant interobserver differences in %LV mass were reported, indicating limited generalization of the classification of scar data 15. Several deep learning approaches to limit human interactions in scar segmentation have been proposed 16.The standard data processing approach for CNN-based segmentation includes resampling or interpolation of image data to obtain training and test data with constant field-of-view (FOV) and matrix size, i.e. constant apparent in-plane resolution, as well as normalized contrast 11,17-20. The imaging point spread function (PSF) depends on various factors, including sequence and reconstruction parameters, as well as post-processing steps before image-domain data is saved as DICOM files for further processing. The objective of the present work was to systematically assess network performance degradation due to a mismatch of point-spread function between training and testing data using a representative U-Net-type network 21.
Methods
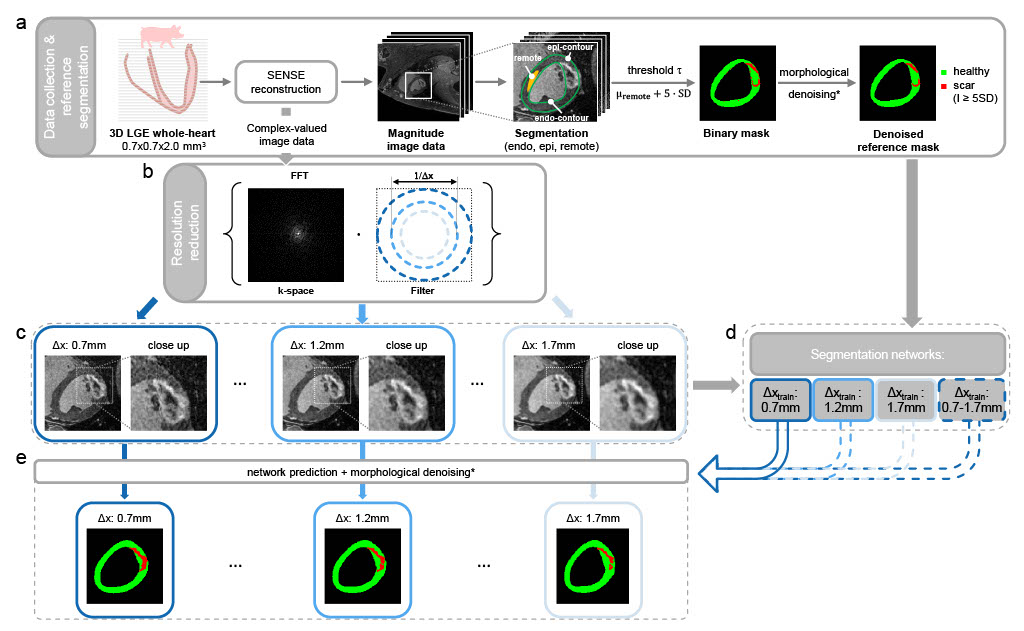
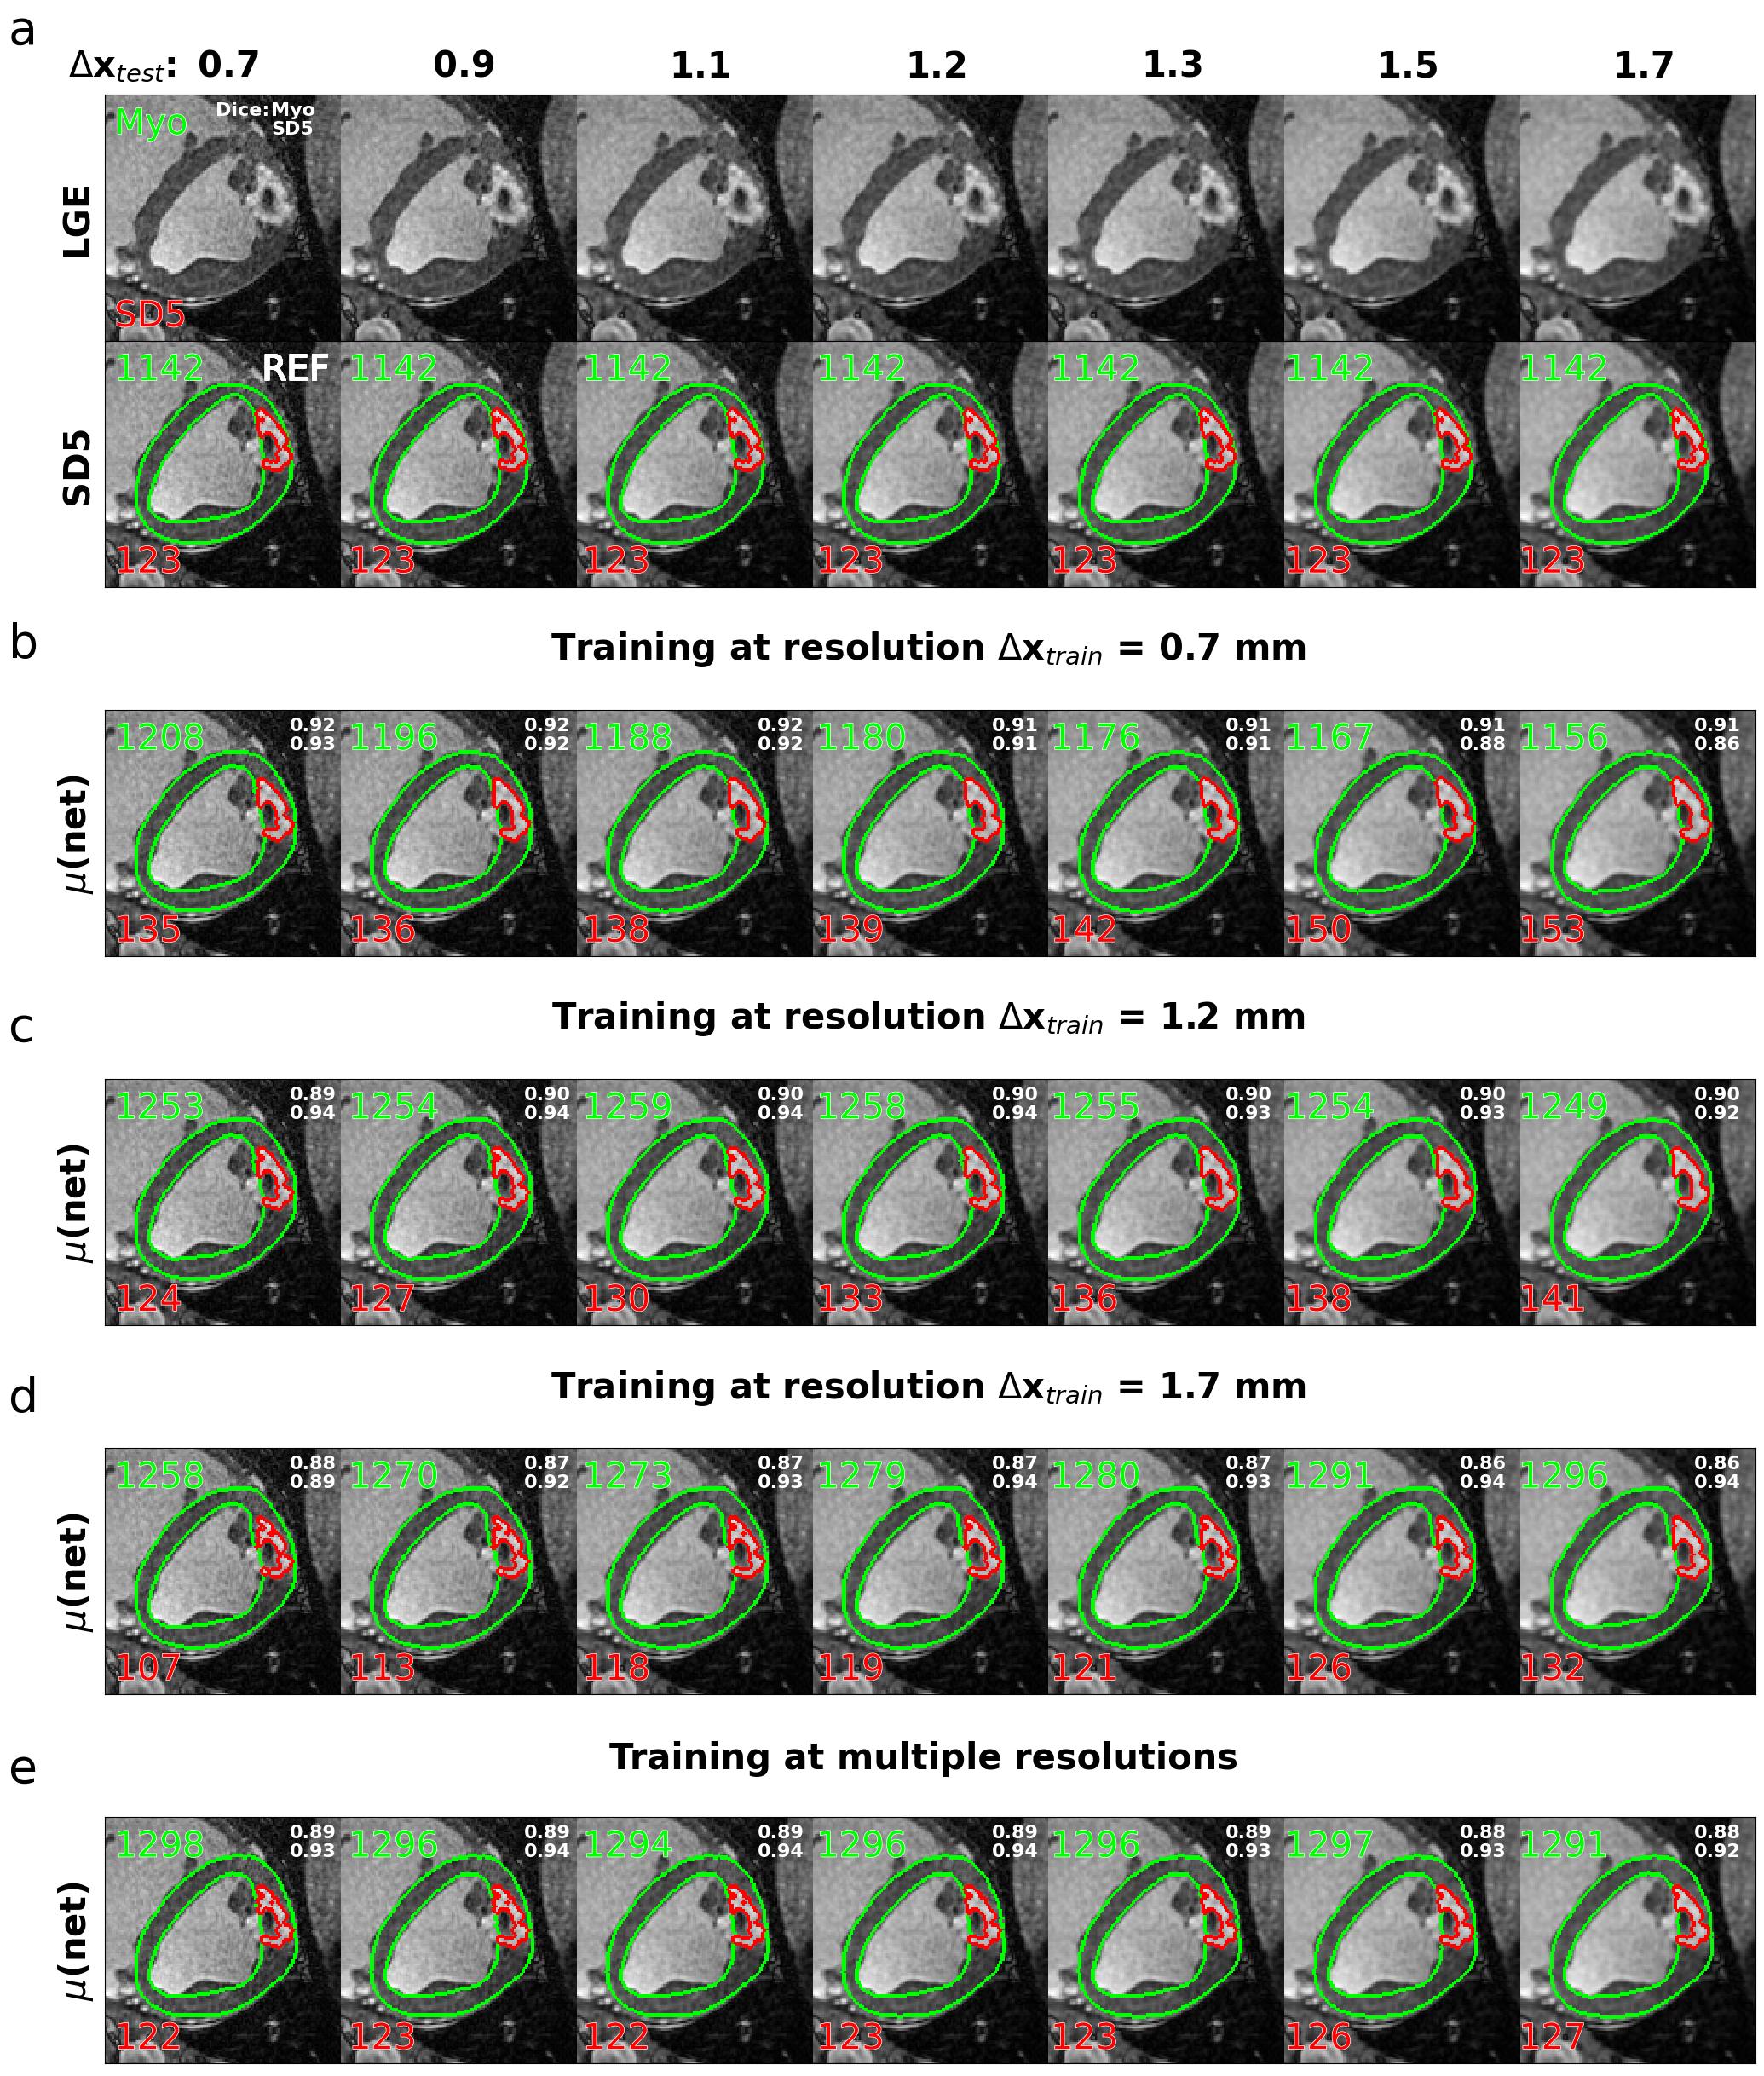
Thirty-six high-resolution (0.7 x 0.7 x 2.0 mm3) LGE k-space datasets were acquired post-mortem in porcine models of myocardial infarction. The in-plane point-spread function and hence in-plane resolution Δx was retrospectively degraded using k-space lowpass filtering, while field-of-view and matrix size were kept constant. Manual segmentation of the left ventricle (LV) and healthy remote myocardium was performed to quantify the location and area (% of myocardium) of scar tissue by thresholding (≥ SD5 above remote). The data processing pipeline is illustrated in Fig. 1.Three standard U-Nets were trained on training resolutions Δxtrain = 0.7, 1.2, and 1.7 mm to predict endo- and epicardial borders of LV myocardium and scar. A five-fold cross-validation scheme was applied to increase the statistical meaning of the reported errors. The scar prediction of the three networks for varying test resolutions (Δxtest = 0.7 to 1.7 mm) was compared against the reference SD5 thresholding at 0.7 mm. Finally, a fourth network trained on a combination of resolutions (Δxtrain = 0.7 to 1.7 mm) was tested. Fig. 2 shows an example case of the network predictions on varying test resolutions.
Results
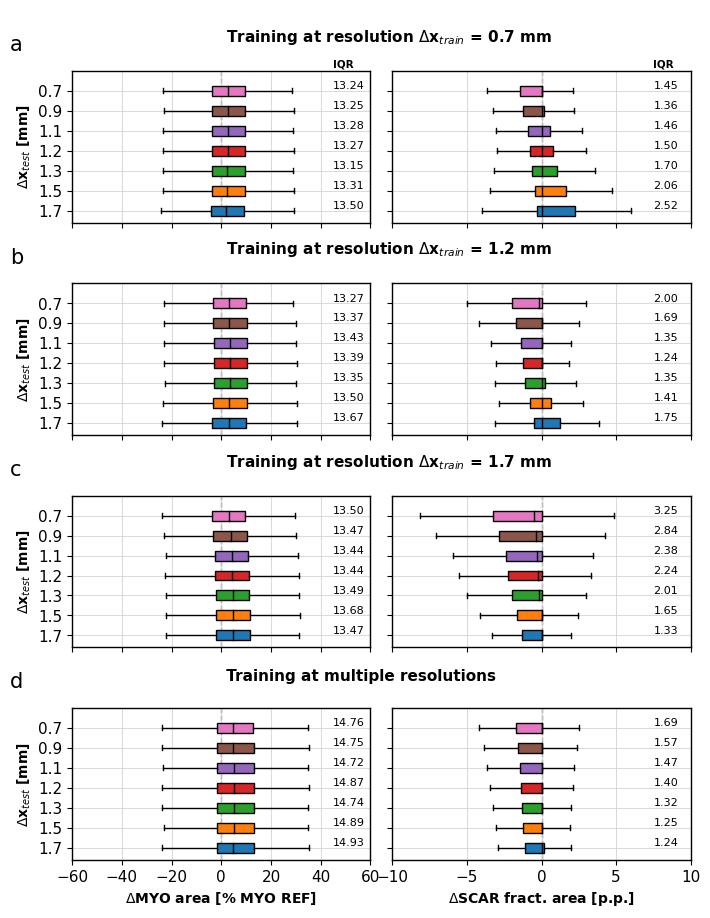
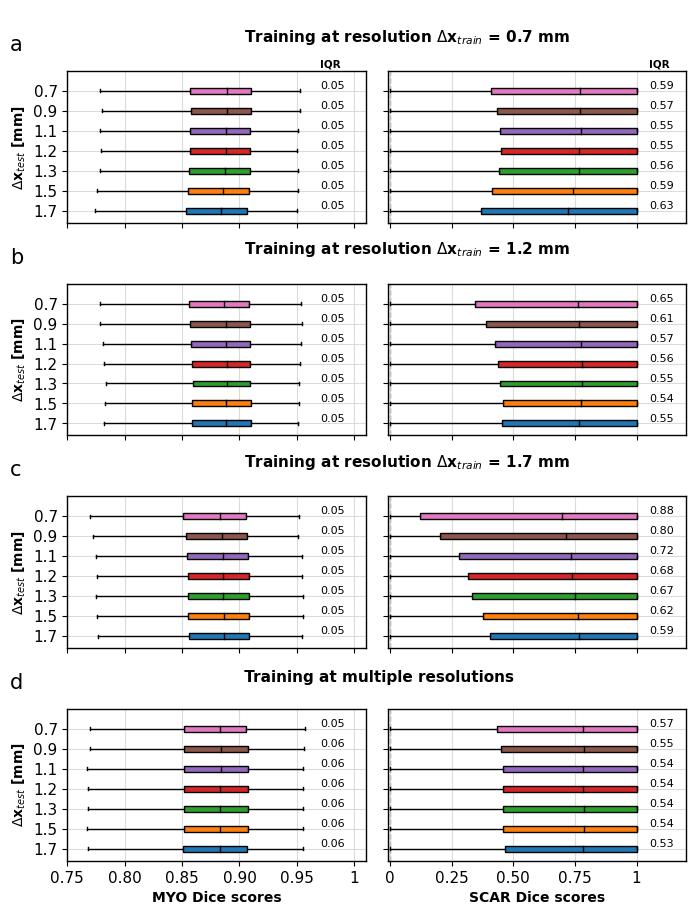
The networks were evaluated based on Dice scores and relative fractional errors of the estimated myocardial and scar areas compared to the reference, given as percentage points (p.p.) and corresponding interquartile ranges (IQR). Fig. 3 shows the results of the fractional errors across all investigated test resolutions, and Fig. 4 shows the distribution of the Dice scores. The median fractional scar errors and precisions (IQR) from networks trained and tested on the same resolution were 0.0p.p. (1.24 - 1.45), and -0.5 - 0.0p.p. (2.00 – 3.25) for networks trained and tested on the most differing resolutions, respectively. Deploying the network trained on multiple resolutions resulted in reduced resolution dependency with median scar errors and IQRs of 0.0p.p. (1.24 – 1.69) for all investigated test resolutions.Discussion
Using a standard U-Net, network-based predictions of relative scar areas showed variability for fractional errors and Dice scores across the investigated test resolutions. All networks underestimated scar areas more often on high-resolution than on low-resolution test images. This is partly explained by the fact that reduced resolution corresponds to a wider PSF, which leads to spatial information being smeared out over neighbouring pixels, i.e., spatial signal variations occur on a larger scale and are smoother.As pointed out by Heiberg et al., n-SD thresholding depends on the signal-to-noise ratio (SNR) in the data 22. Low SNR causes underestimation of the scar area, and high SNR results in overestimation. Given that reference scar masks were derived at the highest available resolution, where the SD5 thresholding is more likely to underestimate the true scar area, the networks trained on low-resolution images learned to segment the scar conservatively.
The PSF-dependent bias and variability demonstrated in our work indicate the importance of considering and reporting acquisition rather than reconstruction resolution as a crucial parameter, as well as SNR, when designing and evaluating scar segmentation networks.
Conclusion
A mismatch of the imaging point-spread function between training and test data can lead to degradation of scar segmentation when using current U-Net architectures, as demonstrated on LGE porcine myocardial infarction data. Training networks on multi-resolution data can alleviate the resolution dependency.Acknowledgements
The authors are grateful for the support and advice on data acquisition, interpretation and curation of Dr. Mareike Cramer, Dr. Conny Waschkies, Dr. Christian Stoeck and Oliver Bludau.References
1. Kellman P, Arai AE. Cardiac imaging techniques for physicians: Late enhancement. J. Magn. Reson. Imaging 2012;36:529–542 doi: 10.1002/JMRI.23605.
2. Puntmann VO, Valbuena S, Hinojar R, et al. Society for Cardiovascular Magnetic Resonance (SCMR) expert consensus for CMR imaging endpoints in clinical research: Part i - Analytical validation and clinical qualification. J. Cardiovasc. Magn. Reson. 2018;20:1–23 doi:10.1186/S12968-018-0484-5.
3. Nijveldt R, Hofman MBM, Hirsch A, et al. Assessment of microvascular obstruction and prediction of short-term remodeling after acute mycoardial infarction: Cardiac MR imaging study. Radiology 2009;250:363–370 doi: 10.1148/radiol.2502080739.
4. Klein C, Schmal TR, Nekolla SG, Schnackenburg B, Fleck E, Nagel E. Mechanism of late gadolinium enhancement in patients with acute myocardial infarction. J. Cardiovasc. Magn.Reson. 2007;9:653–658 doi: 10.1080/10976640601105614.
5. Kwon DH, Asamoto L, Popovic ZB, et al. Infarct characterization and quantification by delayed enhancement cardiac magnetic resonance imaging is a powerful independent and incremental predictor of mortality in patients with advanced ischemic cardiomyopathy. Circ. Cardiovasc.Imaging 2014;7:796–804 doi: 10.1161/CIRCIMAGING.114.002077.
6. Catalano O, Moro G, Perotti M, et al. Late gadolinium enhancement by cardiovascular magnetic resonance is complementary to left ventricle ejection fraction in predicting prognosis of patients with stable coronary artery disease. J. Cardiovasc. Magn. Reson. 2012;14:29 doi:10.1186/1532-429X-14-29.
7. Abbasi SA, Ertel A, Shah R V., et al. Impact of cardiovascular magnetic resonance on management and clinical decision-making in heart failure patients. J. Cardiovasc. Magn. Reson.2013;15 doi: 10.1186/1532-429X-15-89.
8. Pi SH, Kim SM, Choi JO, et al. Prognostic value of myocardial strain and late gadolinium enhancement on cardiovascular magnetic resonance imaging in patients with idiopathic dilated cardiomyopathy with moderate to severely reduced ejection fraction. J. Cardiovasc. Magn.Reson. 2018;20 doi: 10.1186/s12968-018-0466-7.
9. Chan RH, Maron BJ, Olivotto I, et al. Prognostic value of quantitative contrast-enhanced cardiovascular magnetic resonance for the evaluation of sudden death risk in patients with hypertrophic cardiomyopathy. Circulation 2014;130:484–495 doi:10.1161/CIRCULATIONAHA.113.007094.
10. Beek AM, Bondarenko O, Afsharzada F, Van Rossum AC. Quantification of late gadolinium enhanced CMR in viability assessment in chronic ischemic heart disease: A comparison to functional outcome. J. Cardiovasc. Magn. Reson. 2009;11:1–7 doi: 10.1186/1532-429X-11-6.
11. Fahmy AS, Neisius U, Chan RH, et al. Three-dimensional deep convolutional neural networks for automated myocardial scar quantification in hypertrophic cardiomyopathy: A multicenter multivendor study. Radiology 2020;294:52–60 doi: 10.1148/radiol.2019190737.
12. Spiewak M, Malek LA, Misko J, et al. Comparison of different quantification methods of late gadolinium enhancement in patients with hypertrophic cardiomyopathy. Eur. J. Radiol. 2010;74doi: 10.1016/J.EJRAD.2009.05.035.
13. Liu D, Ma X, Liu J, et al. Quantitative analysis of late gadolinium enhancement in hypertrophic cardiomyopathy: comparison of diagnostic performance in myocardial fibrosis between gadobutrol and gadopentetate dimeglumine. Int. J. Cardiovasc. Imaging 2017;33:1191–1200 doi: 10.1007/s10554-017-1101-7.
14. Mikami Y, Kolman L, Joncas SX, et al. Accuracy and reproducibility of semi-automated late gadolinium enhancement quantification techniques in patients with hypertrophic cardiomyopathy. J. Cardiovasc. Magn. Reson. 2014;16 doi: 10.1186/s12968-014-0085-x.
15. Klem I, Heiberg E, Van Assche L, et al. Sources of variability in quantification of cardiovascular magnetic resonance infarct size - reproducibility among three core laboratories.J. Cardiovasc. Magn. Reson. 2017;19:62 doi: 10.1186/s12968-017-0378-y.
16. Wu Y, Tang Z, Li B, Firmin D, Yang G. Recent Advances in Fibrosis and Scar Segmentation From Cardiac MRI: A State-of-the-Art Review and Future Perspectives. Front. Physiol.2021;12:709230 doi: 10.3389/FPHYS.2021.709230.
17. Fahmy AS, Rowin EJ, Chan RH, Manning WJ, Maron MS, Nezafat R. Improved Quantification of Myocardium Scar in Late Gadolinium Enhancement Images: Deep Learning Based Image Fusion Approach. J. Magn. Reson. Imaging 2021;54:303–312 doi: 10.1002/JMRI.27555.
18. Moccia S, Banali R, Martini C, et al. Development and testing of a deep learning-based strategy for scar segmentation on CMR-LGE images. Magn. Reson. Mater. Physics, Biol. Med.2019;32:187–195 doi: 10.1007/s10334-018-0718-4.
19. Brahim K, Arega TW, Boucher A, Bricq S, Sakly A, Meriaudeau F. An Improved 3D Deep Learning-Based Segmentation of Left Ventricular Myocardial Diseases from Delayed-Enhancement MRI with Inclusion and Classification Prior Information U-Net (ICPIU-Net). Sensors2022;22:2084 doi: 10.3390/S22062084.
20. Popescu DM, Abramson HG, Yu R, et al. Anatomically informed deep learning on contrast-enhanced cardiac magnetic resonance imaging for scar segmentation and clinical featureextraction. Cardiovasc. Digit. Heal. J. 2022;3:2–13 doi: 10.1016/J.CVDHJ.2021.11.007.
21. Ghanbari F, Joyce T, Lorenzoni V, et al. AI Cardiac MRI Scar Analysis Aids Prediction of Major Arrhythmic Events in the Multicenter DERIVATE Registry. Radiology 2023;307 doi:10.1148/RADIOL.222239/ASSET/IMAGES/LARGE/RADIOL.222239.FIG6.JPEG.
22. Heiberg E, Engblom H, Carlsson M, et al. Infarct quantification with cardiovascular magnetic resonance using “standard deviation from remote” is unreliable: validation in multi-centre multi-vendor data. J. Cardiovasc. Magn. Reson. 2022;24:1–12 doi: 10.1186/S12968-022-00888-8/.
Figures