3771
Identification of Glioblastoma Infiltrative Areas in Peritumoral Edema Based on Expert Interaction Framework1Radiology, Huashan Hospital, Fudan University, Shanghai, China, 2School of Computer Science and Technology, East China Normal University, Shanghai, China, 3Pathology, Huashan Hospital, Fudan University, Shanghai, China, 4School of Software Engineering, Tongji University, Shanghai, China, 5Neurosurgery, Huashan Hospital, Fudan University, Shanghai, China
Synopsis
Keywords: Diagnosis/Prediction, Brain
Motivation: Infiltration and recurrence of glioblastoma is typically fatal. Conventional imaging techniques are insufficient for identifying the infiltrated regions.
Goal(s): We aim to develop an interactive visualization method based on conventional MRI to identify the peri-tumor infiltration.
Approach: Glioblastoma infiltrating area detection interactive framework (GIADIF) consists of two steps: delineating peritumoral edema and extracting the voxels with low fractional anisotropy value as user-interactive input; using the P-Net from the DeepIGeoS framework to output the infiltrated maps, and validating in a prospective cohort.
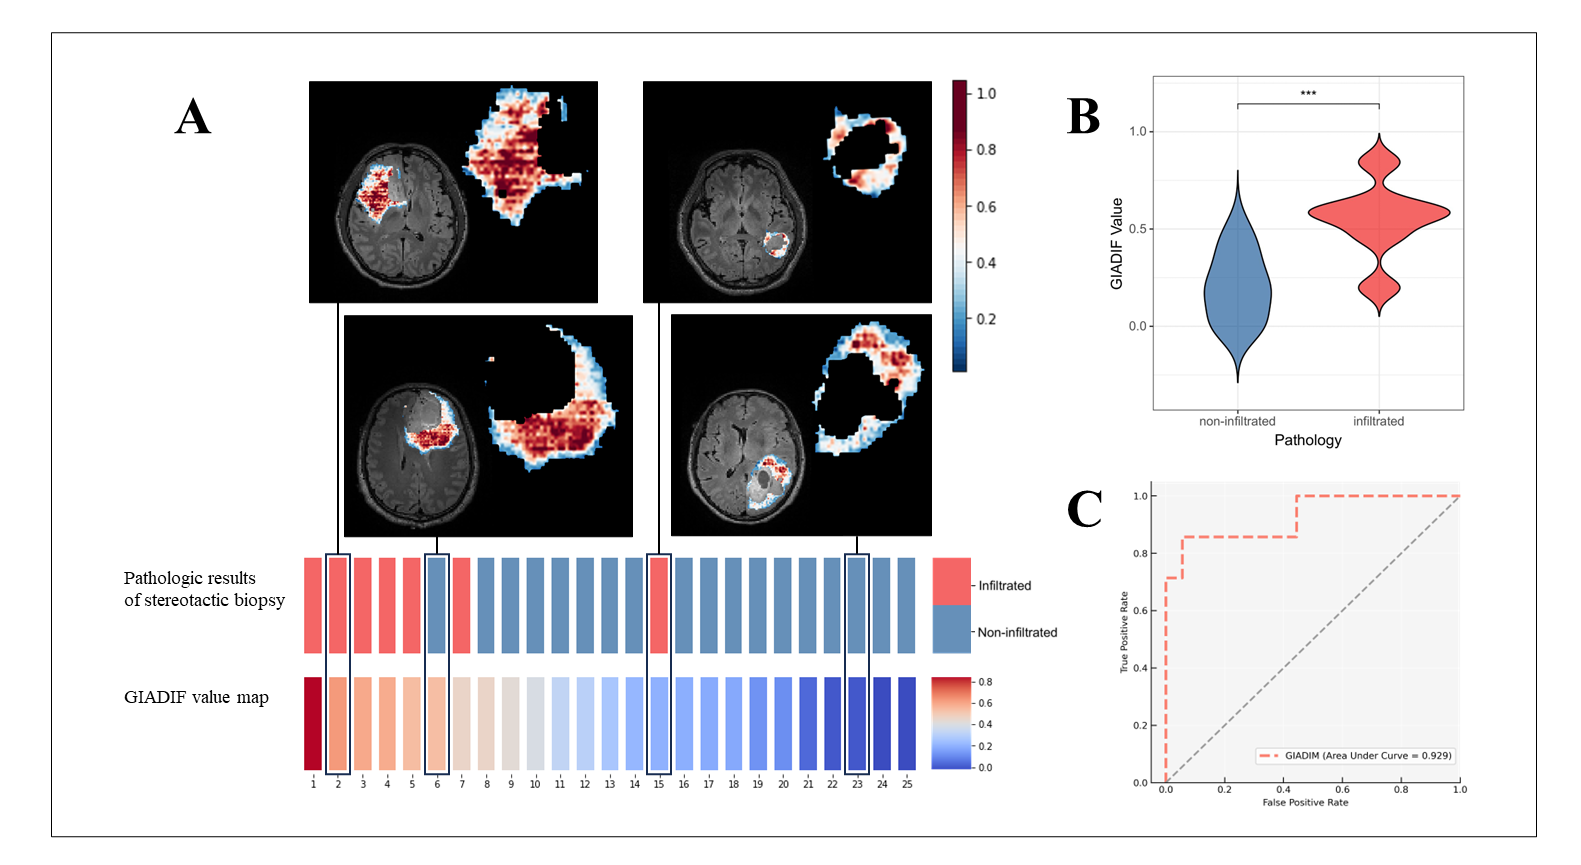
Results: GIADIF showed reliable performance in identifying GBM-infiltrated regions (area under the receiver operating characteristic curve: 0.929 [95% CI 0.804–1.000]).
Impact: GIADIF utilizes the interactive information to the conventional MRI sequences to locate areas of GBM infiltration. Its excellent performance allows for the prompt and precise selection sites for surgery and radiotherapy.
Background and Purpose
Most Glioblastoma (GBM) patients die from uncontrolled tumor spread and progression[1,2]. It is widely accepted that GBM infiltration and recurrence frequently take place in the peritumoral edema regions (peri-ED)[3–5]. However, detecting the boundaries of GBM's tumor cell infiltration in peri-ED using conventional magnetic resonance images poses a significant challenge for radiologists. In this study, we aimed to develop an interactive machine learning algorithm (GIADIF; Glioblastoma Infiltrating Area Detection Interactive Framework) for the semi-automatically detect GBM tumor infiltrating areas, and validate the accuracy of GIADM by point-to-point stereotactic biopsy in 13 patients.Methods
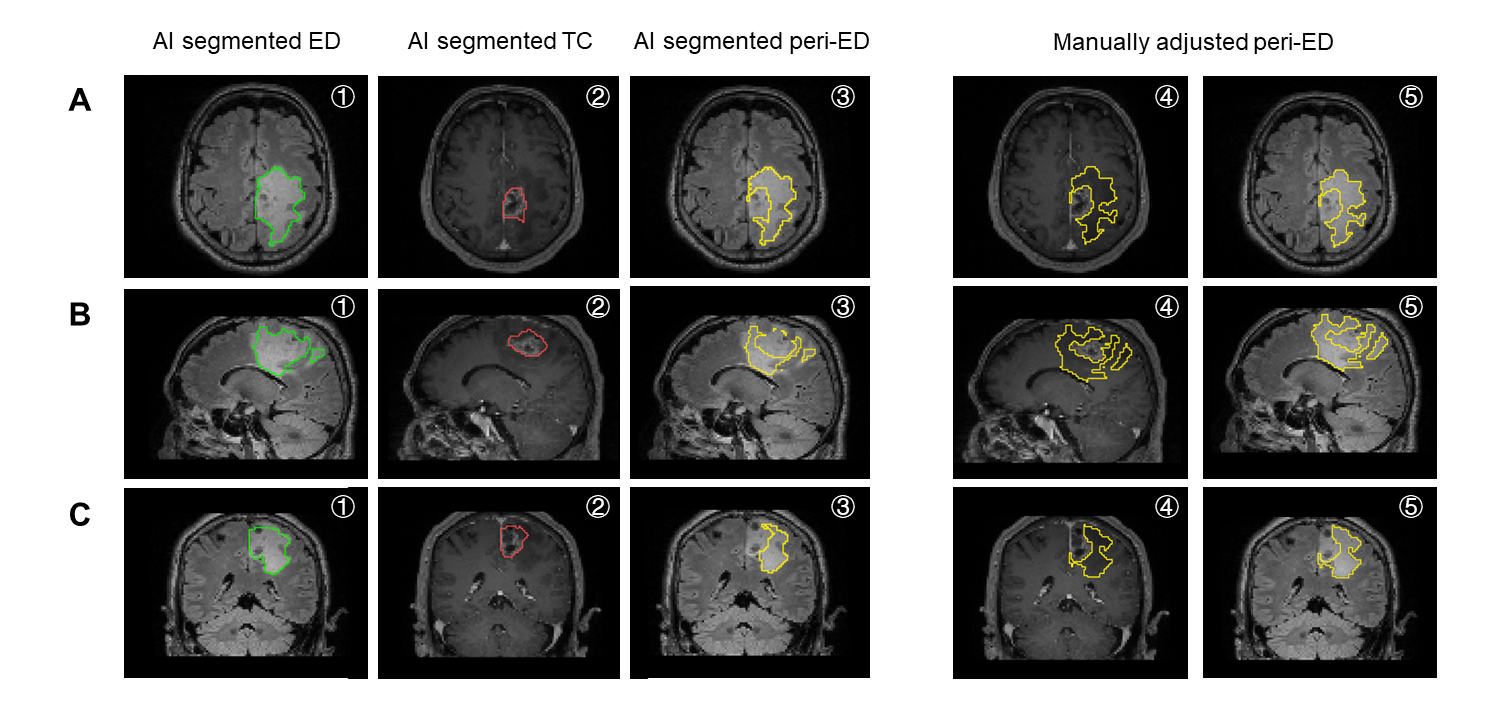
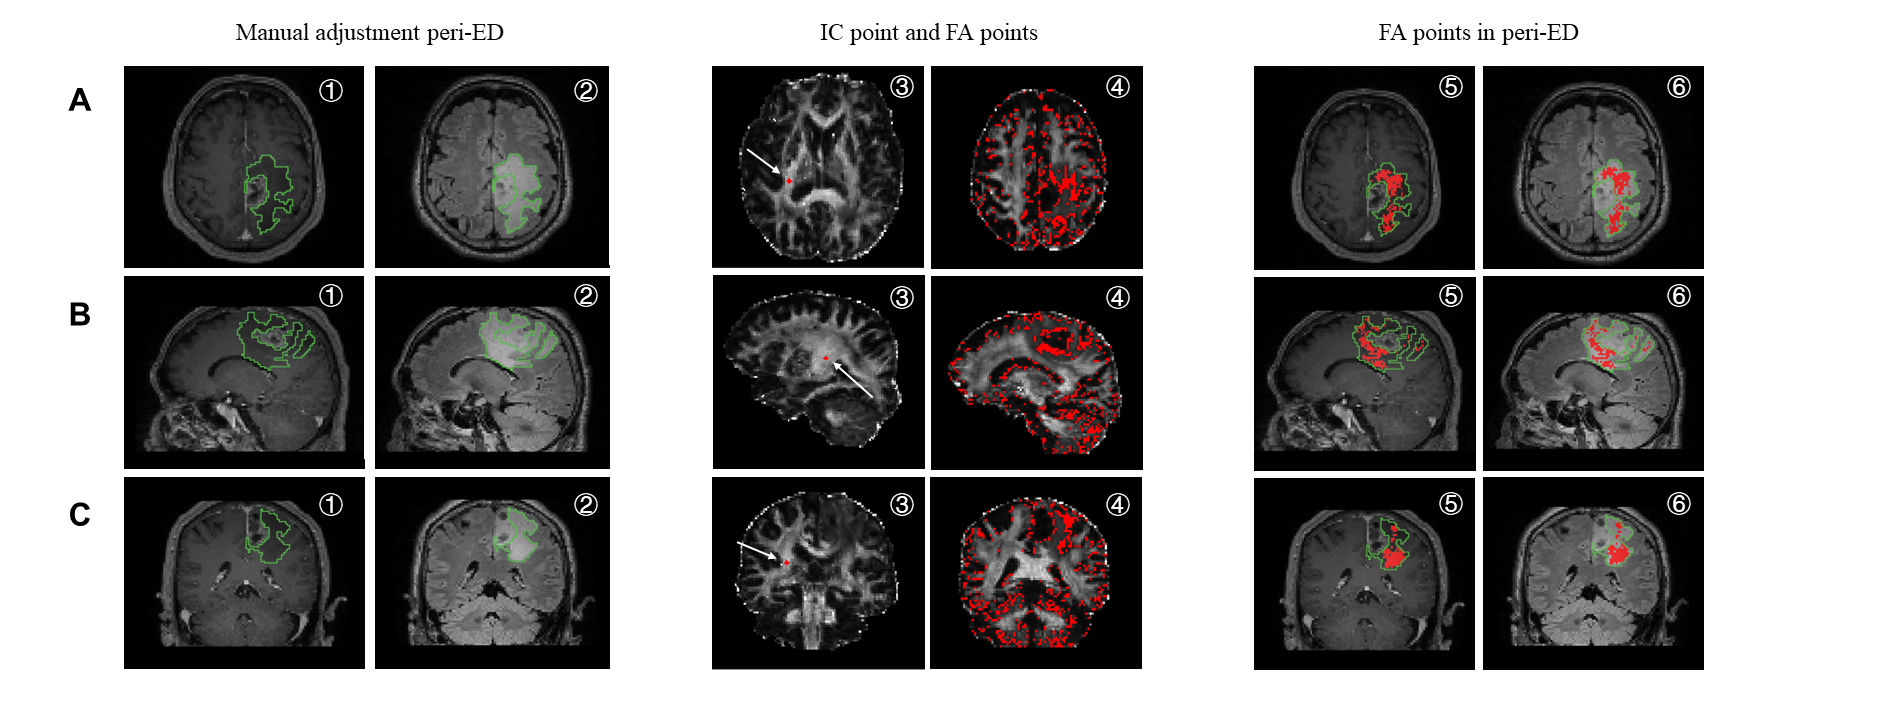
Patients The patients consist of two parts, the retrospective and prospective part. In the retrospective part underwent preoperative MR imaging with three-dimensional T2-weighted fluid-attenuated inversion recovery (T2-FLAIR), three-dimensional contrast-enhanced T1-weighted sequences (CE-T1, magnetization-prepared rapid gradient echo), and diffusion tensor imaging (DTI). We performed preoperative, intraoperative and postoperative T2-FLAIR and CE-T1 in the prospective cohort. Preprocessing and Image Analysis We use a well-established preprocessing pipeline, including eddy correction, skull removal, and FA calculation, to generate fractional anisotropy (FA) maps based on DTI. The T2-FLAIR and CE-T1 images of all patients were performed skull stripping only. Finally, we registered CE-T1 and/or FA maps to the T2-FLAIR images using the nearest neighbor hair interpolation method. We first placed circular ROIs (diameter, 5–10 mm) were in a region with homogeneous FA values, preferably in white matter, excluding major fiber tracts (ie, internal capsule). Then, used the same method, FA in the Crus posterior to the contralateral internal capsule was measured. Finally, we calculate the ratio of FA in the peri-ED to the internal capsule (FAint). We carried out the implementation process according to Bette et al. study[6], A simple representation is shown in Figure 2. After careful consideration, we determined voxels with FA between 0.16 and 0.22 are most likely to be areas of GBM infiltration, and consider them as the experience of professional radiologists. Image labelling and GIADIF development The GIADIF method adapts the MECCA framework[7], which uses the interactive clicks of professional radiologists to help refine the target area's segmentation. In addition, GIADIF consists of two steps for medical image segmentation. The first step outlines the peri-ED region (Figure 1), while the second step outlines the infiltration region (Figure 3A). Both steps utilize a similar segmentation network, with the P-Net from the DeepIGeoS framework[8] as the backbone. These two steps have distinct inputs. The initial step requires no user interaction and takes as input the CE-T1 and T2-FLAIR images, along with the randomly initialized segmentation results. By contrast, the ensuing step necessitates the use of voxels within a certain FAint value range as experience of professional radiologists along with an additional input. All inputs are collected through different channels. GIADIF Evaluation and statistical analysis We prospectively obtained a validation cohort of 13 specimens. These specimens provided pathological information on multiple points within the peri-ED. A point-to-point matching of the pathologic puncture sites to the MR images was possible with the Huashan Hospital Biopsy Matching System. In this prospective cohort, stereotactic biopsies were performed at two separate points. The pathology results obtained from the stereotactic biopsy were used as the gold standard for determining whether or not tumor infiltration was present. Receiver operating characteristic (ROC) curves and area under the ROC curve (AUC) were used to evaluate the performance of GIADIF for detecting GBM tumor infiltrating task. The independent t-test was used to assess the GIADIF value of the infiltrated and non-infiltrated groups. The segmentation network features two output components: a policy component and a value component, which are commonly employed in the A3C algorithm[9].Results
The GIADIF values in the test set were 0.549±0.194 in the GBM infiltrating group and 0.205±0.175 in the GBM non-infiltrating group, and the distributions of these two groups were statistically different, with the infiltrating group having higher GIADIF values (p<0.001), as shown in Figure 3B. GIADIF showed good diagnostic performance with an AUC of 0.929 [95% CI 0.804–1.000] (Figure 3C). Moreover, GIADIF can form GIADIF heatmaps based on the GIADIF value provided for each slice in the patient's FLAIR and CE-T1 scans. Figure 3A shows the GIADIF heatmap of 4 typical sample in the validation cohort. The GIADIF heatmap shows the results of the GIADIF judgment for each voxel in the peri-ED region.Conclusion
GIADIF is a clinically applicable AI system that capable of detecting high-risk areas of GBM infiltration within areas of peri-ED. The accuracy and generalization ability of GIADIF demonstrates its potential for clinical use.Acknowledgements
No acknowledgement found.References
[1] LAMBA N, CHUKWUEKE U N, SMITH T R, et al. Socioeconomic Disparities Associated With MGMT Promoter Methylation Testing for Patients With Glioblastoma[J/OL]. JAMA oncology, 2020, 6(12): 1972-1974. DOI:10.1001/jamaoncol.2020.4937.
[2] SCHAFF L R, MELLINGHOFF I K. Glioblastoma and Other Primary Brain Malignancies in Adults: A Review[J/OL]. JAMA, 2023, 329(7): 574. DOI:10.1001/jama.2023.0023.
[3] LONG H, ZHANG P, BI Y, et al. MRI radiomic features of peritumoral edema may predict the recurrence sites of glioblastoma multiforme[J/OL]. Frontiers in Oncology, 2023, 12: 1042498. DOI:10.3389/fonc.2022.1042498.
[4] JOHNSON P C, HUNT S J, DRAYER B P. Human cerebral gliomas: correlation of postmortem MR imaging and neuropathologic findings[J/OL]. Radiology, 1989, 170(1 Pt 1): 211-217. DOI:10.1148/radiology.170.1.2535765.
[5] PETRECCA K, GUIOT M C, PANET-RAYMOND V, et al. Failure pattern following complete resection plus radiotherapy and temozolomide is at the resection margin in patients with glioblastoma[J/OL]. Journal of Neuro-Oncology, 2013, 111(1): 19-23. DOI:10.1007/s11060-012-0983-4.
[6] BETTE S, HUBER T, GEMPT J, et al. Local Fractional Anisotropy Is Reduced in Areas with Tumor Recurrence in Glioblastoma[J/OL]. Radiology, 2017, 283(2): 499-507. DOI:10.1148/radiol.2016152832.
[7] SHEN C, LI W, XU Q, et al. Interactive medical image segmentation with self-adaptive confidence calibration[J/OL]. Frontiers of Information Technology & Electronic Engineering, 2023, 24(9): 1332-1348. DOI:10.1631/FITEE.2200299.
[8] WANG G, ZULUAGA M A, LI W, et al. DeepIGeoS: A Deep Interactive Geodesic Framework for Medical Image Segmentation[J/OL]. IEEE Transactions on Pattern Analysis and Machine Intelligence, 2019, 41(7): 1559-1572. DOI:10.1109/TPAMI.2018.2840695.
[9] MNIH V, BADIA A P, MIRZA M, et al. Asynchronous methods for deep reinforcement learning[C]//Proceedings of the 33rd International Conference on International Conference on Machine Learning - Volume 48. New York, NY, USA: JMLR.org, 2016: 1928-1937[2023-11-03].
Figures