3766
Assessing the Diagnostic Potential of Synthetic MRI for Hypogonadotropic Hypogonadism in Thalassemia Patients1Department of Radiology, The First Affiliated Hospital of Guangxi Medical University, Nanning, China, 2GE Healthcare, MR Research China, Beijing, China
Synopsis
Keywords: Hematology, Oncology, Quantitative Imaging, thalassemia; hypogonadotropic hypogonadism; synthetic MRI
Motivation: Pituitary T1 values and pituitary height have potential as predictive markers for hypogonadotropic hypogonadism (HH) in thalassemia major (TM) patients, yet their assessment typically needs multiple MRI scans.
Goal(s): Assess the diagnostic potential of Synthetic MRI in detection of HH, with the advantage of obtaining the required MR measurements through a single scan.
Approach: Pituitary T1, T2 and pituitary height were measured in 112 TM patients using SyMRI technique.
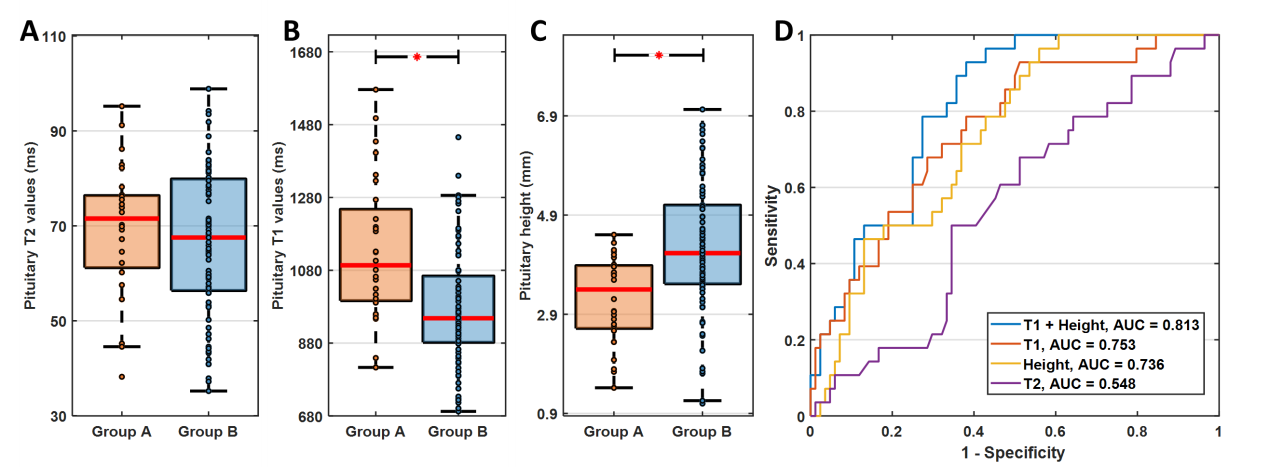
Results: The AUC values for diagnosing HH with pituitary T1 values and pituitary height were 0.736 and 0.753, respectively, and the AUC value of combining these two measurements was 0.813.
Impact: Synthetic MRI technology facilitates the diagnosis of hypogonadotropic hypogonadism in TM patients, and the combination of pituitary T1 values and pituitary height yields high diagnostic accuracy for hypogonadotropic hypogonadism in TM patient.
Introduction
Thalassemia major (TM) is the most common hereditary hemolytic anemia in southern China. Besides the persistent anemia and hypoxia, hypogonadism is the frequency endocrine complication and affects 70%–80% of TM patients. Previous studies found the T2* and T2 relaxation time of pituitary, as well as the height of pituitary measured in T1-weighted (T1w) images, could predict hypogonadotropic hypogonadism (HH) in TM patients1, 2. Nevertheless, multiple MRI scans are required to acquire these measurements. In a previous study, an innovative technique called Synthetic MRI (SyMRI) was introduced. This method can acquire T1, T2, and PD maps in a single scan, and with the aid of these quantitative values, it becomes possible to synthesize multiple image contrasts, including T1-weighted images. Thus, this study employs SyMRI to evaluate the relationship between gonadotropin levels and alterations of pituitary T1 values, T2 values, and pituitary height in patients with TM, exploring the diagnostic potential of synthetic MRI in HH.Methods
A total of 112 patients with TM, who underwent follicle-stimulating hormone (FSH) and luteinizing hormone (LH) tests, recruited from First Affiliated Hospital of Guangxi Medical University. Among them, 28 patients (Group A) experienced HH, while other 84 patients (Group B) did not (detailed information was showed in Table 1). This study received approval from the local ethics committee, and all participants duly signed informed consent forms prior to their involvement in the study.MRI data were acquired using a 3.0T scanner (SIGNA Premier GE Healthcare, WI, USA) with 32-channel head coils. A 2D multiple-dynamic multiple-echo (MDME) sequence was employed to capture images for the SyMRI technique3. The significant parameters of the MDME sequence include an in-plane voxel size of 2.0 mm × 2.0 mm, a slice thickness of 2 mm without any gap, and the acquisition of 20 slices in the sagittal plane.
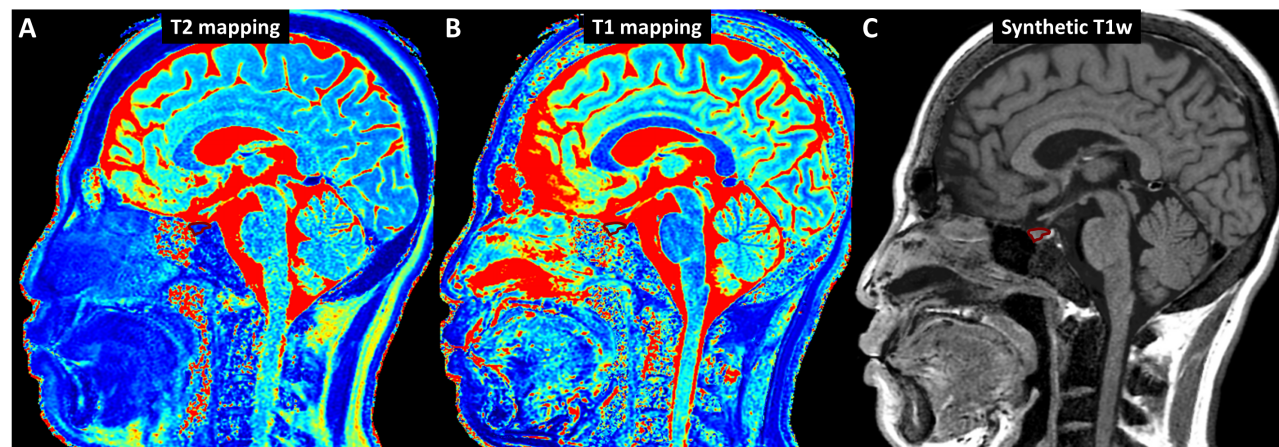
T1 mapping, T2 mapping and synthetic T1w images were calculated using the vendor-provided postprocessing software (SyntheticMR, v11.2.2). Since these images were acquired in a single scan and they were inherently aligned, the region of interest (ROI) was only delineated on the T1w images. In the T1w images, the slice exhibiting largest cross-section of the pituitary was selected to measure the height of the pituitary. On this slice, the pituitary region of interest (ROI) is delineated to calculate the average T1 and T2 values within the ROI (Fig. 1). To ensure the reliability of the delineation, an experienced radiologist performs the delineation three times with each 2-3 days apart for the same patient. The average of the T1 and T2 values and the pituitary height obtained from the three delineations were taken as the final measurements. Pituitary T1 and T2 values, along with pituitary height, were compared between TM patients with hypogonadotropic levels and those with normal-gonadotropic levels. Additionally, a receiver operating characteristic (ROC) curve analysis was performed to differentiate between the two TM patient groups using the aforementioned MRI measurements.
Results
The differences in pituitary T1 values, T2 values, pituitary height and serum ferritin (SF) between hypogonadotropic group (Group A) and normal-gonadotropic group (Group B) were showed in Table 2 and Fig. 2. Compared with Group B, Group A showed a decrease in pituitary height (P < 0.05), and an increase in pituitary T1 values (P < 0.05). There were no statistical differences between the two groups in pituitary T2 values. The areas under the curve (AUC) for predicting HH in TM patients using pituitary T1 values, pituitary height, and a combination of pituitary T1 values and height were 0.753 (P < 0.001), 0.736 (P < 0.001), and 0.813 (P < 0.001), respectively (Fig. 2D).Discussion
In this study, we employed SyMRI technology and observed increased pituitary T1 values and decreased pituitary height in hypogonadotropic TM patients, indicating pituitary cell necrosis and fibrosis in the hypogonadotropic group4. However, serum ferritin and pituitary T2 values, which are potential markers of pituitary iron deposition, did not differ significantly between two groups. It suggests that the TM patients with HH have irreversible pituitary secretory damage even with effective chelation therapy5. Furthermore, the best diagnostic performance for predicting HH in TM patients was achieved by combining pituitary T1 values and pituitary height, demonstrating that SyMRI technology has diagnostic potential for HH.Conclusion
Synthetic MRI technology aids in the diagnosis of hypogonadotropic hypogonadism in patients with TM, and the combination of pituitary T1 values and pituitary height provides good diagnostic efficiency for hypogonadotropic hypogonadism in patients with TM.Acknowledgements
No acknowledgement found.References
1. Bozdağ M, Bayraktaroğlu S, Aydınok Y, et al. MRI assessment of pituitary iron accumulation by using pituitary-R2 in β-thalassemia patients. Acta Radiologica, 2018, 59(6): 732-739.
2. Morad L M, EL-Shanshory M R, Hablas N M, et al. Magnetic Resonance Imaging Versus Serum Iron Status as Diagnostic Tools for Pituitary Iron Overload in Children with Beta Thalassemia. Journal of Advances in Medicine and Medical Research, 2021: 97-109.
3. Warntjes J B M, Leinhard O D, West J, et al. Rapid magnetic resonance quantification on the brain: optimization for clinical usage. Magnetic Resonance in Medicine: An Official Journal of the International Society for Magnetic Resonance in Medicine, 2008, 60(2): 320-329.
4. Taylor AJ, Salerno M, Jerosch-Herold M,et al. T1 Mapping: Basic Techniques and Clinical Applications. JACC Cardiovasc Imaging. 2016; 9(1):67-81.
5. Singer S T T, Fischer R, Yuan Q, et al. Pituitary Iron: Effect on Pituitary Volume and Function in Transfusion Dependent Thalassemia. Blood, 2017, 130(Supplement 1): 3502-3502.
Figures