3765
Investigating Myelin Abnormalities in Major Depressive Disorder: Insights from Synthetic Magnetic Resonance Imaging1Department of Medical Imaging, Nanfang Hospital, Guangzhou, China, 2MR Research China, GE Healthcare, Beijing, China
Synopsis
Keywords: Quantitative Imaging, Quantitative Imaging, Major depressive disorder; synthetic MRI; myelin
Motivation: Major depressive disorder is a common mental illness with biological processes, such as myelin alterations, that are not yet fully understood.
Goal(s): This study aims to explore myelin abnormalities in MDD patients utilizing Synthetic MRI (SyMRI) technique.
Approach: Myelin content measured by SyMRI was compared between 32 MDD patients and 51 healthy controls, and the study further investigated the relationship between myelin alterations and the depressive symptoms.
Results: Several white matter regions exhibited a significant decrease in myelin content in individuals with MDD, and a correlation was found between the depressive symptoms and these myelin deficits.
Impact: The present study highlights the potential of Synthetic MRI technique as a valuable tool for measuring myelin content, which could play a crucial role in understanding the underlying neurobiological mechanisms of Major Depressive Disorder.
Background
Major depressive disorder is a common mental illness that affects mood and cognition1. Considering that myelin is the protective layer around nerve fibers that enables fast and efficient signal transmission2, its abnormalities may be associated condition of MDD. Previous studies have reported reduced myelin and oligodendrocytes (cells that produce myelin) in depressed individuals, suggesting demyelination as a possible cause or consequence of MDD2. More recently, studies utilize the T1w/T2w ratio to reflects myelin content3. However, mapping myelination in the aforementioned studies required complex data acquisition or analysis methods, which presents a challenge in routine MRI scans. Synthetic MRI (SyMRI) is a novel technique that can map myelin content in a single scan with short acquisition time4. Therefore, this study aims to compare myelin content between individuals with MDD and healthy controls by SyMRI, and examined the association between altered brain regions and clinical symptoms.Methods
Thirty-two patients with MDD and 51 healthy control (HC) subjects were recruited from Nanfang Hospital (Table 1). The Hamilton Depression Rating Scale (HAMD) and the Hamilton Anxiety Scale (HAMA) were assessed for each MDD patient. This study was approved by the local ethics committee and all participants singed informed consent forms prior the study.MRI data were acquired using a 3.0T SIGNA Architect scanner (GE Healthcare, WI, USA) equipped with 48-channel head coils. T1-weighted (T1w) images in the 1.00mm-isotropic resolution were obtained for each participant. Quantitative MRI parameters were gathered using the SyMRI technique, relying on an axial two-dimensional multiple-dynamic multiple-echo (MDME) sequence. The primary parameters for the MDME sequence included an in-plane resolution of 2.0mm×2.0mm; and a slice thickness of 2mm with no gap.
The postprocessing software (SyntheticMR, v11.2.2) was utilized to generate myelin content mapping (MYC) images and synthetic T1w images. The comparisons of MYC between MDD and HC group was based on a voxel-based analysis method as follow: (1) Bias fields in anatomical T1w images and synthetic T1w images were corrected using the Advanced Normalization Tools (ANTs). (2) The rigid transformation matrix between anatomical T1w and synthetic T1w images were calculated using ANTs. (3) Skull of anatomical T1w images were stripped and nonlinearly warped to Montreal Neurological Institute (MNI) space using ANTs-SyN algorithm. (4) The linear transformations and nonlinear warped images were then applied to convert MYC images into the MNI space. (5) These MYC images were then masked with a MNI white matter (WM) mask and smoothed with an isotropic Gaussian kernel (3-mm FWHM). (6) A general linear model (GLM) was employed to identify voxel-based differences in MYC within WM, accounting for age and gender as covariates. The correction of multiple comparisons was performed using an initial uncorrected p-value threshold of < 0.005, followed by cluster-level correction using family-wise error correction (p<0.05). Finally, MYC values from each independent cluster in the group difference maps were extracted, and the Pearson correlation analysis between these values and clinical symptoms was performed.
Results
Group difference in myelin values between MDD and HC group were showed in Table2 and Figure1. The relationship between HAMD or HAMA scores and myelin values in clusters demonstrating significant differences is shown in Figure2. Correlation analysis revealed negative correlations between the HAMD score and myelin content values in cluster 3 (r = -0.33, p = 0.030) (A), as well as cluster 4 (r = -0.31, p = 0.041) (B). Similarly, negative correlations were found between the HAMA score and myelin content values in cluster 2 (r = -0.35, p = 0.024) (C), cluster 4 (r = -0.41, p = 0.008) (D), and cluster 5 (r = -0.31, p = 0.040) (E).Discussion
In this study, the SyMRI technique was employed to detect WM myelin abnormalities caused by MDD. The patients with MDD showed a significantly reduced myelin content, and these myelin alterations were associated with symptoms of depression or anxiety. Previous research found that mice demonstrated demyelination, synaptic deficits, and depression-like behaviors after chronic stress or inflammation, and remyelination could led to improved synaptic function and behaviors5. It indicated the potential role of myelin in the pathophysiology of MDD. Therefore, the SyMRI technique, which could identify myelin irregularities and their connection to clinical symptoms, offers valuable insights into the biological mechanisms underlying of MDD.Conclusion
Our results suggested that MDD patients exhibit reduced myelin content, which correlates with the severity of depressive or anxiety symptoms. This points to the SyMRI technique as a promising method for evaluating the neurobiological state in depression.Acknowledgements
This study was supported by the National Natural Science Foundation of China grant 82172012.References
1.Marx, W. et al. Major depressive disorder. Nat Rev Dis Primers 9, 44 (2023).
2.Boda, E. Myelin and oligodendrocyte lineage cell dysfunctions: New players in the etiology and treatment of depression and stress-related disorders. Eur J Neurosci 53, 281–297 (2021).
3.Zhang, S. et al. Altered cortical myelin in the salience and default mode networks in major depressive disorder patients: A surface-based analysis. Journal of Affective Disorders 340, 113–119 (2023).
4.Warntjes, J. b. m., Leinhard, O. D., West, J. & Lundberg, P. Rapid magnetic resonance quantification on the brain: Optimization for clinical usage. Magnetic Resonance in Medicine 60, 320–329 (2008).
5.Li, Y. et al. The Eph receptor A4 plays a role in demyelination and depression-related behavior. J Clin Invest 132, e152187 (2022).
Figures
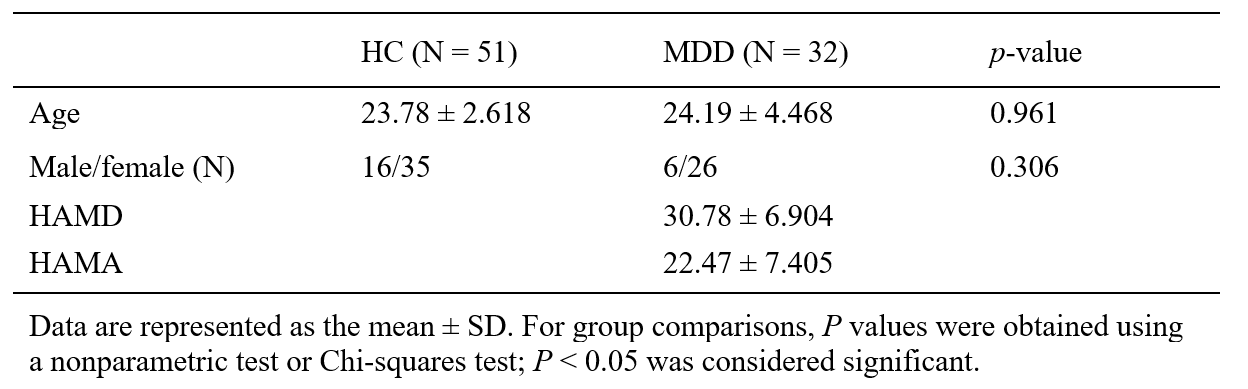
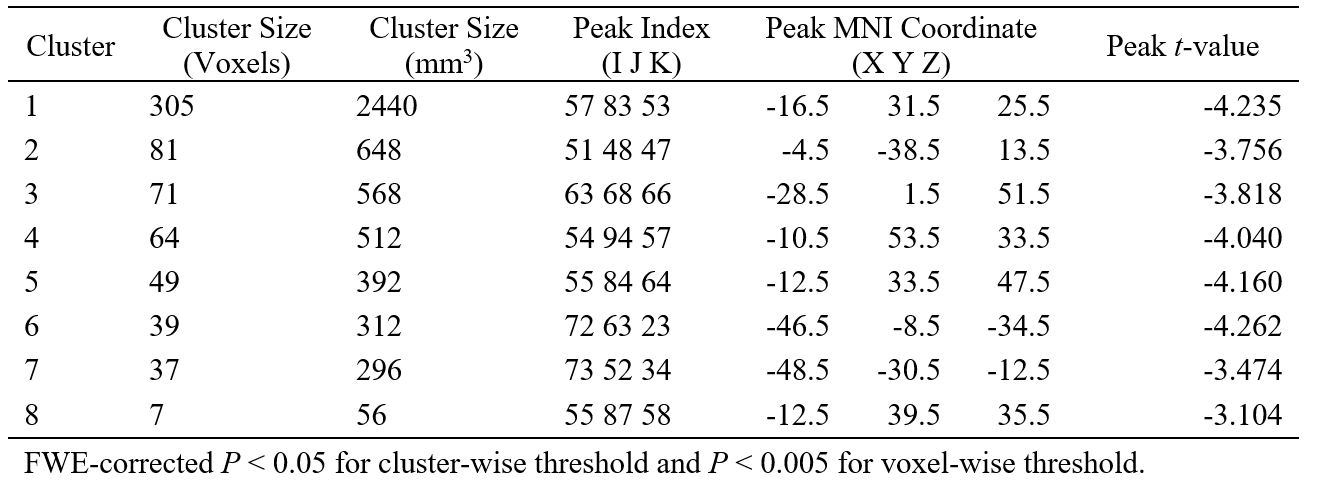
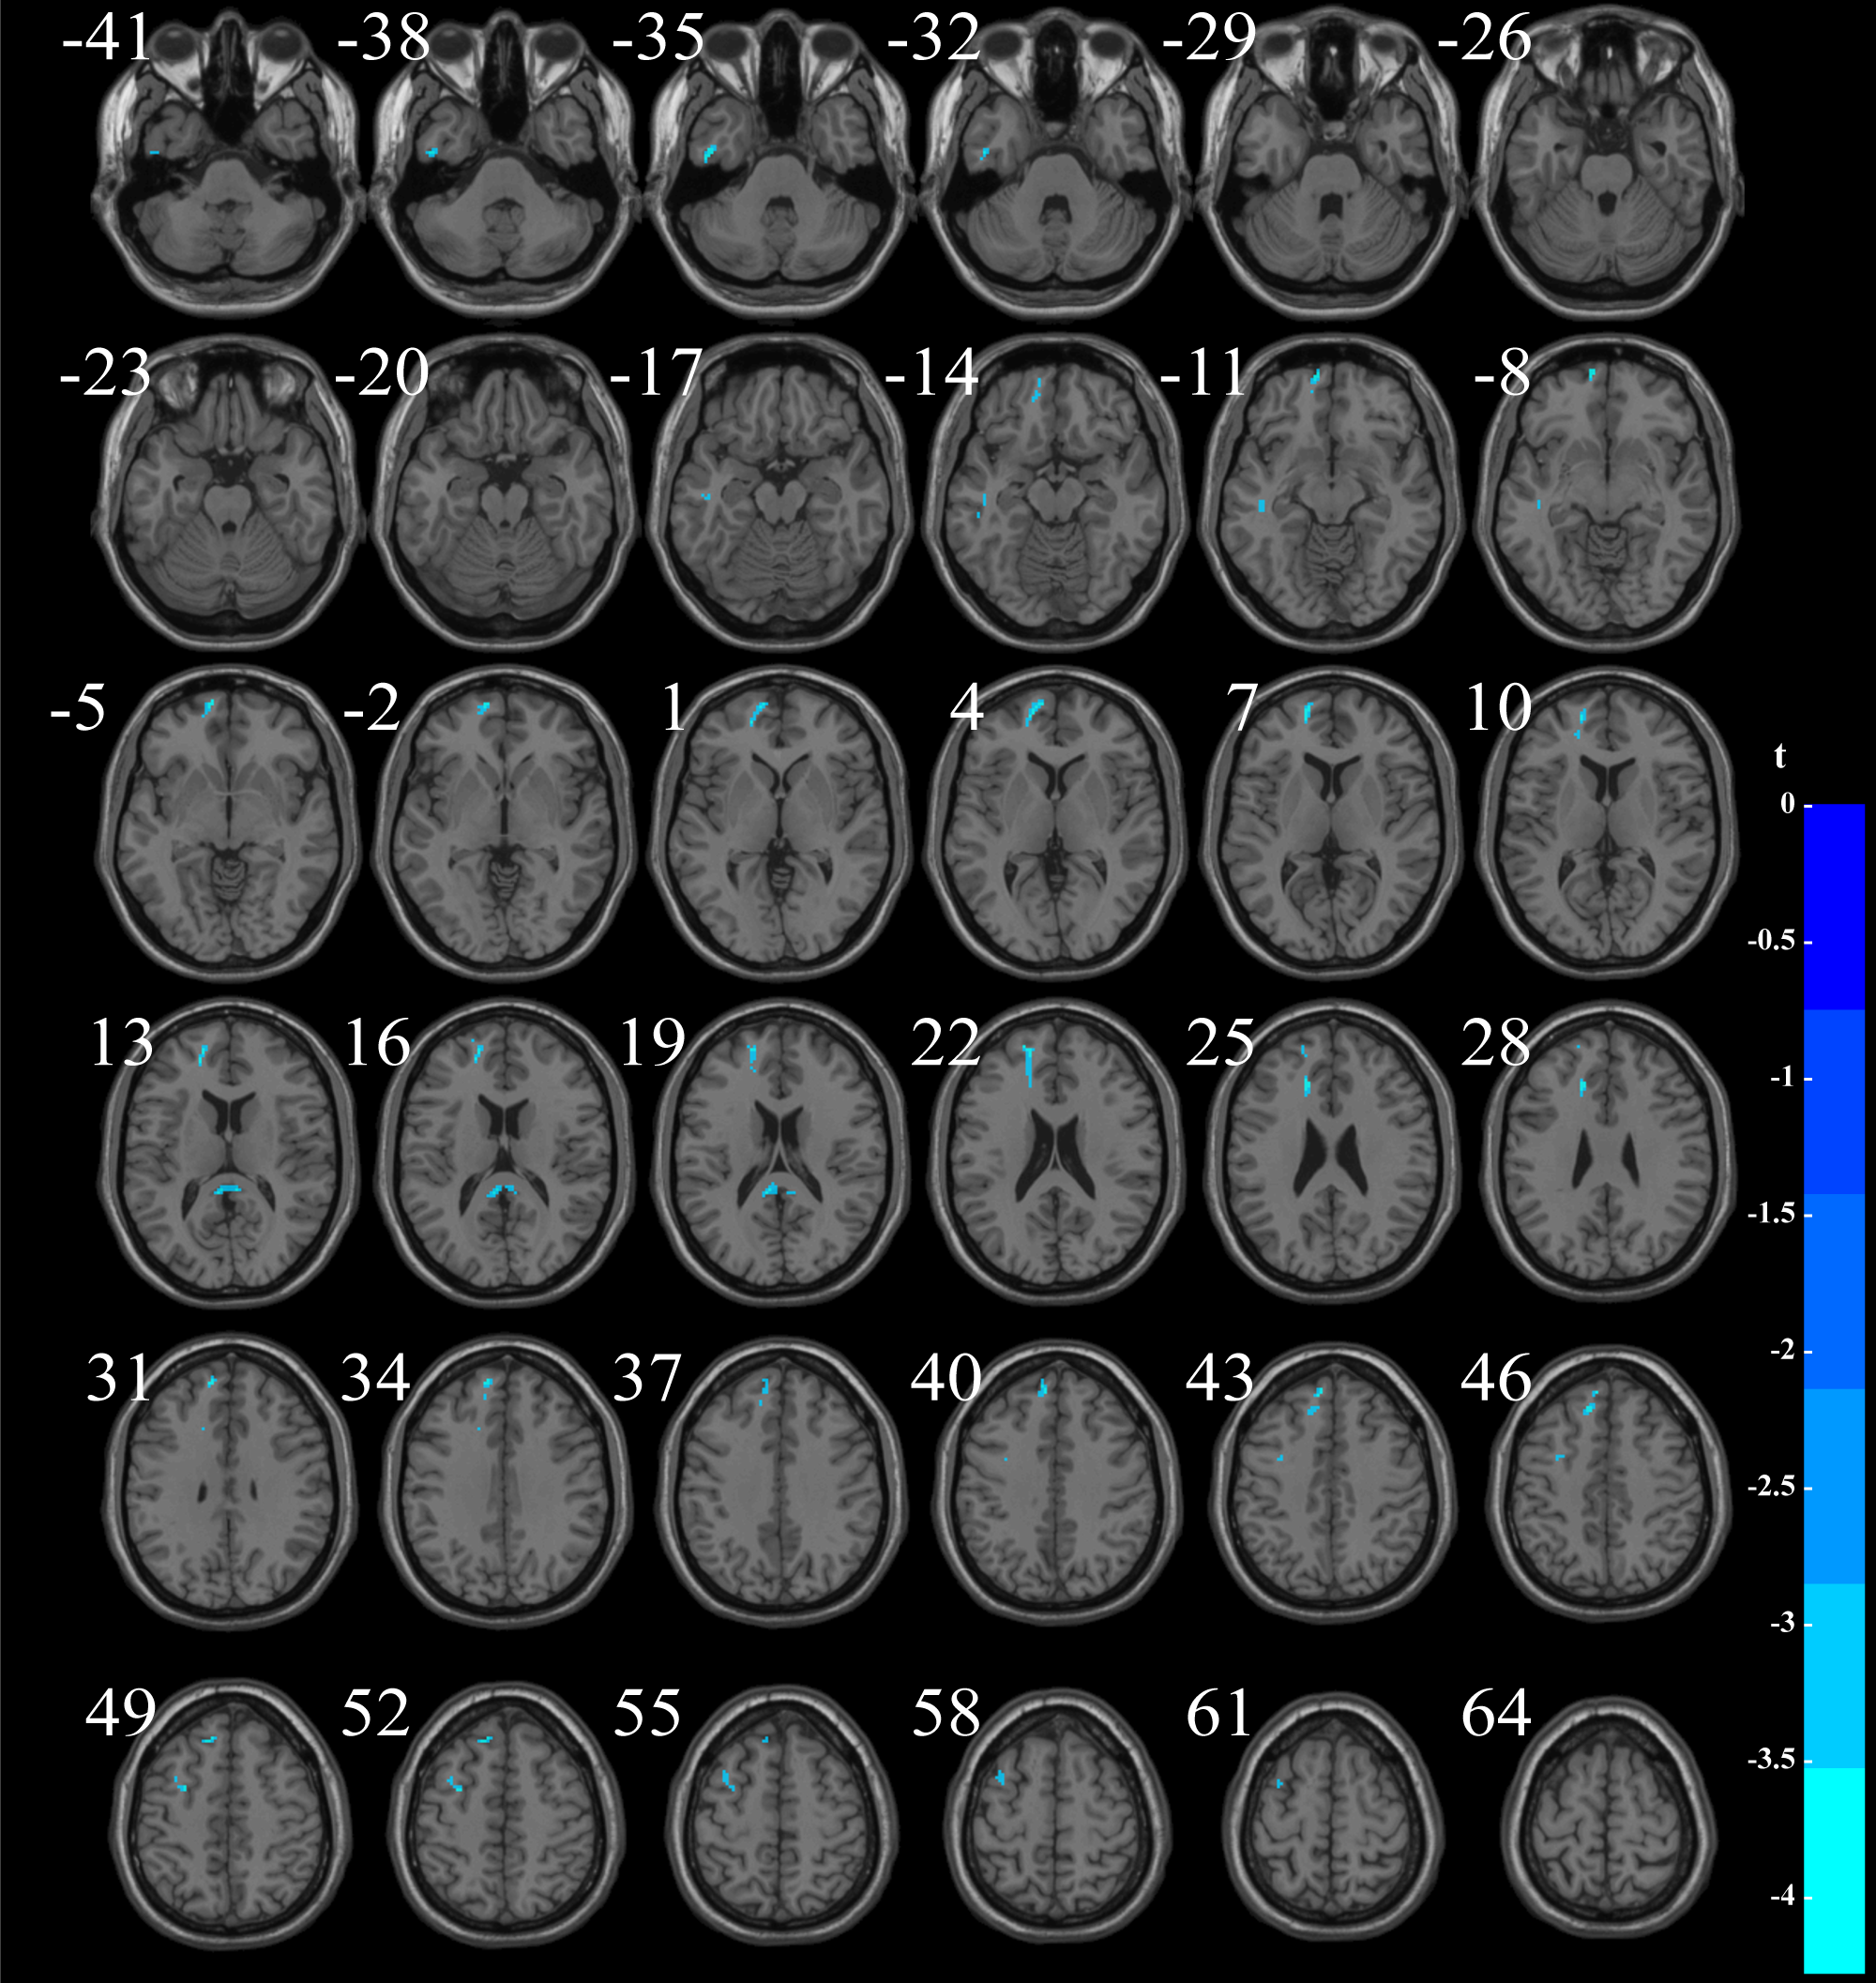
Figure 1. The brain map with group differences in myelin content values between MDD and healthy controls (P < 0.05, FWE-corrected). Detailed information can be found in Table 2.
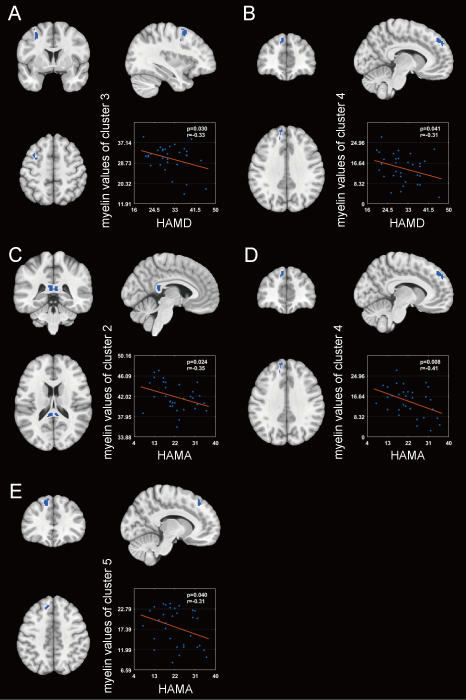
Figure 2. Relationship between HAMD or HAMA and myelin values in clusters showing significant difference. The results of correlation analysis between the HAMD score and myelin content values in the cluster 3 (r = -0.33; p = 0.030) (A) and cluster 4 (r = -0.31; p = 0.041) (B), as well as the HAMA score and myelin content values in the cluster 2 (r = -0.35; p = 0.024) (C), cluster 4 (r = -0.41; p = 0.008) (D) and cluster 5 (r = -0.31; p = 0.040) (E).