3756
Synthetic quantitative magnetic resonance imaging and quantitative susceptibility mapping to reveal brain function in Type 2 Diabetes1Department of Radiology, Central People's Hospital of Zhanjiang, Zhanjiang, China, 2Research Assistant in Department of Clinical Research Institute, Central People's Hospital of Zhanjiang, Zhanjiang, China, 3GE Healthcare, MR Research China, Beijing, China
Synopsis
Keywords: Synthetic MR, Quantitative Imaging, synthetic magnetic resonance imaging, quantitative susceptibility mapping, type 2 diabetes, cognitive impairment
Motivation: Identification of high-risk dementia in T2DM is very important for early intervention.
Goal(s): To explore a feasible imaging approach in early discovering T2DM-driven cognitive impairment.
Approach: To compare ROI-based retrieved relaxation time of synthetic magnetic resonance imaging and quantitative susceptibility values between T2DM and healthy cohorts (NCs) and also correlate significant differences of all measurements with Montreal Cognitive Assessment (MoCA) scores.
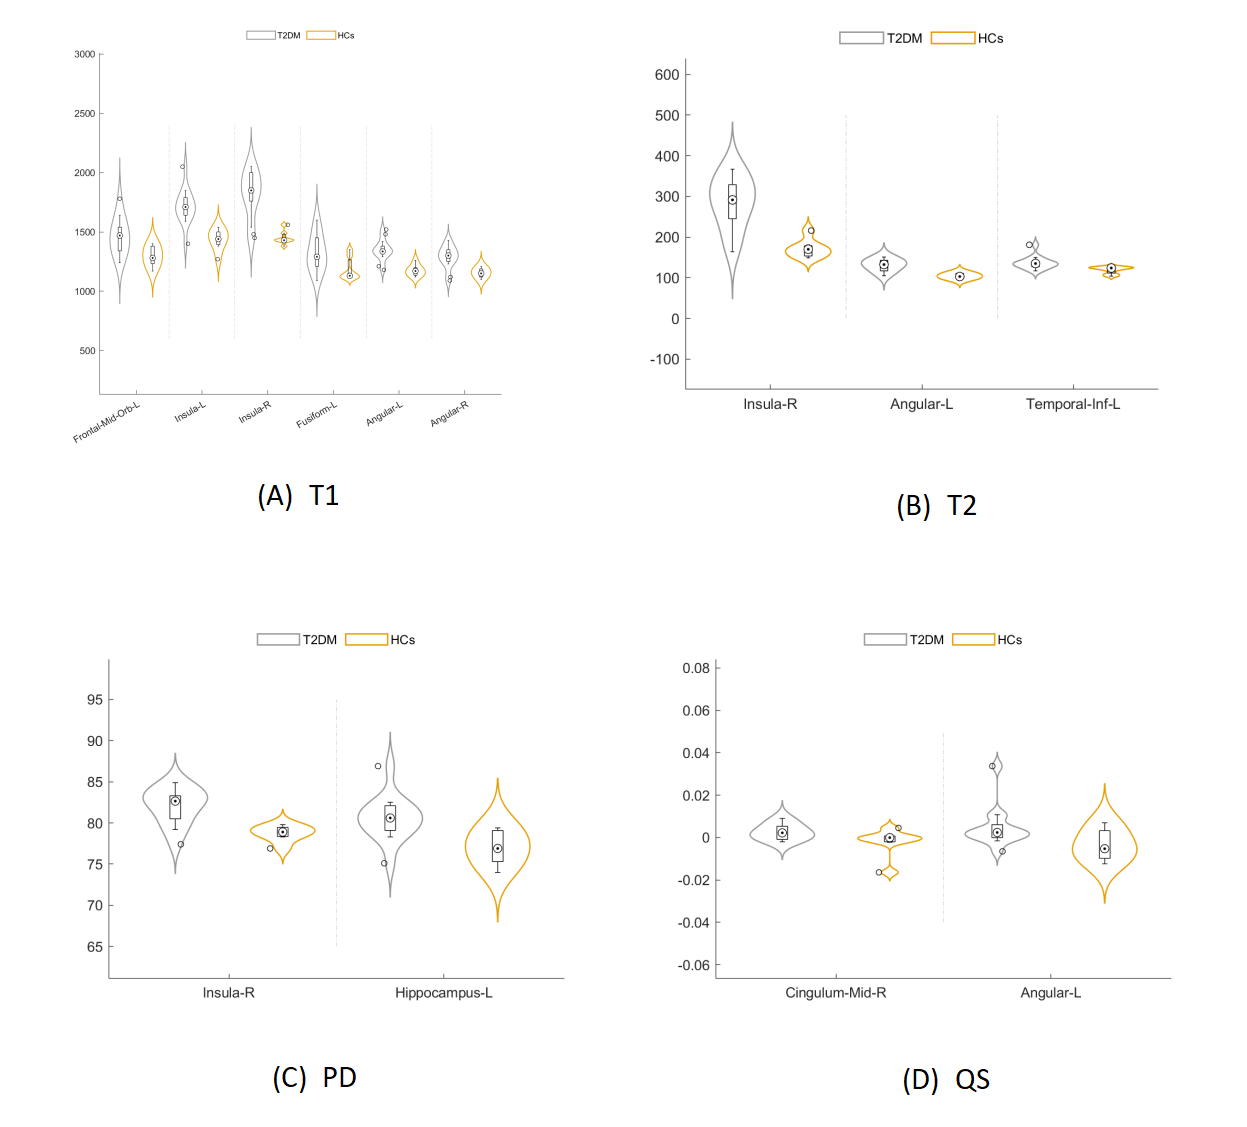
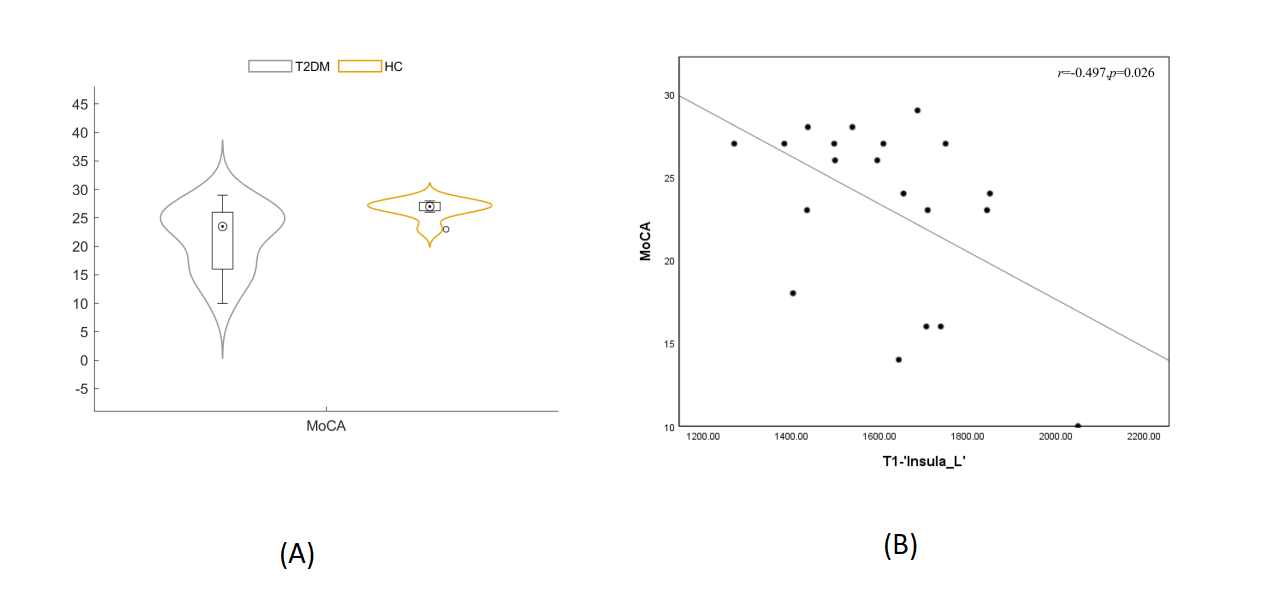
Results: T2DM had higher T1 and T2 relaxation time, PD and QS values in some brain regions than NCs. Moreover, T1 value of left insula was negatively associated with MoCA.
Impact: Synthetic MRI and QSM can detect abnormal brain areas associated with in T2DM, and the former had more potential in clinically diagnosing early alteration in T2DM due to more direct visualization and measurements on the scanner console.
INTRODUCTION
Type 2 diabetes mellitus (T2DM) accelerates the aging process of the brain. Patients with T2DM have 1.5-2.5 times risk of cognitive impairment and even dementia compared to those age-matched health1. To early intervene and ultimately reduce the occurrence of dementia is also important for high-risk cohorts among 537 million patients with T2DM worldwide2. Both synthetic magnetic resonance imaging (syMRI) and quantitative susceptibility mapping (QSM) have been applied in clinical research but rarely in clinical practices to identify changes of relaxation values and magnetic susceptibility in patients with T2DM. It may provide bioimaging evidence for the potential pathophysiological mechanism of cognitive impairment associated with T2DM.METHODS
This study recruited 20 patients with T2DM and 16 age-matched normal controls (NCs). All received 3D T1-BRAVO, magnetic resonance image compilation (MAGiC) and quantitative susceptibility mapping (QSM) on 3.0T MRI scanner (GE Signa Pioneer) and underwent Montreal Cognitive Assessment(MoCA)test. Quantitative maps and QSM map were respectively generated by an offline post-processing workstation (syMRI 11.2.2) and STISuite_V3.0 software. After those parameter maps were also registered to MNI standard space via the affine parameters computed by registration of 3D-T1BRAVO to the MNI standard space first. T1, T2, PD and QSM of 90 brain regions were extracted using a automated anatomical labeling (AAL) template. These quantitative parameters were compared between groups and the significant different values were then correlated with MoCA scores using Pearson correlation.RESULTS
T1 values of left medial orbital frontal gyrus, bilateral insula, left fusiform gyrus and bilateral angular gyrus, T2 values of right insula, left angular gyrus and left inferior temporal gyrus, and the PD values of right insula and left hippocampus were higher in patients with T2DM than those of NCs (p < 0.05). The MoCA score of T2DM was lower than that of CNs (p< 0.05). T1 value of left insula was negatively associated with MoCA score (r=-0.497, p=0.026). There was no correlation between T2 values, PD values and MoCA score. In addition, QS values of right medial and paracingulate gyrus and left angular gyrus were higher in T2DM than NCs (p < 0.05). There was no correlation between QS values and MoCA score.DISCUSSION
Significant differences in T1 and QS values in T2DM patients, compared with NCs, were mainly in brain regions related to cognitive impairment, which might underpin the cause of cognitive impairment in T2DM. Our findings were similar to the previous BOLD studies for brain regions such as medial orbital frontal gyrus, inferior temporal gyrus, hippocampus and paracingulate gyrus 3,4. Additionally, our finding of the higher T1, T2 and PD value in the right insula and the negative association of T1 value in the left insula and cognitive impairment was less focused in the past. The synthetic parametric maps might reveal molecular changes that are invisible to the naked eye before brain structural changes, but the range of value variance remain open to discussion for our inconsistent findings to the previous findings of lower T1, T2 and PD values in neurodegenerative diseases than NCs5; that is, the integrity of nerves with myelinated nerves showed higher T1 values. However, our findings of increased T1 values in the left insular as MoCA score decreased might attribute to compensatory mechanism in early T2DM to retain the completeness of nerve myelination6 in accordance to a previous finding of the compensatory enhancement in functional connections between some brain regions in patients with early T2DM7. Abnormal iron deposition is found in neurodegenerative diseases8. We found different QS values in the cingulate gyrus and the angular gyrus between normal and patients with T2DM, suggesting iron deposition may be one of the causes of cognitive decline in T2DM, similar to several BOLD, QSM, and PET studies9,10. Despite QSM revealed abnormal iron deposition in some brain regions of T2DM, QS values were not correlated with MoCA score possible dude to the small number of included patients.CONCLUSION
Both quantitative MRI parameters (T1, T2, PD) and quantitative susceptibility values could reflect specific brain regions of patients with T2DM and especially facilitate clinically early diagnosis of cognitive impairment in T2DM and in-time intervene, further reducing development of dementia.Acknowledgements
NoneReferences
1. Biessels, G. J.; Nobili, F.; Teunissen, C. E.; et al. Understanding Multifactorial Brain Changes in Type 2 Diabetes: A Biomarker Perspective. Lancet Neurol. 2020, 19 (8), 699–710.
2. Tan, X.; Fang, P.; An, J.; et al. Micro-Structural White Matter Abnormalities in Type 2 Diabetic Patients: A DTI Study Using TBSS Analysis. Neuroradiology 2016, 58 (12), 1209–1216.
3. Sun DM, Ma Y, Sun ZB, et al. Decision-making in primary onset middle-age type 2 diabetes mellitus: a BOLD-fMRI study. Sci Rep. 2017 Aug 31;7(1):10246.
4. Huang RR, Jia BH, Xie L, et al. Spatial working memory impairment in primary onset middle-age type 2 diabetes mellitus: An ethology and BOLD-fMRI study. J Magn Reson Imaging. 2016 Jan;43(1):75-87.
5. Forster D, Davies K, Williams S. Magnetic resonance spectroscopy in vivo of neurochemicals in a transgenic model of Alzheimer's disease: a longitudinal study of metabolites, relaxation time, and behavioral analysis in TASTPM and wild-type mice. Magn Reson Med. 2013 Apr;69(4):944-55.
6. Lou B, Jiang Y, Li C, et al. Quantitative Analysis of Synthetic Magnetic Resonance Imaging in Alzheimer's Disease. Front Aging Neurosci. 2021 Apr 12;13:638731.
7. Jing J, Liu C, Zhu W, et al. Increased Resting-State Functional Connectivity as a Compensatory Mechanism for Reduced Brain Volume in Prediabetes and Type 2 Diabetes. Diabetes Care. 2023 Apr 1;46(4):819-827.
8. Das N, Raymick J, Sarkar S. Role of metals in Alzheimer's disease. Metab Brain Dis 2021 Oct;36(7):1627-1639.
9. Rao IY, Hanson LR, Johnson JC, et al. Brain Glucose Hypometabolism and Iron Accumulation in Different Brain Regions in Alzheimer's and Parkinson's Diseases. Pharmaceuticals (Basel). 2022 Apr 29;15(5):551.
10. Yang A, Zhuang H, Du L, et al. Evaluation of whole-brain oxygen metabolism in Alzheimer's disease using QSM and quantitative BOLD. Neuroimage. 2023 Nov 15;282:120381.
Figures