3753
Synthetic MRI to evaluate myometrial invasion and predict pathologic type of endometrial cancer: compared with high-resolution T2WI and DWI1Radiology, Department of Radiology, Xiangya Hospital, Central South University, Changsha, China, 2Department of Radiology,Xiangya Hospital, Central South University, Changsha, China, 3GE Healthcare,MR, Beijing, China
Synopsis
Keywords: Synthetic MR, Cancer
Motivation: Depth of myometrial invasion (DMI), lymphovascular invasion (LI) and pathological types of endometrial cancer (EC) affect decision-making on an optimal treatment plan for uterus.
Goal(s): This study aimed to investigate the feasibility of MAGIC in evaluating the DMI and predicting the pathological types of EC.
Approach: The assessment performance of MAGIC in comparison to hr-T2WI on DMI and prediction of EC types in comparison to ADC were performed.
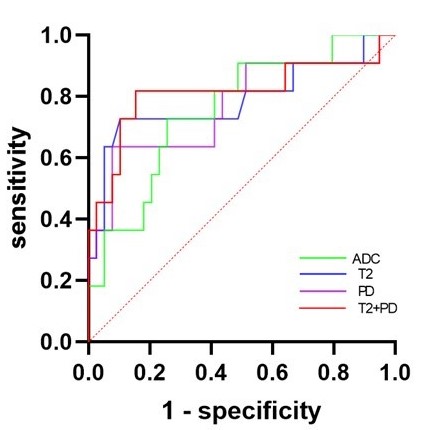
Results: T2 and PD together had a superior predictive performance to ADC only, and sy-T2WI showed the similar assessment performance on DMI to hr-T2WI.
Impact: One more application of MAGIC-generated contrast images and quantitative parameter maps in cervical diagnosis may provide additional information on diagnosis of DMI and classification of pathological types of EC.
INTRODUCTION
To make an optimal treatment plan to endometrial cancer (EC) needs morphological information such as depth of myometrial invasion (DMI) and lymphovascular invasion as well as pathological types of EC1,2. The Magnetic Resonance Imaging Compilation (MAGIC) generates synthetic morphologic images (synthetic T2WI,sy-T2WI) and quantitative synthetic images (T1, T2 and proton density [PD] maps) in one acquisition to facilitate clinical research on brain and prostate disease3,4. Hr-T2WI can clearly detected DMI with the accuracy up to 82.1%5,6 while apparent diffusion coefficient (ADC) values can quantitatively reflect the microstructural EC7. MAGIC can generate both morphological and quantitative images in a single scan and has potential in distinguishing EDVI from muslin rectum8. This study investigated the feasibility of MAGIC in evaluating DMI and predicting the pathological types of EC respectively in comparison with hr-T2WI and DWI.METHODS
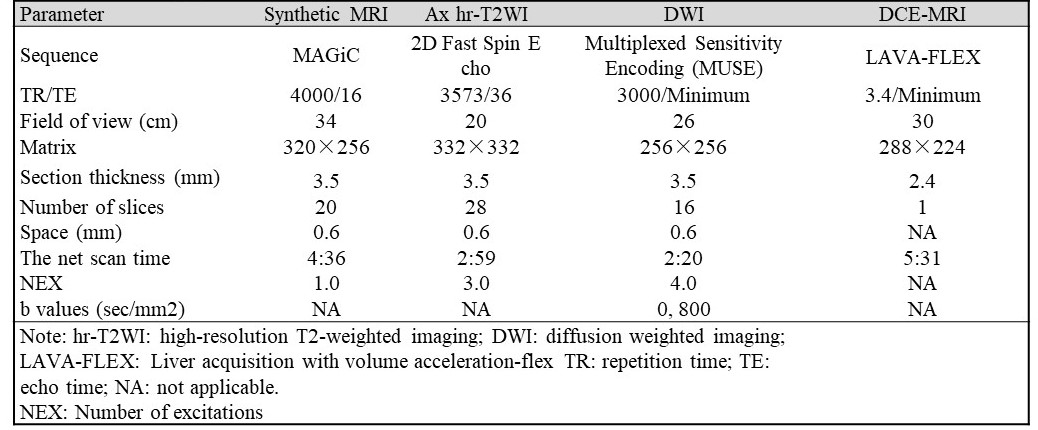
Patients:The study was approved by our institutional ethics committee, and written informed consent was obtained from all patients. A total of 50 patients (54.3±11.2 years) were recruited with the inclusion criteria of: (a) age 18 years or older; (b) histologically-proven EC; (c) without any previous pelvic therapy (eg. chemoradiotherapy and surgical resections before MRI examination); (d) performed MAGIC, hr-T2WI and DWI within 10 days before treatment. The exclusion criteria were: (a) concurrent malignancy at another site; (b) had undergone previous treatment;(c)poor image quality on MAGIC, hr-T2WI and DWI ; (d) without the findings of pathological types.MRI protocol: All enrolled EC patients underwent pelvic MRI examinations on a 3.0T scanner (Signa Premier, GE Healthcare, Waukesha, WI) using a 32-channal body array coil. MAGIC and DWI were acquired with matched localization of oblique axial hr-T2WI (perpendicular to the uterus) including layer thickness and space in Table 1.
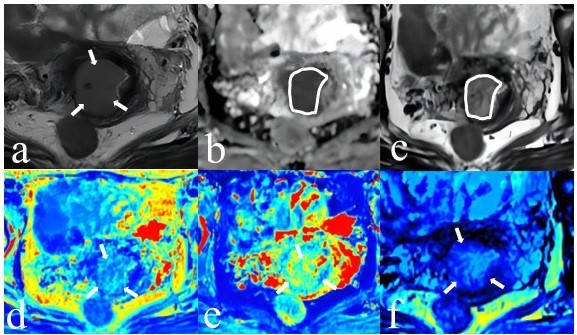
Data analysis: DMI was evaluated on sy-T2WI and hr-T2WI respectively in different one week by two radiologists9. All measurements of T1, T2, PD and ADC respectively averaged across slices for three ROIs (including the slice with the maximum cross-section mass and its upper and lower slices) over EC area on sy-T2WI and ADC maps10.
Histopathology: The final diagnosis for each case was determined on the AJCC and UICC 8th classification. Pathological types of EC were obtained for all patients (39/50 G1 or G2 [type-1] and 11/50 G3 or Non-endometrioid adenocarcinoma [type-2] as defined). More than 50% myometrial infiltration was defined as MDI-II (12/50).
Statistical analysis: Mann⁃Whitney U test was used to compare all measurements between the two groups. Area under the receiver operating characteristic (ROC) curve (AUC) was used to assess the diagnostic efficacy of MAGIC on EC types. The diagnostic accuracy of the two methods for deep myometrial invasion was compared by χ2 test and test level α < 0.05 was considered statistical significance.
RESULTS
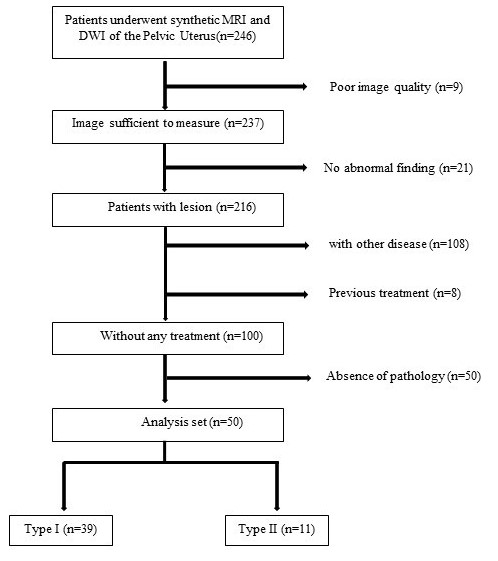
A total of 50 patients with pathological-confirmed EC were included (Fig 1). DMI was correctly determined in 41 of 50 patients (82.0%) and 38 of 50 patients (76.0%) respectively using hr-T2WI and sy-T2WI (Table 2). The diagnostic performance of sy-T2WI was similar to hr-T2WI (r=0.80, p<0.05). T2, PD, and ADC values were lower in type II- EC than in type I-EC (all p < 0.05) but no difference in T1 value (p > 0.05).Furthermore, T2 only and PD only value had a similar predictive performance (AUC = 0.788 and 0.767) for differentiating type II from type I compared to ADC (all P > 0.05) while T2 combined PD had a superior predictive performance to ADC (P<0.05)(Fig 3).DISCUSSION
Our study demonstrated MAGIC-generated contrast images was sufficient for diagnosis of DMI-II as hr-T2WI and quantitative maps for prediction EC types superior to ADC maps (higher ADC, T1, T2, PD in type I tumor than in type II)7. Type I and Type II EC tumors are respectively treated with definitive surgery due to the low-risk histologic features and estrogen dependence and with tumor excision and also the complete lymphadenectomy due to a higher propensity of lymphovascular invasion11. In addition, DMI-triggering incidence of lymph node metastases increases from 3% with superficial myometrial invasion to 46% with DMI-II12,13. Therefore, preoperative information and pathological classification is essential to tailor the surgical approach for these patients.CONCLUSION
Sy-T2WI had lower assessment accuracy of DMI-II but have no statistically different performance to hr-T2WI, and lower T2 and PD values but not T1 value in type II-EC than in type I-EC reflected the intrinsic water and fat content of biological tissues14,15, suggesting MAGIC could be an alternative for diagnosis of DMI and classification of pathological types of EC.Acknowledgements
This work was supported by the Natural Science Foundation of Hunan Province (grant number 2022JJ30950). We thank the MR Research Collaboration of GE Healthcare for technical support.References
[1] Huijgens AN, Mertens HJ. Factors predicting recurrent endometrial cancer. Facts Views Vis ObGyn 2013;5(3):179–186.
[2] Sorbe B. Predictive and prognostic factors in definition of risk groups in endometrial carcinoma. ISRN Obstet Gynecol 2012;2012:325790.
[3] Gao W, Zhang S, Guo J, Wei X, Li X, Diao Y, Huang W, Yao Y, Shang A, Zhang Y, Yang Q, Chen X. Investigation of Synthetic Relaxometry and Diffusion Measures in the Differentiation of Benign and Malignant Breast Lesions as Compared to BI-RADS. J Magn Reson Imaging. 2021 Apr;53(4):1118-1127. doi:10.1002/jmri.27435.
[4] Cui Y, Han S, Liu M, Wu PY, Zhang W, Zhang J, Li C, Chen M. Diagnosis and Grading of Prostate Cancer by Relaxation Maps From Synthetic MRI. J Magn Reson Imaging. 2020 Aug;52(2):552-564. doi: 10.1002/jmri.27075.
[5]Cade TJ, Quinn MA, McNally OM, Neesham D, Pyman J, Dobrotwir A. Predictive value of magnetic resonance imaging in assessing myometrial invasion in endometrial cancer: is radiological staging sufficient for planning conservative treatment? Int J Gynecol Cancer 2010;20(7):1166–1169.
[6] Staging of Endometrial Cancer Using Fusion T2-Weighted Images with Diffusion-Weighted Images: A Way to Avoid Gadolinium?
[7] Quantitative diffusion and perfusion MRI in the evaluation of endometrial cancer: validation with histopathological parameters.
[8]European Radiology https://doi.org/10.1007/s00330-022-09344-8
[9] DelMaschio A, Vanzulli A, Sironi S, Spagnolo D, Belloni C, Garancini P, Taccagni GL. Estimating the depth of myometrial involvement by endometrial carcinoma: efficacy of transvaginal sonography vs MR imaging. AJR Am J Roentgenol. 1993 Mar;160(3):533-8. doi:10.2214/ajr.160.3.8430547
[10] Li S, Liu J, Zhang F, Yang M, Zhang Z, Liu J, Zhang Y, Hilbert T, Kober T, Cheng J, Zhu J. Novel T2 Mapping for Evaluating Cervical Cancer Features by Providing Quantitative T2 Maps and Synthetic Morphologic Images: A Preliminary Study. J Magn Reson Imaging. 2020 Dec;52(6):1859-1869. doi: 10.1002/jmri.27297.
[11] National Comprehensive Cancer Network. Uterine Neoplasms (version 1.2022). https://www.nccn.org/professionals/physician_gls/pdf/uterine.pdf. Accessed March 12,2022.
[12] Larson DM, Connor GP, Broste SK, Krawisz BR, Johnson KK. Prognostic signifi cance of gross myometrial invasion with endometrial cancer. Obstet Gynecol 1996;88(3):394–398.
[13] bBerman ML, Ballon SC, Lagasse LD,Watring WG. Prognosis and treatment of endometrial cancer. Am J Obstet Gynecol 1980;136 (5):679–688.
[14] Li S, Zhang Z, Liu J, Zhang F, Yang M, Lu H, Zhang Y, Han F, Cheng J, Zhu J. The feasibility of a radial turbo-spin-echo T2 mapping for preoperative prediction of the histological grade and lymphovascular space invasion of cervical squamous cell carcinoma. Eur J Radiol. 2021 Jun;139:109684. doi:10.1016/j.ejrad.2021.109684.
[15] Jung J, Han A, Madamba E, Bettencourt R, Loomba RR, Boehringer AS, Andre MP, Erdman JW Jr, O'Brien WD Jr, Fowler KJ, Sirlin CB, Loomba R. Direct Comparison of Quantitative US versus Controlled Attenuation Parameter for Liver Fat Assessment Using MRI Proton Density Fat Fraction as the Reference Standard in Patients Suspected of Having NAFLD. Radiology. 2022 Jul;304(1):75-82. doi: 10.1148/radiol.211131.
Figures