3751
Evaluation of performance gains combining high-density receive arrays with transceiver arrays for brain imaging at 7T1Imaging Centre of Excellence, University of Glasgow, Glasgow, United Kingdom, 2MR CoilTech Limited, Glasgow, United Kingdom, 3Brain imaging center and Helen Wills Neuroscience institute, University of California, Berkeley, Berkeley, CA, United States, 4Advanced MRI Technologies, Sebastopol, CA, United States, 5NeuroSpin, CEA, Paris, France
Synopsis
Keywords: High-Field MRI, Parallel Imaging
Motivation: To improve signal-to-noise-ratio (SNR) in deep brain structures while using high-density receive arrays at 7T.
Goal(s): Compare SNR and g-factor performance of conventional transmit-only receive-only arrays with receive arrays combined with transceiver arrays.
Approach: Transceive function was introduced on 8Tx63Rx and 16Tx96Rx 7T head coils, so that the number of receive channels during acquisition increased by 8 and 16, respectively. Three healthy volunteers were scanned, and SNR and g-factor maps were calculated for the different configurations.
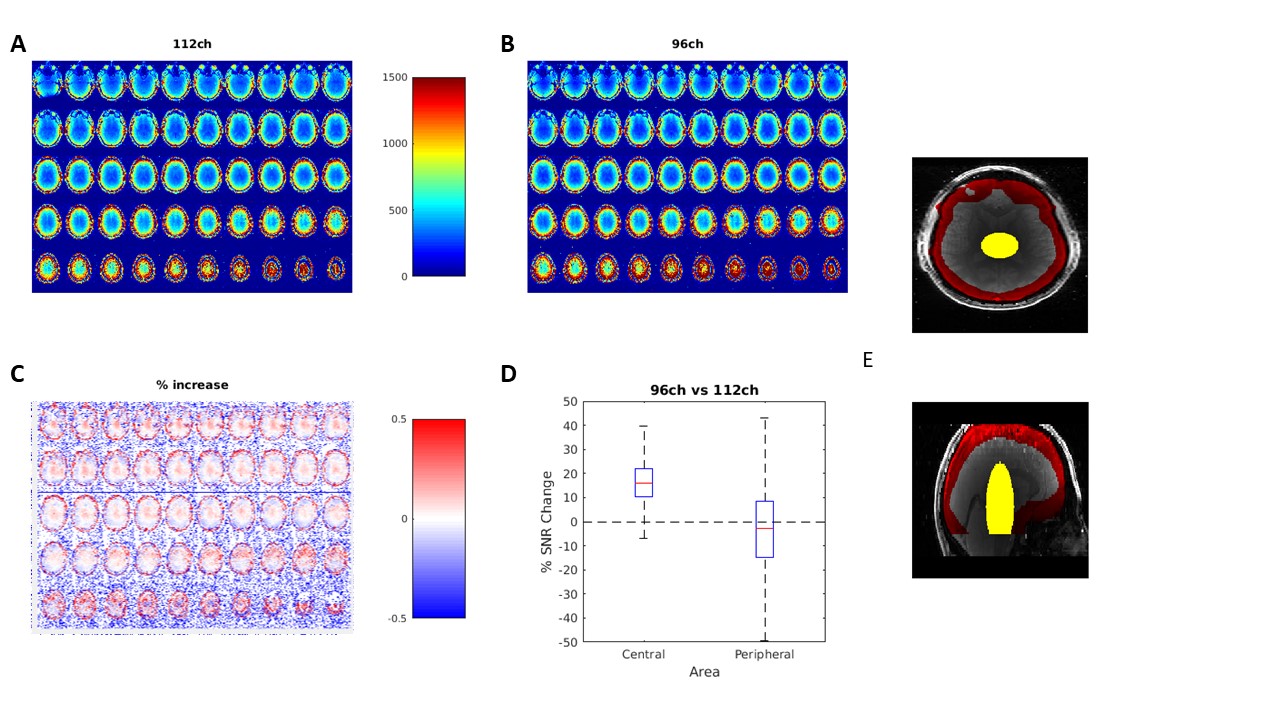
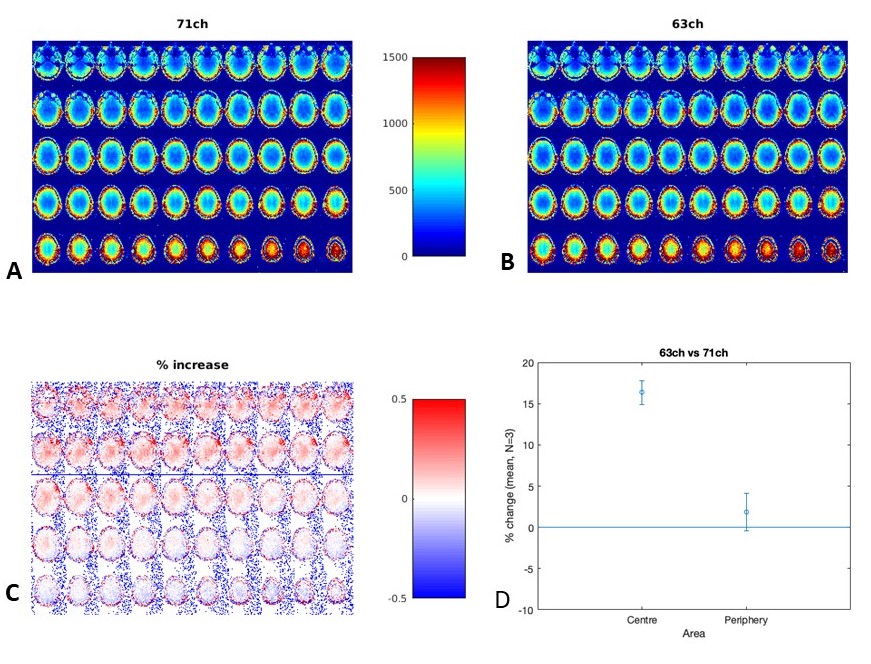
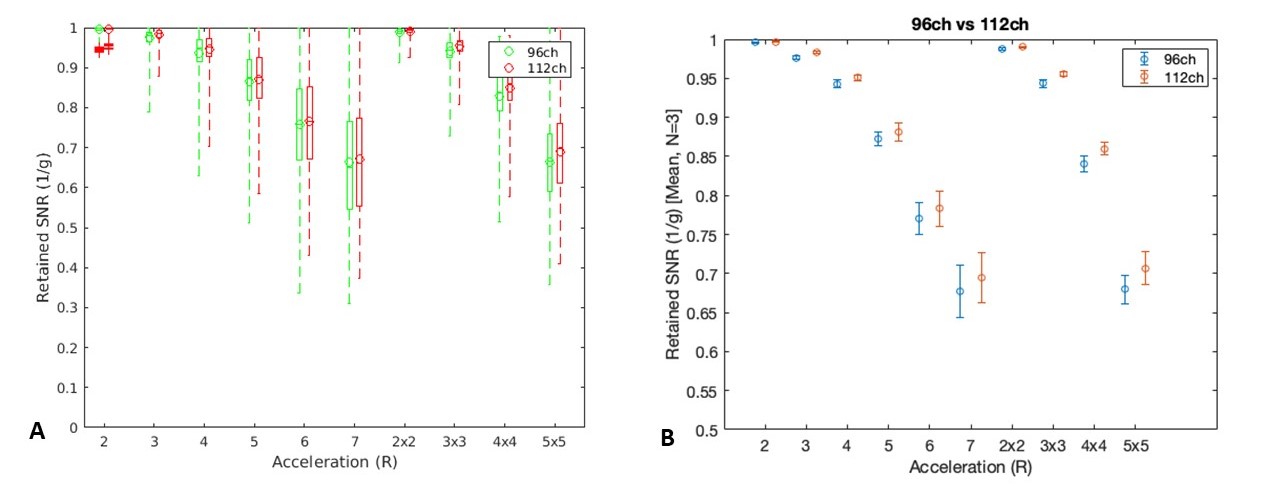
Results: The transceiver configuration provided about 16% increase in the central SNR. At higher acceleration factors, especially the 112-channel receive configuration provided improved g-factor performance.
Impact: : High-density receive-only arrays provide high SNR close to the surface while maintaining the central SNR under sample noise dominant conditions. Transceiver loops surrounding the receive array enhances the central SNR at 7T, although not as high as reported at 10.5T.
Introduction
The NexGen 7T scanner at the University of California, Berkeley is the first of its kind equipped with 16-transmit and 128-receive channels and an investigational head gradient coil (‘Impulse’, Siemens Healthineers, Erlangen Germany) capable of achieving a maximum gradient strength of 200 mT/m and slew rate of 900 T/m/s per axis1. A 16Tx96Rx array2 and an 8Tx63Rx array3 has been developed for this scanner. Recent work on utilising transmit elements during signal reception4-7 has generated interest in this topic because of its potential to enhance the signal-to-noise-ratio (SNR) in deep brain regions. In effect the inclusion of transmit elements creates two layers of receiver loops having different size and coverage at different depths from the brain8. This is particularly relevant in high-density receive arrays because increasing the number of receive channels only improves the SNR close to the surface coils9. However, the performance gains achieved by combining transceivers with receive-only arrays is dependent on frequency and transceiver array type4,5,7. In this work, we have implemented transceiver function on the two coil arrays presented earlier2,3 so that there are 112 and 71-channels, respectively, during signal reception, and SNR and g-factor gains are presented.Methods
Coil 12: The transmit array consisted of sixteen conventional loops arranged in two rows of 8-elements each. The active detuning circuit in the transmit element was disabled and custom-built TR switches were introduced, such that the modified coil has 16-transceiver elements and a total of 112 -receive elements. The phase between the transmit element input and the TR switch was controlled such that preamp decoupling is achieved when the transceiver element is looking into the low-impedance preamplifier during receive.Coil 23: There are 8-transmit loops arranged in a single row. These were converted to transceiver loops as explained in the earlier section, and the modified coil had 8-channels during transmit and 71-channels during receive.
Three healthy volunteers were scanned before and after the transmit coil was modified as a transceiver. SNR measurements were taken using a whole-brain 2D proton-density weighted gradient-echo sequence [TR/TE/flip angle (FA) = 5s/3.82ms/90°, slice = 2 mm, matrix = 256x88, FOV = 256x176 mm2, readout bandwidth (BW) = 335 Hz/pixel, TA=7:22 min]. Noise covariance information was acquired using the same pulse sequence without RF excitation. SNR maps were calculated using the noise covariance-weighted optimal coil combination [10, 11]. FA maps were acquired using a pre-saturation pulse with a turbo-flash readout12 [TR/TE/FA = 5s/2.02ms/90°, slice = 1.5 mm, matrix = 256x88, FOV = 256x128 mm2, BW = 335 Hz/pixel, Turbo factor = 128]. SNR maps were then normalized by dividing them by sin(FA) to isolate the receive sensitivity. SENSE g-factor maps were computed using coil sensitivity maps generated from the fully sampled 2D gradient-echo data [TR/TE/FA = 10ms/4.8ms/15°, slice = 5 mm, matrix = 256x256, FOV = 210x210 mm2, BW = 390 Hz/pixel] and measured noise covariance matrices13
Results
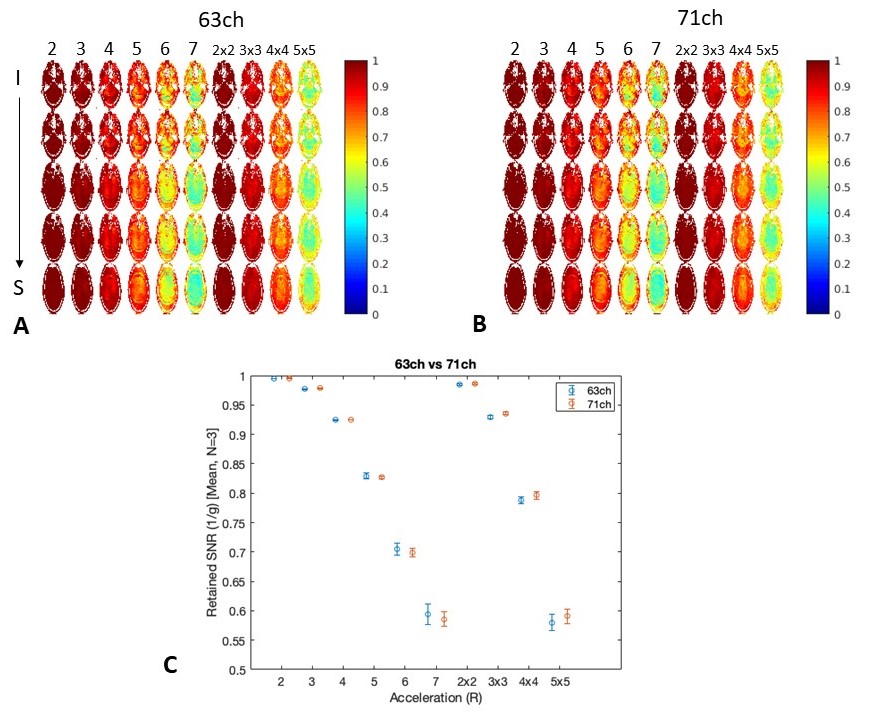
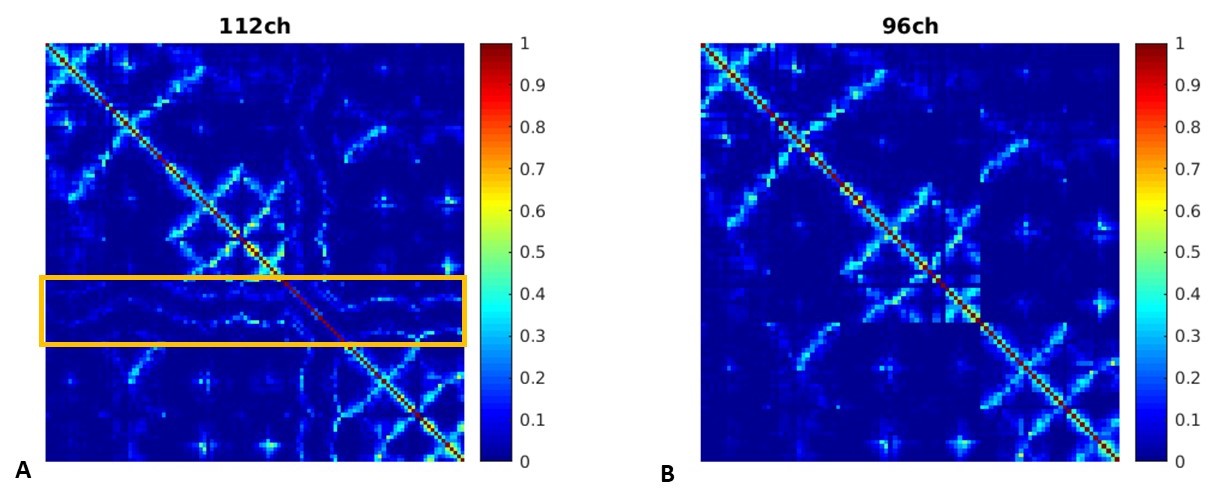
The SNR gained by combining the 96-channel array with 16-channel transceiver for the 112Rx configuration is shown in figure 1. Up to 16% gain was measured in the central ROI with no SNR penalty in the periphery. For the 71Rx configuration, the SNR gain, averaged over the three subjects, is 17% and negligible change in SNR was measured in the peripheral ROI. The transceiver configurations also show decreased g-factor (increased retained SNR as measured by 1/g) at higher acceleration factors, particularly for the 112ch array (figure 3). Marginal improvements in 1/g factor values were seen when the 63-channel array was combined with 8-transceive elements. The g-factor performance of both coils alleviates the concern of coupling between the transceiver and the receive array, which could diminish the differences in coil sensitivities. The noise correlation matrix shown in figure 5 demonstrates that preamplifier decoupling implemented on the transceiver elements was sufficient to minimize coupling with the transceiver elements.Discussion and conclusion
This work presents for the first time receive performance gains while combining transceiver arrays with 96 and 63-channel arrays for brain imaging at 7T. Such configurations are possible in the NexGen 7T scanner at Berkeley because of its 128-channel receive capability. In conventional scanners, the receive array should be modified such that the total number of receive channels, including the transceiver option, is limited to 64-receive channels (presented separately). While the SNR gain at 7T is not as substantial as achieved with the 10.5T 16TxRx112Rx array7, this study demonstrates that it is still possible to achieve gains with conventional transceiver loops instead of employing dipoles which is substantially more complex to combine with high-density receive arrays due to its tuning sensitivity.Acknowledgements
We acknowledge the following funding sources: AROMA H2020 FET-Open (885876). U01-EB025162, U24-NS129949, R44-MH129278 (NIH).References
1. DA Feinberg et al., Nature Methods (Dec. 2023, in press)
2. S Gunamony et al., ISMRM 2021
3. S Gunamony et al., ISMRM 2022
4. Gosselink M et al., NMR in Biomedicine.2021;34:e4491
5. Avdievich N et al., Magn Reson Med. 2022;88:1912–1926
6. Lagore RL et al., NMR in Biomedicine. 2021; 34:e4472
7. Lagore RL et al., ISMRM 2023
8. Feinberg DA et al., 2020 US patent: 10578687B2
9. Gruber B et al., Magn Reson Med DOI: 10.1002/mrm.29798
10. Roemer PB., et al., MRM, 1990, 16(2): 192–225.
11. Kellman P., et al., MRM, 2005, 54(6): 1439–1447.
12. Chung S., et al. MRM, 2010, 64(2): 439–446.
13. Pruessmann KP, et al., MRM. 1999; 952-962.
Figures