3746
RF-induced Heating Estimation of a Stent in a 3T MRI using Transfer Function Approach with a table-top E-field generator1Center for Devices and Radiological Health, U.S. Food and Drug Administration, Silver Spring, MD, United States
Synopsis
Keywords: Safety, Safety
Motivation: The TF validation process is time-consuming work. Here, we reduced the burden of TF approach using a low power tabletop E-field generator.
Goal(s): Using the TF approach to estimate the RF-induced heating of the stent tip at 3T using a E-field generator and compared predicted values against the estimated values.
Approach: TF of the stent was measured via piX method at 128MHz . TF was validated by exposing the device under diverse test fields using table-top E-field generator. The body coil was used to evaluate the TF approach.
Results: The stent tip heating was estimated using TF approach with a low-power E-field generator.
Impact: TF approach could aid estimating the RF-induced heating, not only active implantable device, but also elongated passive implantable device. A compact E-field generator can be used for TF validation.
Introduction
Radio-frequency (RF) induced heating is one of the concerns inside MRI, especially for patients with implantable medical device. Transfer function (TF) based RF-heating estimation is often used to predict active implantable medical device (AIMD) lead wire heating, which produces local hot-spot at the distal end of the device1. The traditional TF validation process requires test measurements in various positions2 in the ASTM phantom which is time-consuming work. The first goal of this study is to use an alternative versatile, low power tabletop E-field generator for RF field exposure to validate TF and to investigate the use of TF approach to estimate the RF-induced heating of the elongated passive stent tip at 3T3 and compare to. The second goal is to compare predicted RF heating effect value against the measured value using TF approach. Here, we used TF approach to estimate the RF-induced heating of a stent and compared with dosimetric probe measurement inside table-top E-field generator and with the thermal elevation inside a quadrature body coil (QBC).Methods
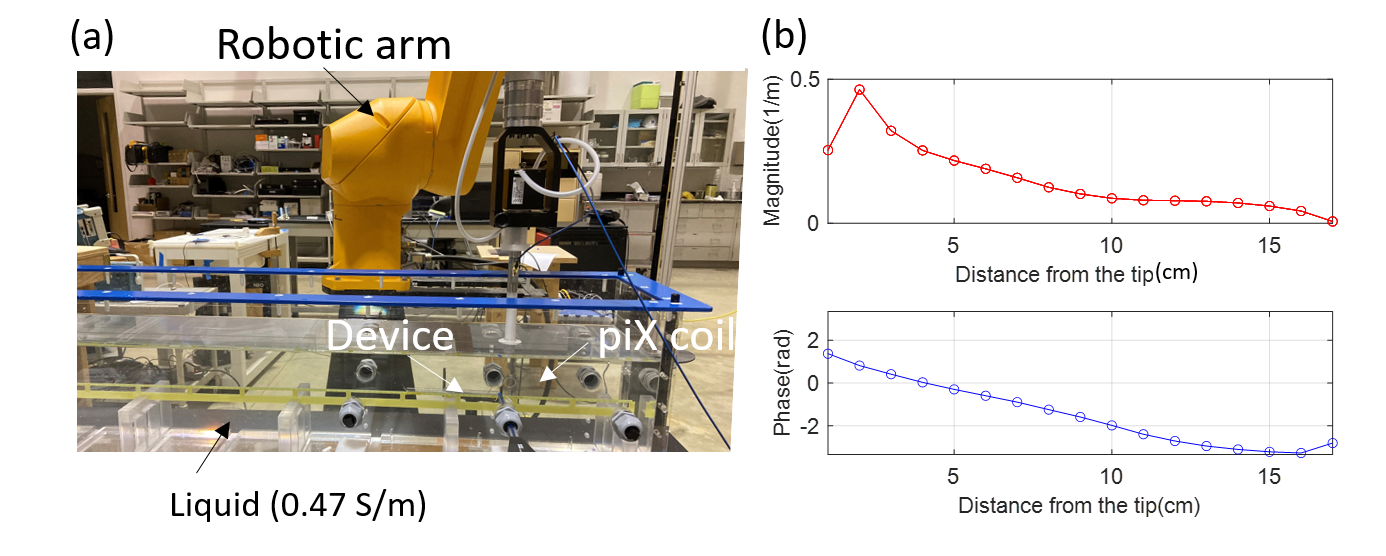
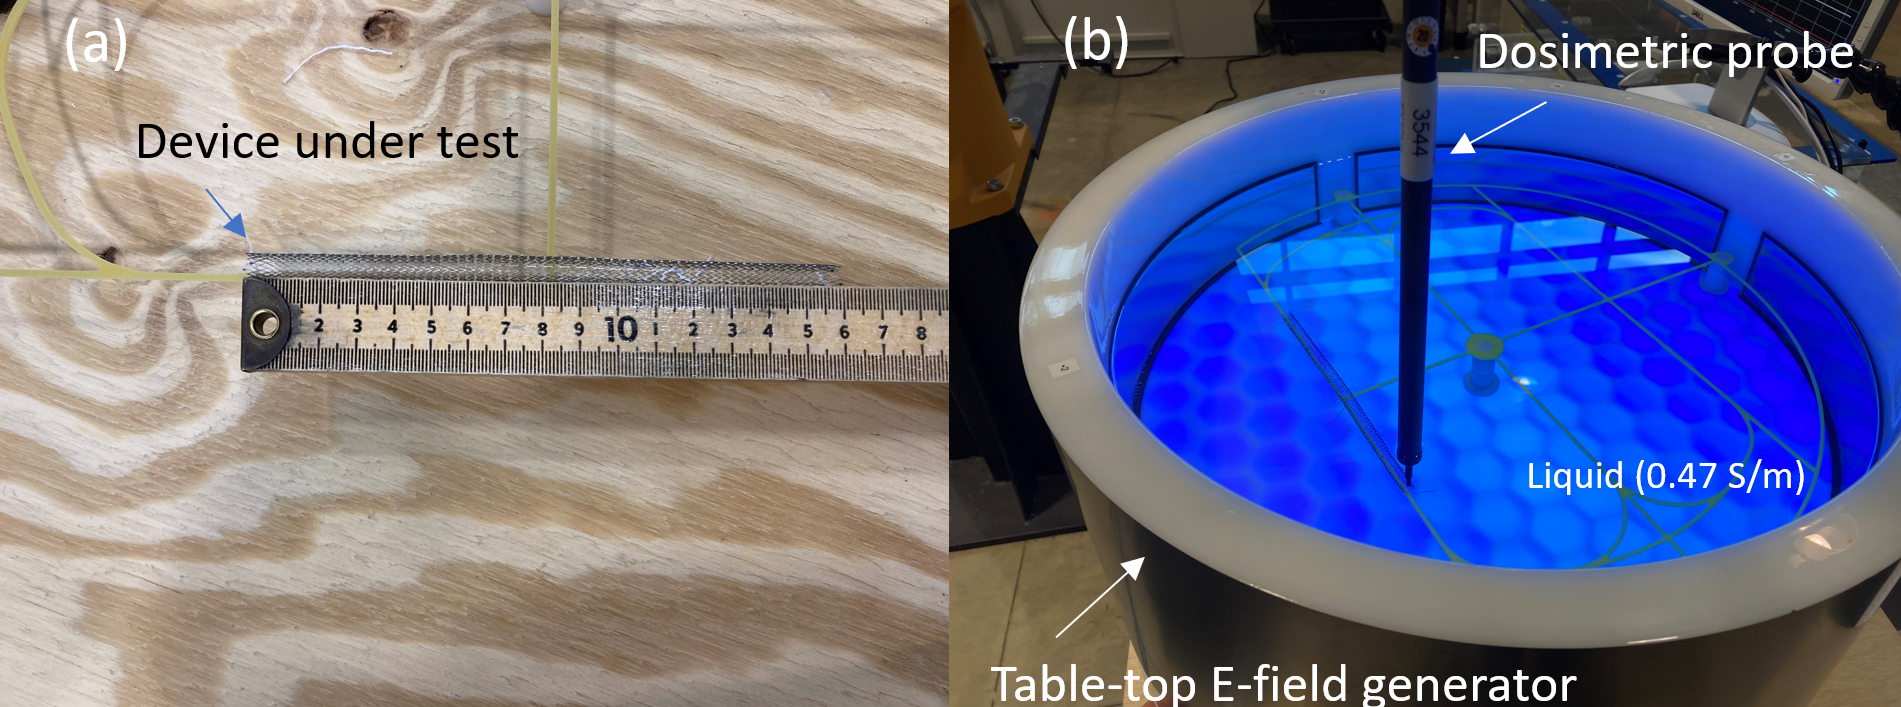
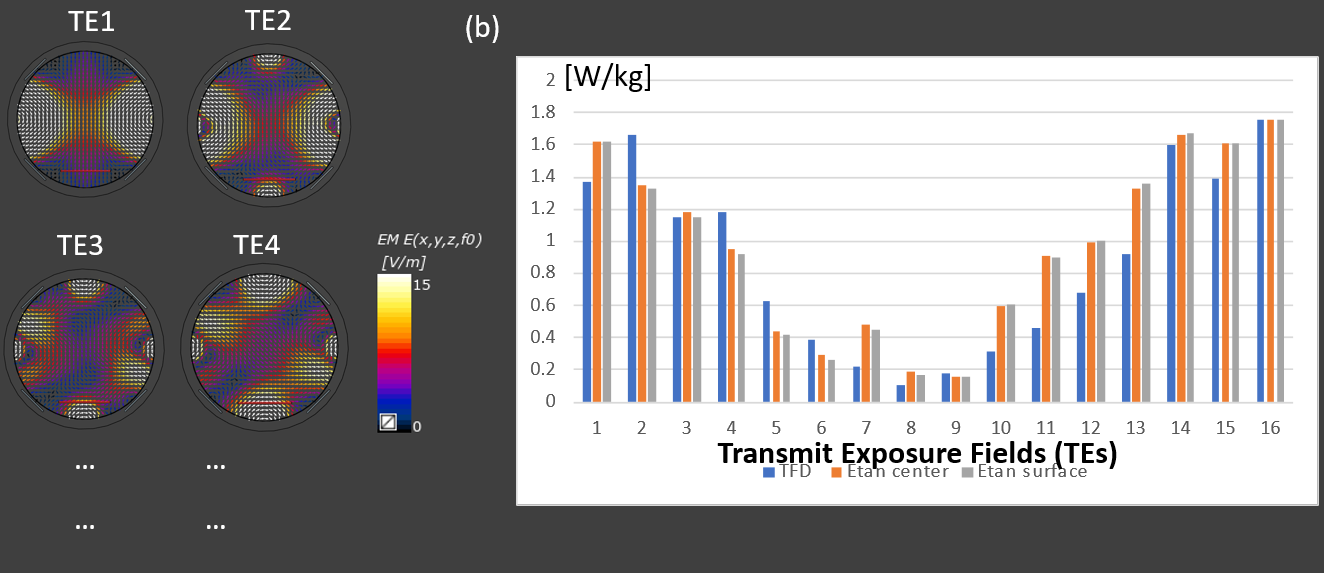
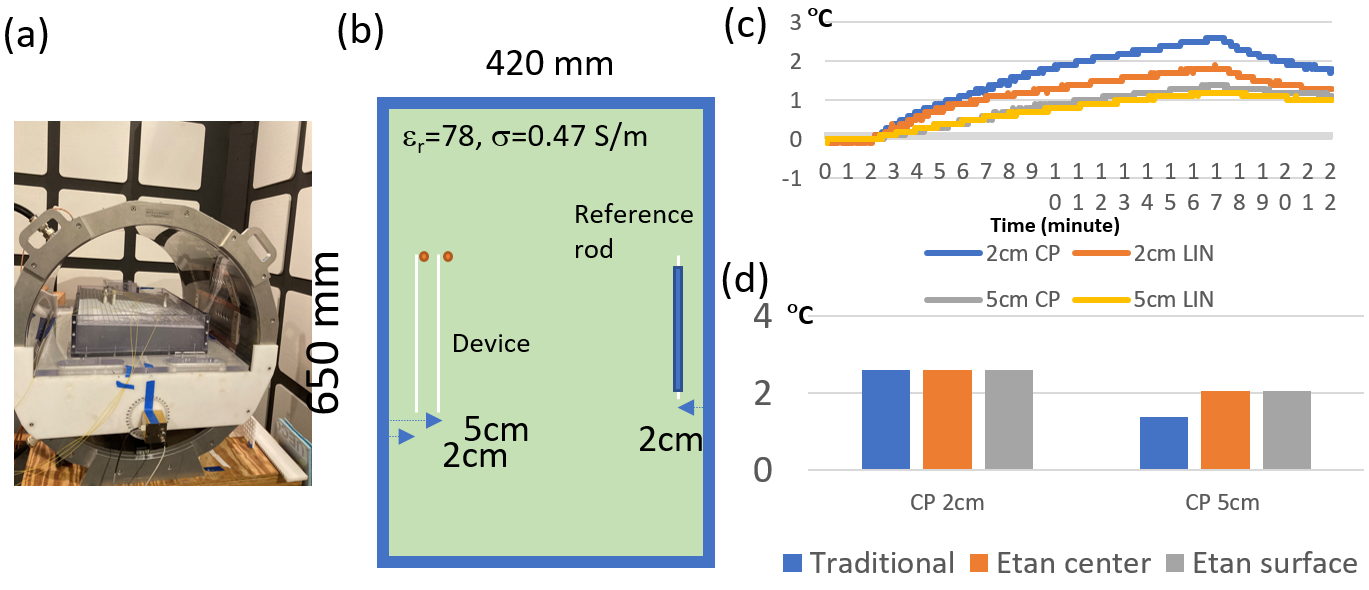
The piecewise excitation method, piX (ZMT, Switzerland), was used to measure TF at 128 MHz (Fig.1). A stent sample (L=160mm, O.D.=7mm, thickness = 0.2mm) made with Nitinol was positioned on a racetrack for the TF measurement, submerged under conductive tissue simulating liquid (s: 0.47 S/m, er: 78) while piecewise excitation coil for TF measurement swept along the device trajectory every 10 mm and E-field was measured near the device distal tip using an optical Electric-field probe (E1TDSx, SPEAG, Switzerland). The measured TF was validated by exposing the device under diverse Test Exposure (TE) fields using the table-top E-field generator called the MITS-TT (ZMT, Switzerland) (Fig.2(b)). Customized sixteen different incident E-field exposures to test RF-induced heating on a device were generated from MITS-TT by changing the magnitude and phase of the two channel transmit source and the dosimetric E-field probe (EX3DV4, SPEAG, Switzerland) was positioned at the tip of the stent to measure the local SAR (W/kg). Sim4Life software (ZMT, Switzerland) was used to calculate incident E-field along the device trajectory in MITS-TT, using the simulated tangential E-field (Etan) with the measured TF, deposited power was estimated using MATLAB (Mathworks, USA). An additional experiment was done for comparison as a popular method using the 3T QBC (MITS-3.0, SPEAG, Switzerland) by positioning the device inside ASTM gel phantom (s: 0.47 S/m, er: 78)2 at two positions (Fig.4(b)) to measure the temperature changes for 15 minutes with rectangular pulse, at 55 dBm input power at 40% duty cycle (Figure 4 (a)).Results
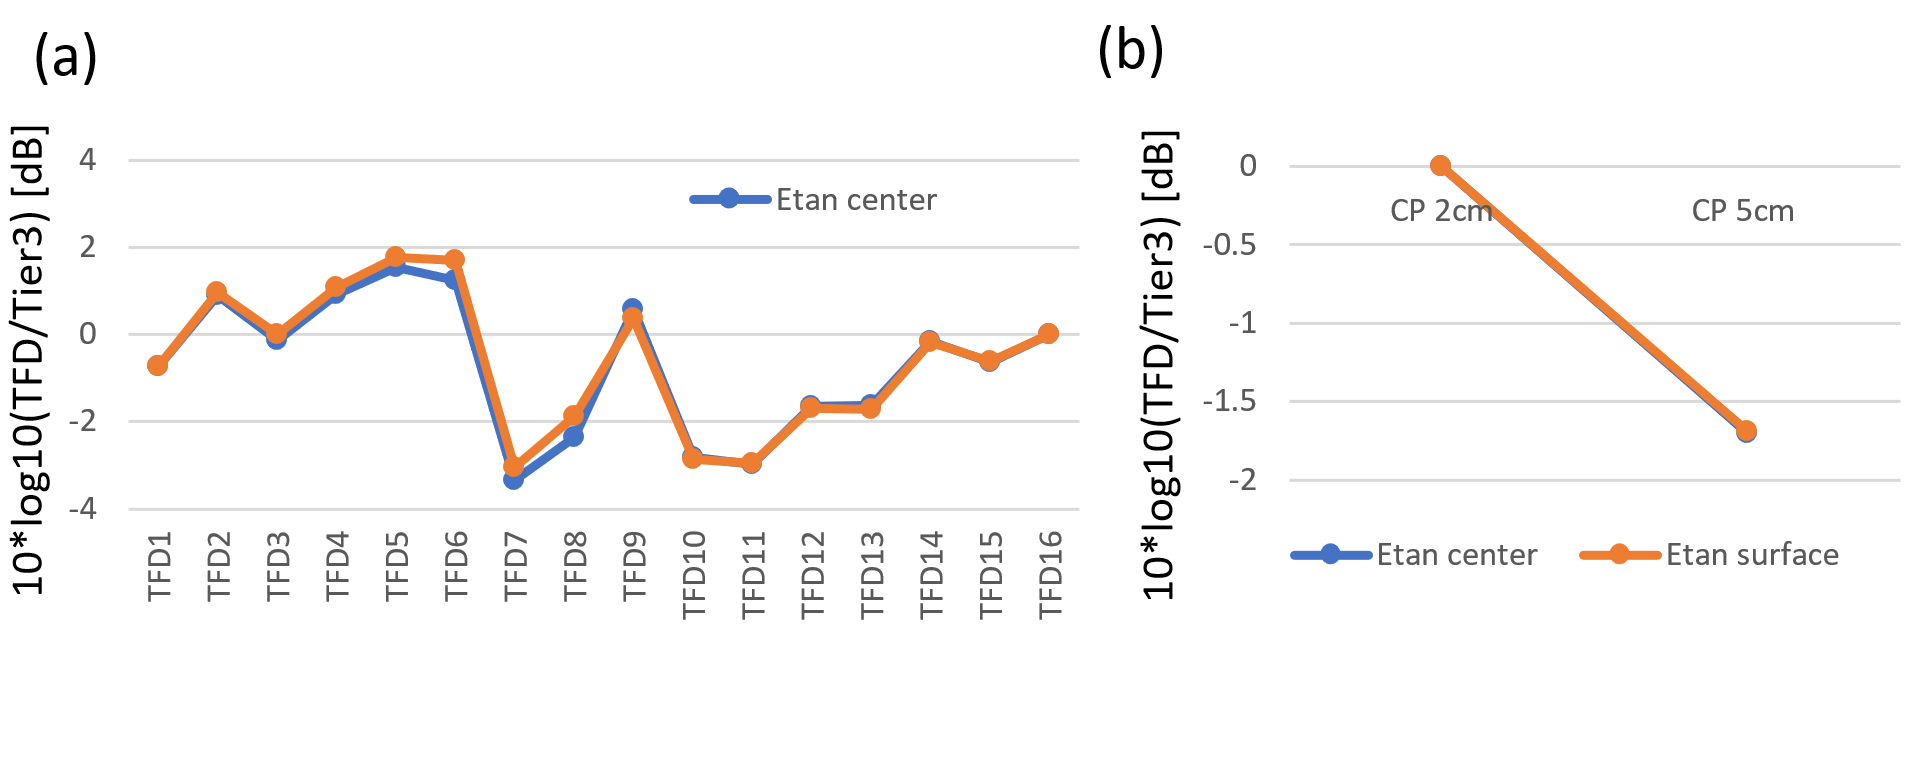
The measured TF of the sample stent at 3T is shown in Fig.1(b), and the device positions superimposed on various TEs along the device trajectory is shown in Fig.3(a). Fig 3(b) compares the measured SAR (W/kg) in the MITS-TT with the estimated SAR from Etan calculated at the center of the stent and at the outer surface. The SAR (W/kg) value deviations from the measured result from MITS-TT were plotted in Fig 5(a) and the maximum deviation was -3.34 dB. The temperature rise at the stent tip in an ASTM phantom were measured at two locations in QBC as shown in Fig.4(c) where maximum 2.6 °C elevation was observed. The measured temperature rise at the tip of the stent is plotted in Fig. 4(c-d) for stents placements shown for circularly polarized (CP) and linear mode QBC excitation. Fig 5(b) shows the temperature rise deviation (in dB) from measured results to the estimated results based on Tier-3 method4 using Etan calculations.Discussion and Conclusion
The traditional TF validation process requires test measurements at least in seven positions2 in the ASTM phantom which is time-consuming work, whereas using the table-top E-field generator that produces multiple incident E-field exposures enabled the completion of 16 test measurements in approximately 1 hour for a given sample position. Here we have demonstrated the validity of the TF approach to assess the RF-induced heating of elongated passive implantable device. We have also employed an alternative compact E-field generator for the TF validation and the assessment of the RF-induced heating. The stent heating was relatively low in the QBC for the applied power to the coil, due to the low conductivity of Nitinol with which it was made and potentially from the effects of the coating placed on the stent. We demonstrated that the table-top E-field generator can be used for RF-induced heating assessment using TF approach with more than 1/3 reduced measurement time, and good agreement on RF deposited power estimation.Acknowledgements
Disclaimer: The
mention of commercial products, their sources, or their use in connection with
material reported herein is not to be construed as either an actual or implied
endorsement of such products by the Department of Health and Human Services.
This presentation reflects the views of the authors and should not be construed
to represent FDA’s views or policies.
References
1. Park, S.-M., Kamondetdacha, R. and Nyenhuis, J.A. (2007), Calculation of MRI-induced heating of an implanted medical lead wire with an electric field transfer function. J. Magn. Reson. Imaging, 26: 1278-1285. https://doi.org/10.1002/jmri.211592.
2. ASTM 2182-19e2, Standard Test Method for Measurement of Radio Frequency Induced Heating On or Near Passive Implants During Magnetic Resonance Imaging
3. Fujimoto K, Angelone LM, Lucano E, Rajan SS and Iacono MI (2018) Radio-Frequency Safety Assessment of Stents in Blood Vessels During Magnetic Resonance Imaging. Front. Physiol. 9:1439. doi: 10.3389/fphys.2018.01439
4. ISO 10974:2018, ‘Assessment of the safety of magnetic resonance imaging for patients with an active implantable medical device.’
Figures