3739
Subject-Specific SAR Maps through Conventional MRI Imaging1Medical Physics, Memorial Sloan Kettering Cancer Center, New York,, NY, United States, 2Advanced Materials Metrology and Life Science, Istituto Nazionale di Ricerca Metrologica, Torino, Italy, 3Department of Cardiology, Boston Children's Hospital, Boston, MA, United States
Synopsis
Keywords: Safety, Safety, Electromagnetic Tissue Properties, SAR
Motivation: To enable real-time SAR monitoring in MRI examinations, particularly when numerical simulations are not feasible.
Goal(s): This work aimed to explore the feasibility of obtaining subject-specific image-based SAR maps directly from conventional MRI sequences in vivo.
Approach: The tissue electrical conductivities were characterized using an MRI phase-based electrical properties tomography approach, and the electric field distribution was measured by applying Ampère's law on the B1 field obtained from B1 mapping.
Results: Subject-specific image-based SAR maps can be obtained from conventional MRI data. Median electrical conductivity values and retrieved SAR maps qualitatively agreed with existing literature.
Impact: We analyze the feasibility of obtaining in vivo subject-specific image-based SAR maps directly from conventional MRI data. The electrical conductivity is obtained through electrical properties tomography (EPT) and the E-field is estimated from the B1 field.
Introduction
The Specific Absorption Rate (SAR) is crucial metric for monitoring the radiofrequency (RF) power absorbed during MRI examinations. In situ scanner SAR assessment estimates an average value based on patient weight and RF calibration. Local SAR distributions and potential hotspots cannot be inferred from this model. Typically, the local SAR distribution is calculated using numerical simulations. However, these simulations require prior knowledge of the RF body-coil characteristics, the creation of a 3D model of the patient's body, and knowledge of the electrical conductivity and permittivity of the examined tissues. Acquiring all this information before an MRI examination is not feasible. Moreover, the numerical simulations are often computationally intensive, making it impractical to assess the patient's SAR distribution in real-time during an MRI exam.Previous work has analyzed subject-specific SAR maps obtained from MRI information in silico1. The objective of this work is to demonstrate the feasibility of obtaining in vivo subject-specific image-based SAR maps directly from conventional MRI data in the brain. To achieve this, it is necessary to characterize the electrical conductivity of the tissues and the distribution of the electric field. The electrical conductivity can be retrieved from the MR image phase using electrical properties tomography (EPT)2. The electric field can be measured by applying Ampère’s law to the B1 field obtained with a B1 mapping method (Recall that $$$\nabla \times B_1 = j\omega\mu_0 \left(\varepsilon - j\frac{\sigma}{\omega}\right) E$$$, where μ0 denotes the permeability of free space, σ denotes the tissue conductivity and ε denotes the tissue permittivity).
Methods
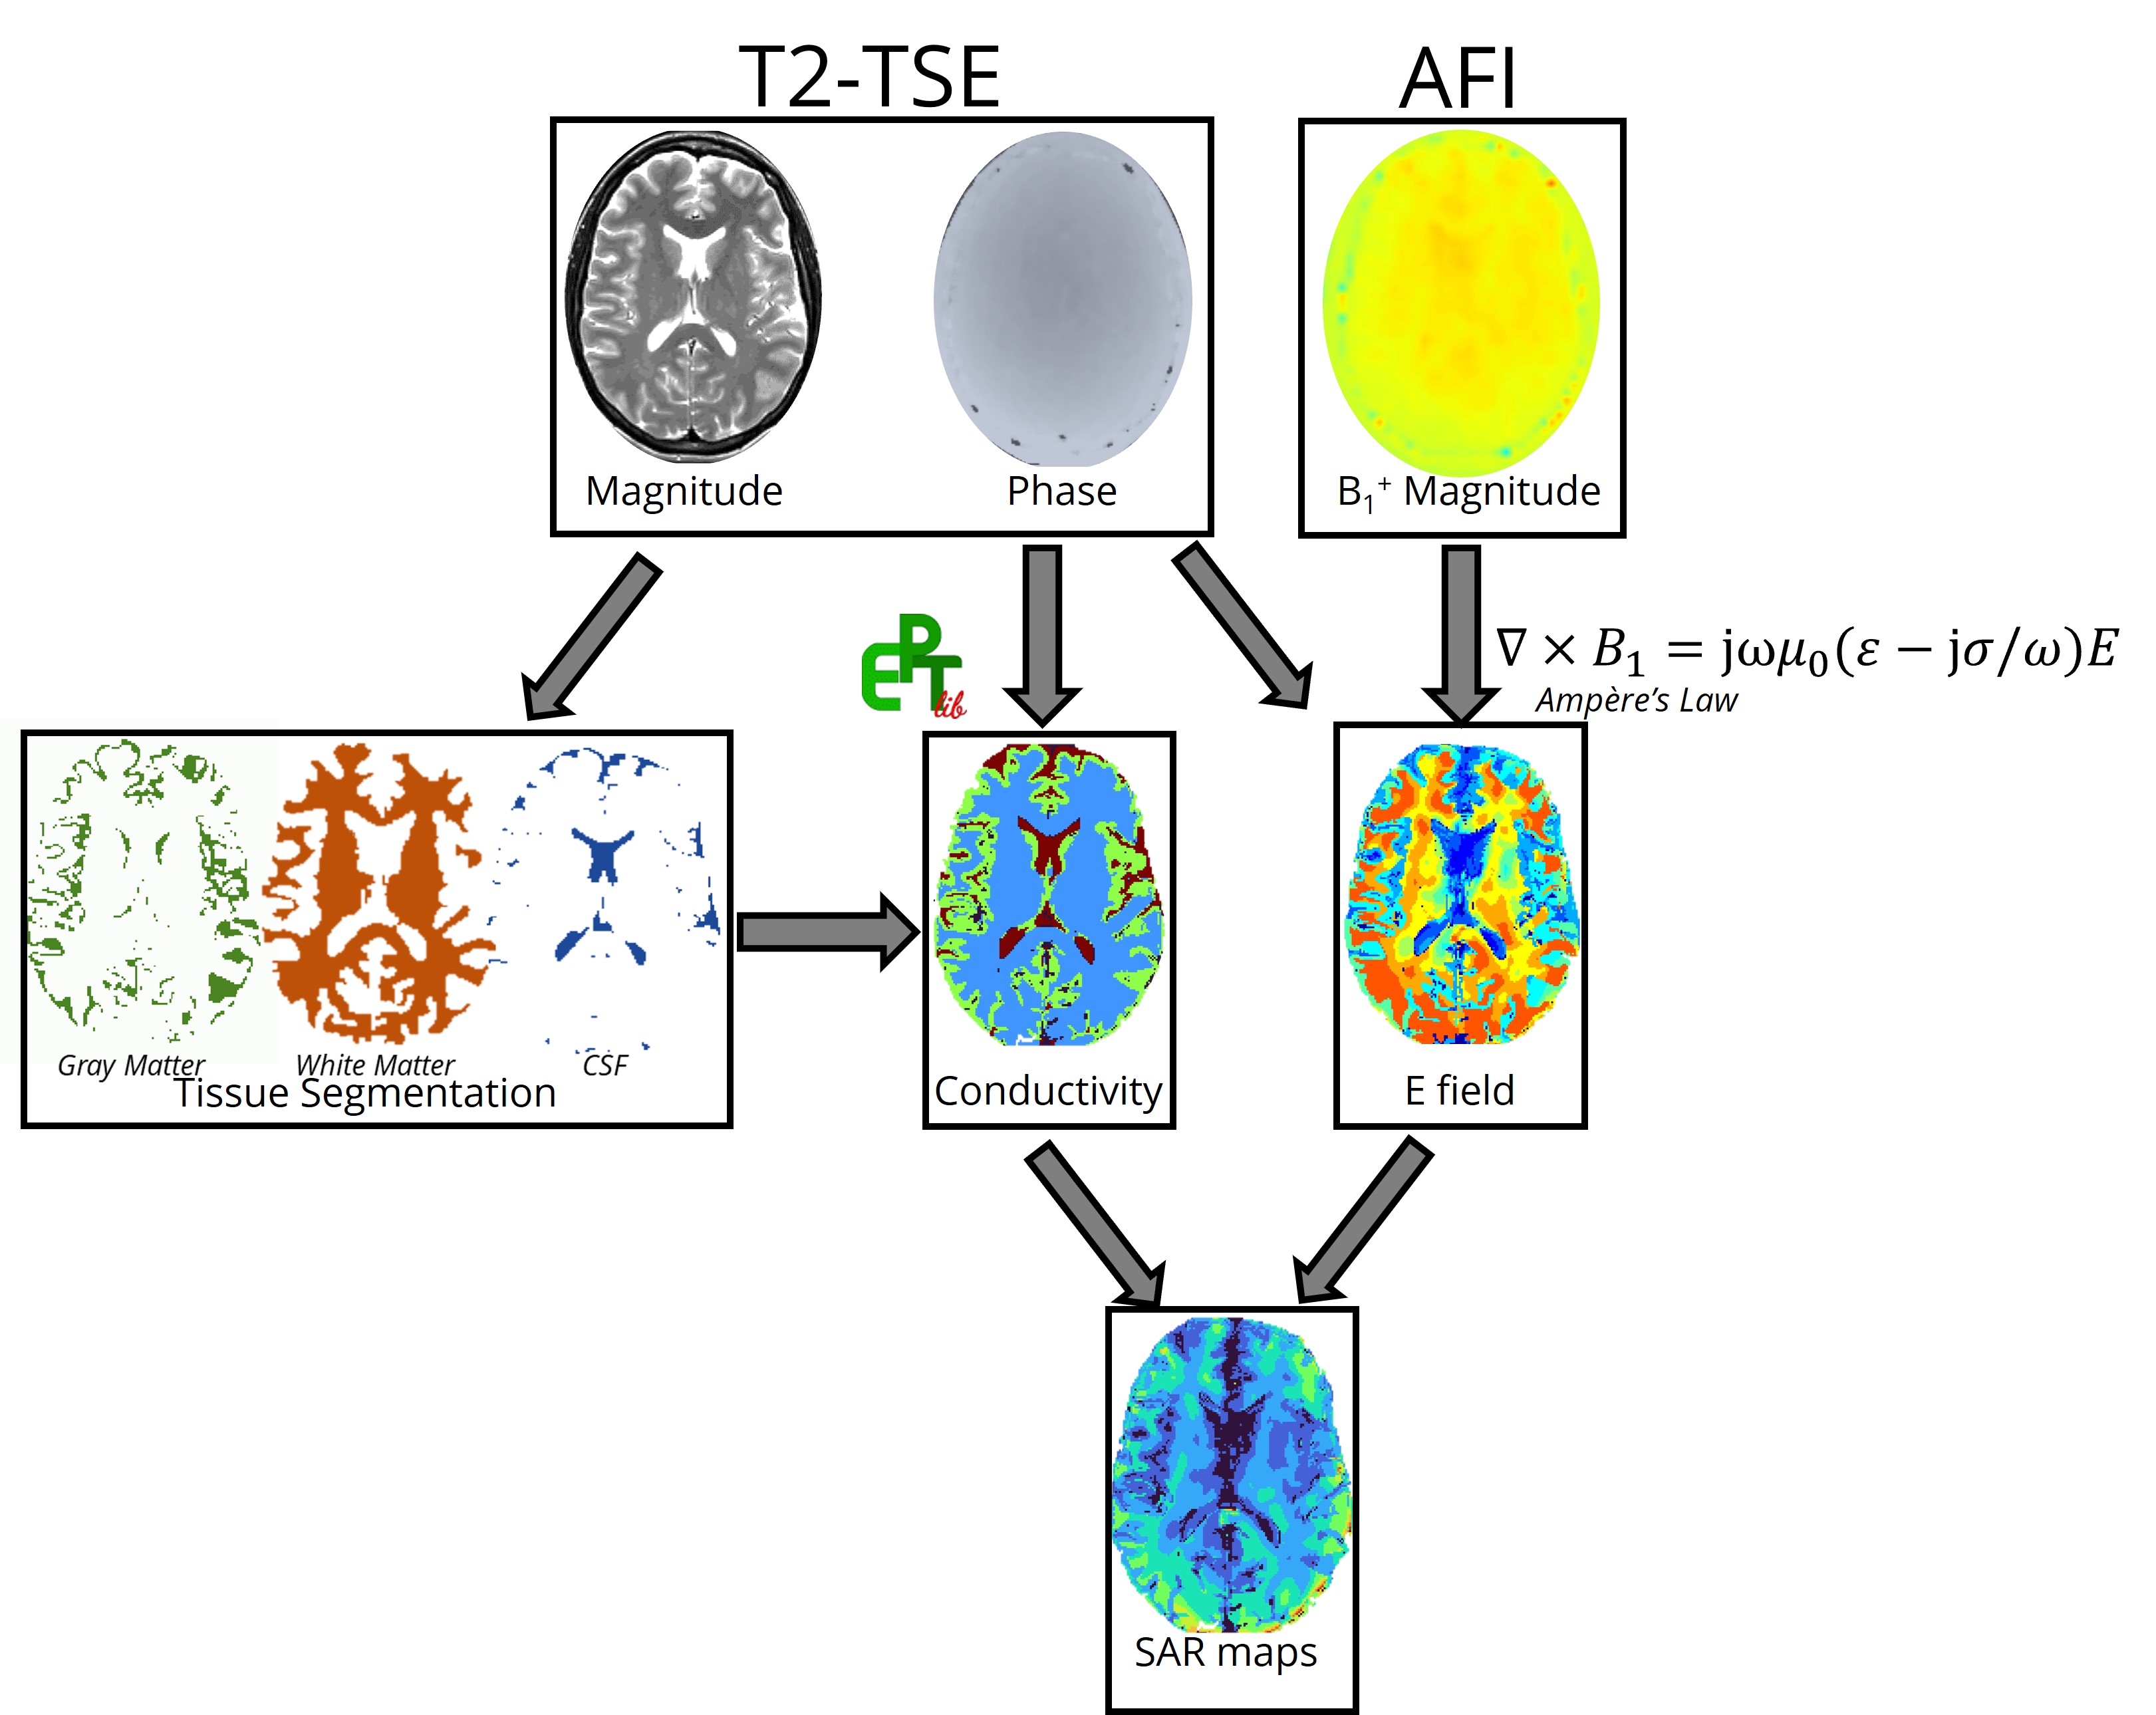
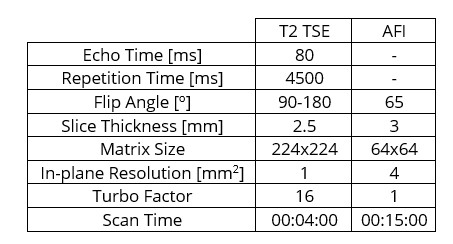
Whole brain subject-specific SAR maps were derived from conventional MRI images acquired at 1.5 T (Ingenia Ambition X, Philips, The Netherlands) using a 52-channel receive head coil on a healthy female volunteer with informed consent. SAR calculations assumed a constant tissue density of 1000 kg/m3. Electrical conductivity was determined using a phased-based EPT method, and the electric field was computed by numerically evaluating the differential form of Ampère’s Law on the B1 field (only the measurable B1+ component is assumed different from zero). Figure 1 provides an overview of the workflow followed in this study.Two sequences were used for SAR mapping: a T2-Turbo Spin Echo (TSE) sequence and an Actual Flip Angle (AFI) sequence. The AFI map was interpolated to match the TSE map. Sequence parameters are summarized in Table 1.
To characterize electrical conductivity, Gray Matter, White Matter and CSF tissues were manually segmented from the magnitude images of the TSE sequence using a segmentation threshold method. The electrical conductivity for each segmented tissue was determined using the phase images of TSE sequence and a phase-based Helmholtz approach implemented in EPTLib3 with an elliptical Savitzky-Golay filter (size = [2,2,2]). The median electrical conductivity along all slices for each tissue was used for SAR calculation (computational time = 7 s).
The E-field was obtained by numerically evaluating Ampère’s law using the Savitzky-Golay filter on the B1+ field. The B1+ magnitude was derived from the AFI sequence, while the B1+ phase corresponded to half the phase of the T2-TSE sequence. The relative electrical permittivity values for each tissue were obtained from IT’IS Foundation database4 (Gray Matter: 97.4, White Matter: 67.8, CSF: 97.3).
10g SAR maps were also calculated by averaging the retrieved SAR values in a cube of 10 cm3.
Results
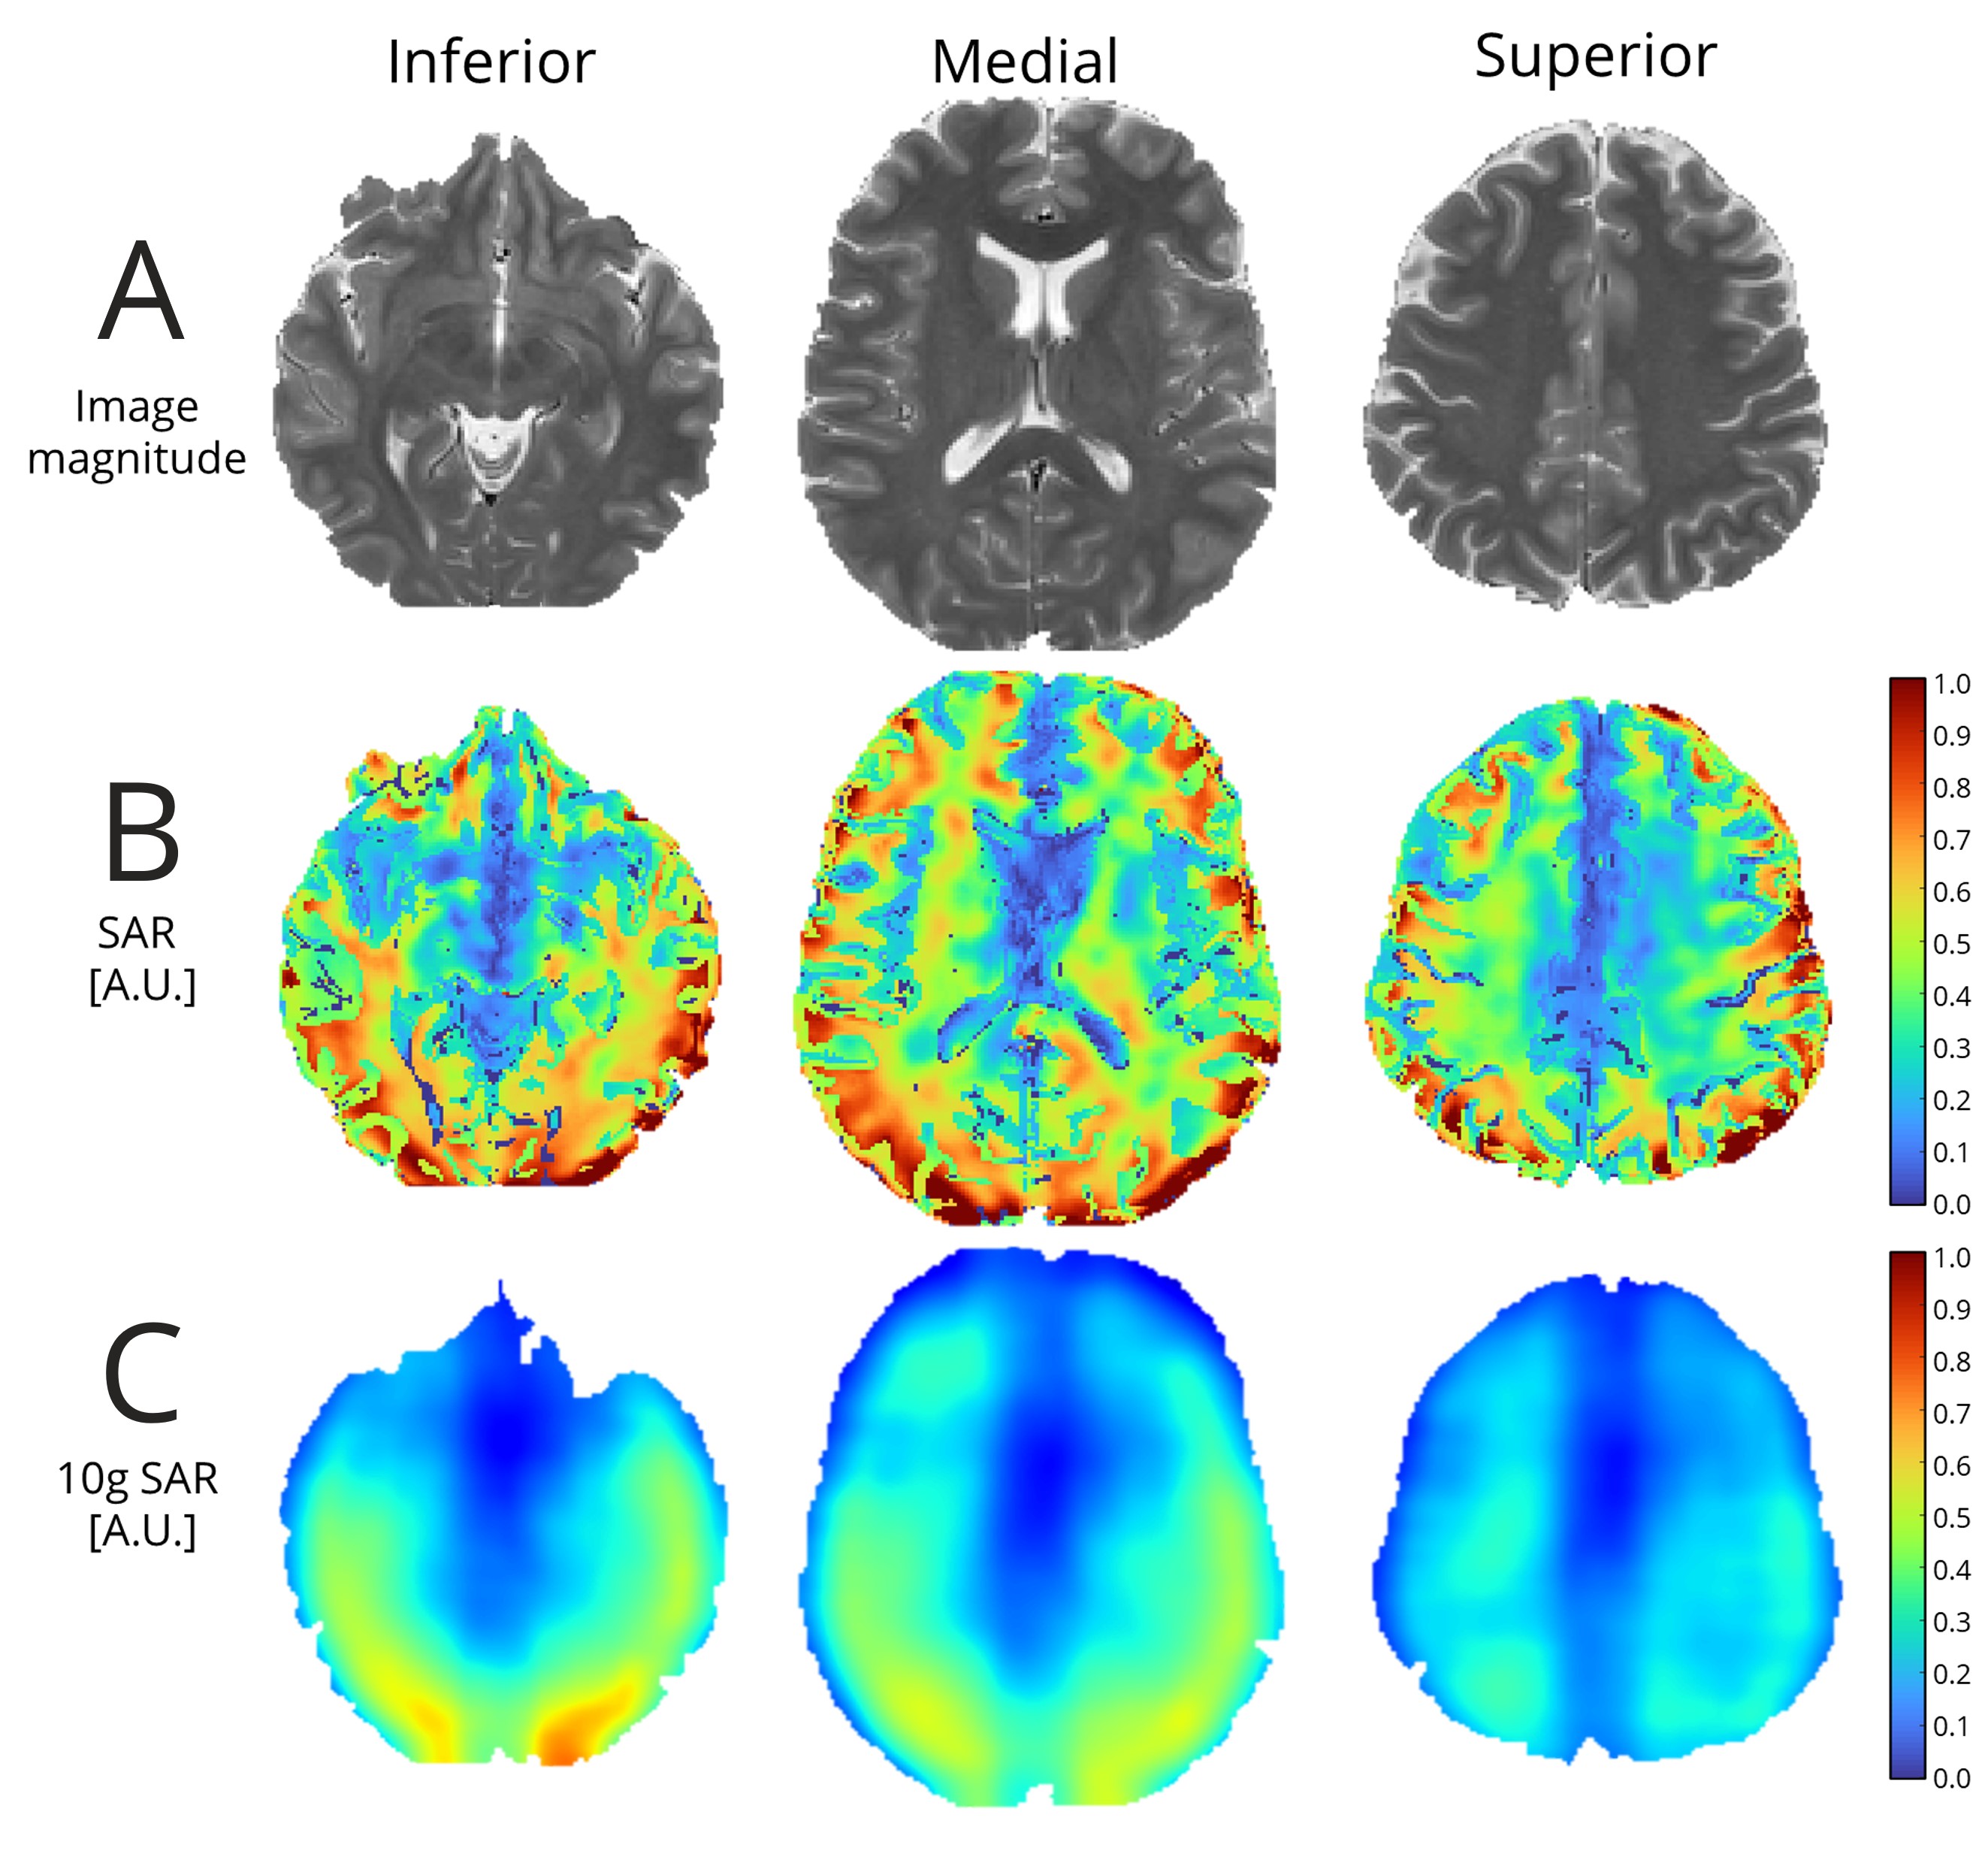
The retrieved median [interquartile range] electrical conductivity values obtained through EPT were as follows: 0.764 [1.870] S/m for Gray Matter, 0.308 [2.345] S/m for White Matter, and 1.605 [1.592] S/m for CSF. The calculated values follow a similar trend to values in literature4.Figure 2 shows the inferior, medial, and superior parts of the brain magnitude images acquired with the T2-TSE sequence (Figure 2-A), the image-based subject-specific SAR maps (Figure 2-B), and the 10g SAR maps (Figure 2-C).
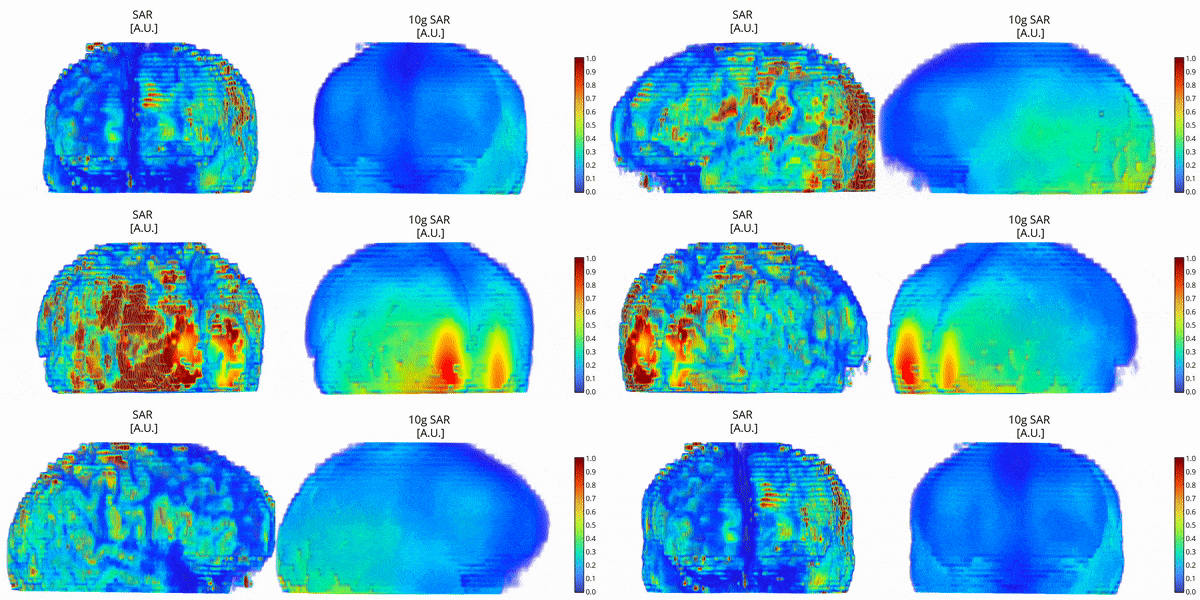
Figure 3 shows the image-based subject-specific 3D SAR and the 10g SAR maps. Both SAR and 10g SAR maps present higher SAR values on the caudal posterior regions of the brain, with lower SAR values in the medial area. Qualitatively, these observed SAR distributions agree with previously reported simulated SAR maps5.
Conclusions
The results demonstrate the feasibility of deriving subject-specific SAR maps from conventional MRI data. In cases where numerical simulations are not feasible, image-based SAR maps can serve as a valuable tool for real-time monitoring of potential hotspots during MRI examinations. Future work will focus on: refining the sequence acquisition protocol; investigating and correcting the error due to the use of the B1+ component only; propagating the uncertainty from the conductivity estimate to SAR; scaling the maps to follow a specific MR sequence.Acknowledgements
No acknowledgement found.References
- Martinez, Jessica A., et al. "Evaluation and Correction of B1+-Based Brain Subject-Specific SAR Maps Using Electrical Properties Tomography." IEEE Journal of Electromagnetics, RF and Microwaves in Medicine and Biology (2023).
- Katscher, Ulrich, and Cornelius AT van den Berg. "Electric properties tomography: Biochemical, physical and technical background, evaluation and clinical applications." NMR in Biomedicine 30.8 (2017): e3729.
- Arduino, Alessandro. "EPTlib: An open-source extensible collection of electric properties tomography techniques." Applied Sciences 11.7 (2021): 3237.
- Hasgall PA, et al. “IT’IS Database for thermal and electromagnetic parameters of biological tissues”. itis.swiss/database
- Wang, Zhangwei, et al. "SAR and temperature: simulations and comparison to regulatory limits for MRI." Journal of Magnetic Resonance Imaging: An Official Journal of the International Society for Magnetic Resonance in Medicine 26.2 (2007): 437-441.
Figures