3738
Validation and SAR evaluation of a 16-channel 1H/23Na dipole/loop array for 7T MRI1King's College London, London, United Kingdom, 2London Collaborative Ultra high field System (LoCUS), London, United Kingdom, 3MR Research Collaborations, Siemens Healthcare Limited, Camberley, United Kingdom
Synopsis
Keywords: Safety, RF Arrays & Systems
Motivation: 7T MRI enables 23Na MRI due to enhanced sensitivity. Combined with proton imaging, functional and anatomical information can be acquired to characterise brain status.
Goal(s): Establishing safe RF power limits for an in-house built 1H/23Na loop/dipole array for subsequent in-vivo experiments.
Approach: Phantom MR results at 7T and electromagnetic simulations were compared to evaluate consistency between experiments and simulations. Human models were simulated to demonstrate SAR10g levels for different patients.
Results: Simulated and experimental B1+fields showed high correlation for individual magnitudes and phases. Worst-case SAR10g for human models all remain within safety limits, demonstrating the clinical potential of our proposed coil.
Impact: Towards in-vivo RF coil use, we validated simulated RF models of the coil at 23Na/1H frequencies using measured B1+field magnitude and phase maps. Safe RF power limits can therefore be established for research coils to proceed to in-vivo experiments.
Introduction
Current commercial multi-nuclei coils suffer from stringent specific absorption rate(SAR) limits, reducing available B1+ RMS below that required for many anatomical and metabolic imaging protocols. For example, a popular commercial dual-tuned proton(1H)/sodium(23Na) coil is three times lower with its SAR limit for proton compared to a corresponding proton-only coil. Similarly, SAR limits for the non-proton channel are much lower than for the proton-only coil. In this study, we aimed to characterise our recently proposed 16-channel 1H/23Na head coil design1 by developing realistic RF simulations and validating them to enable SAR level estimations.Methods
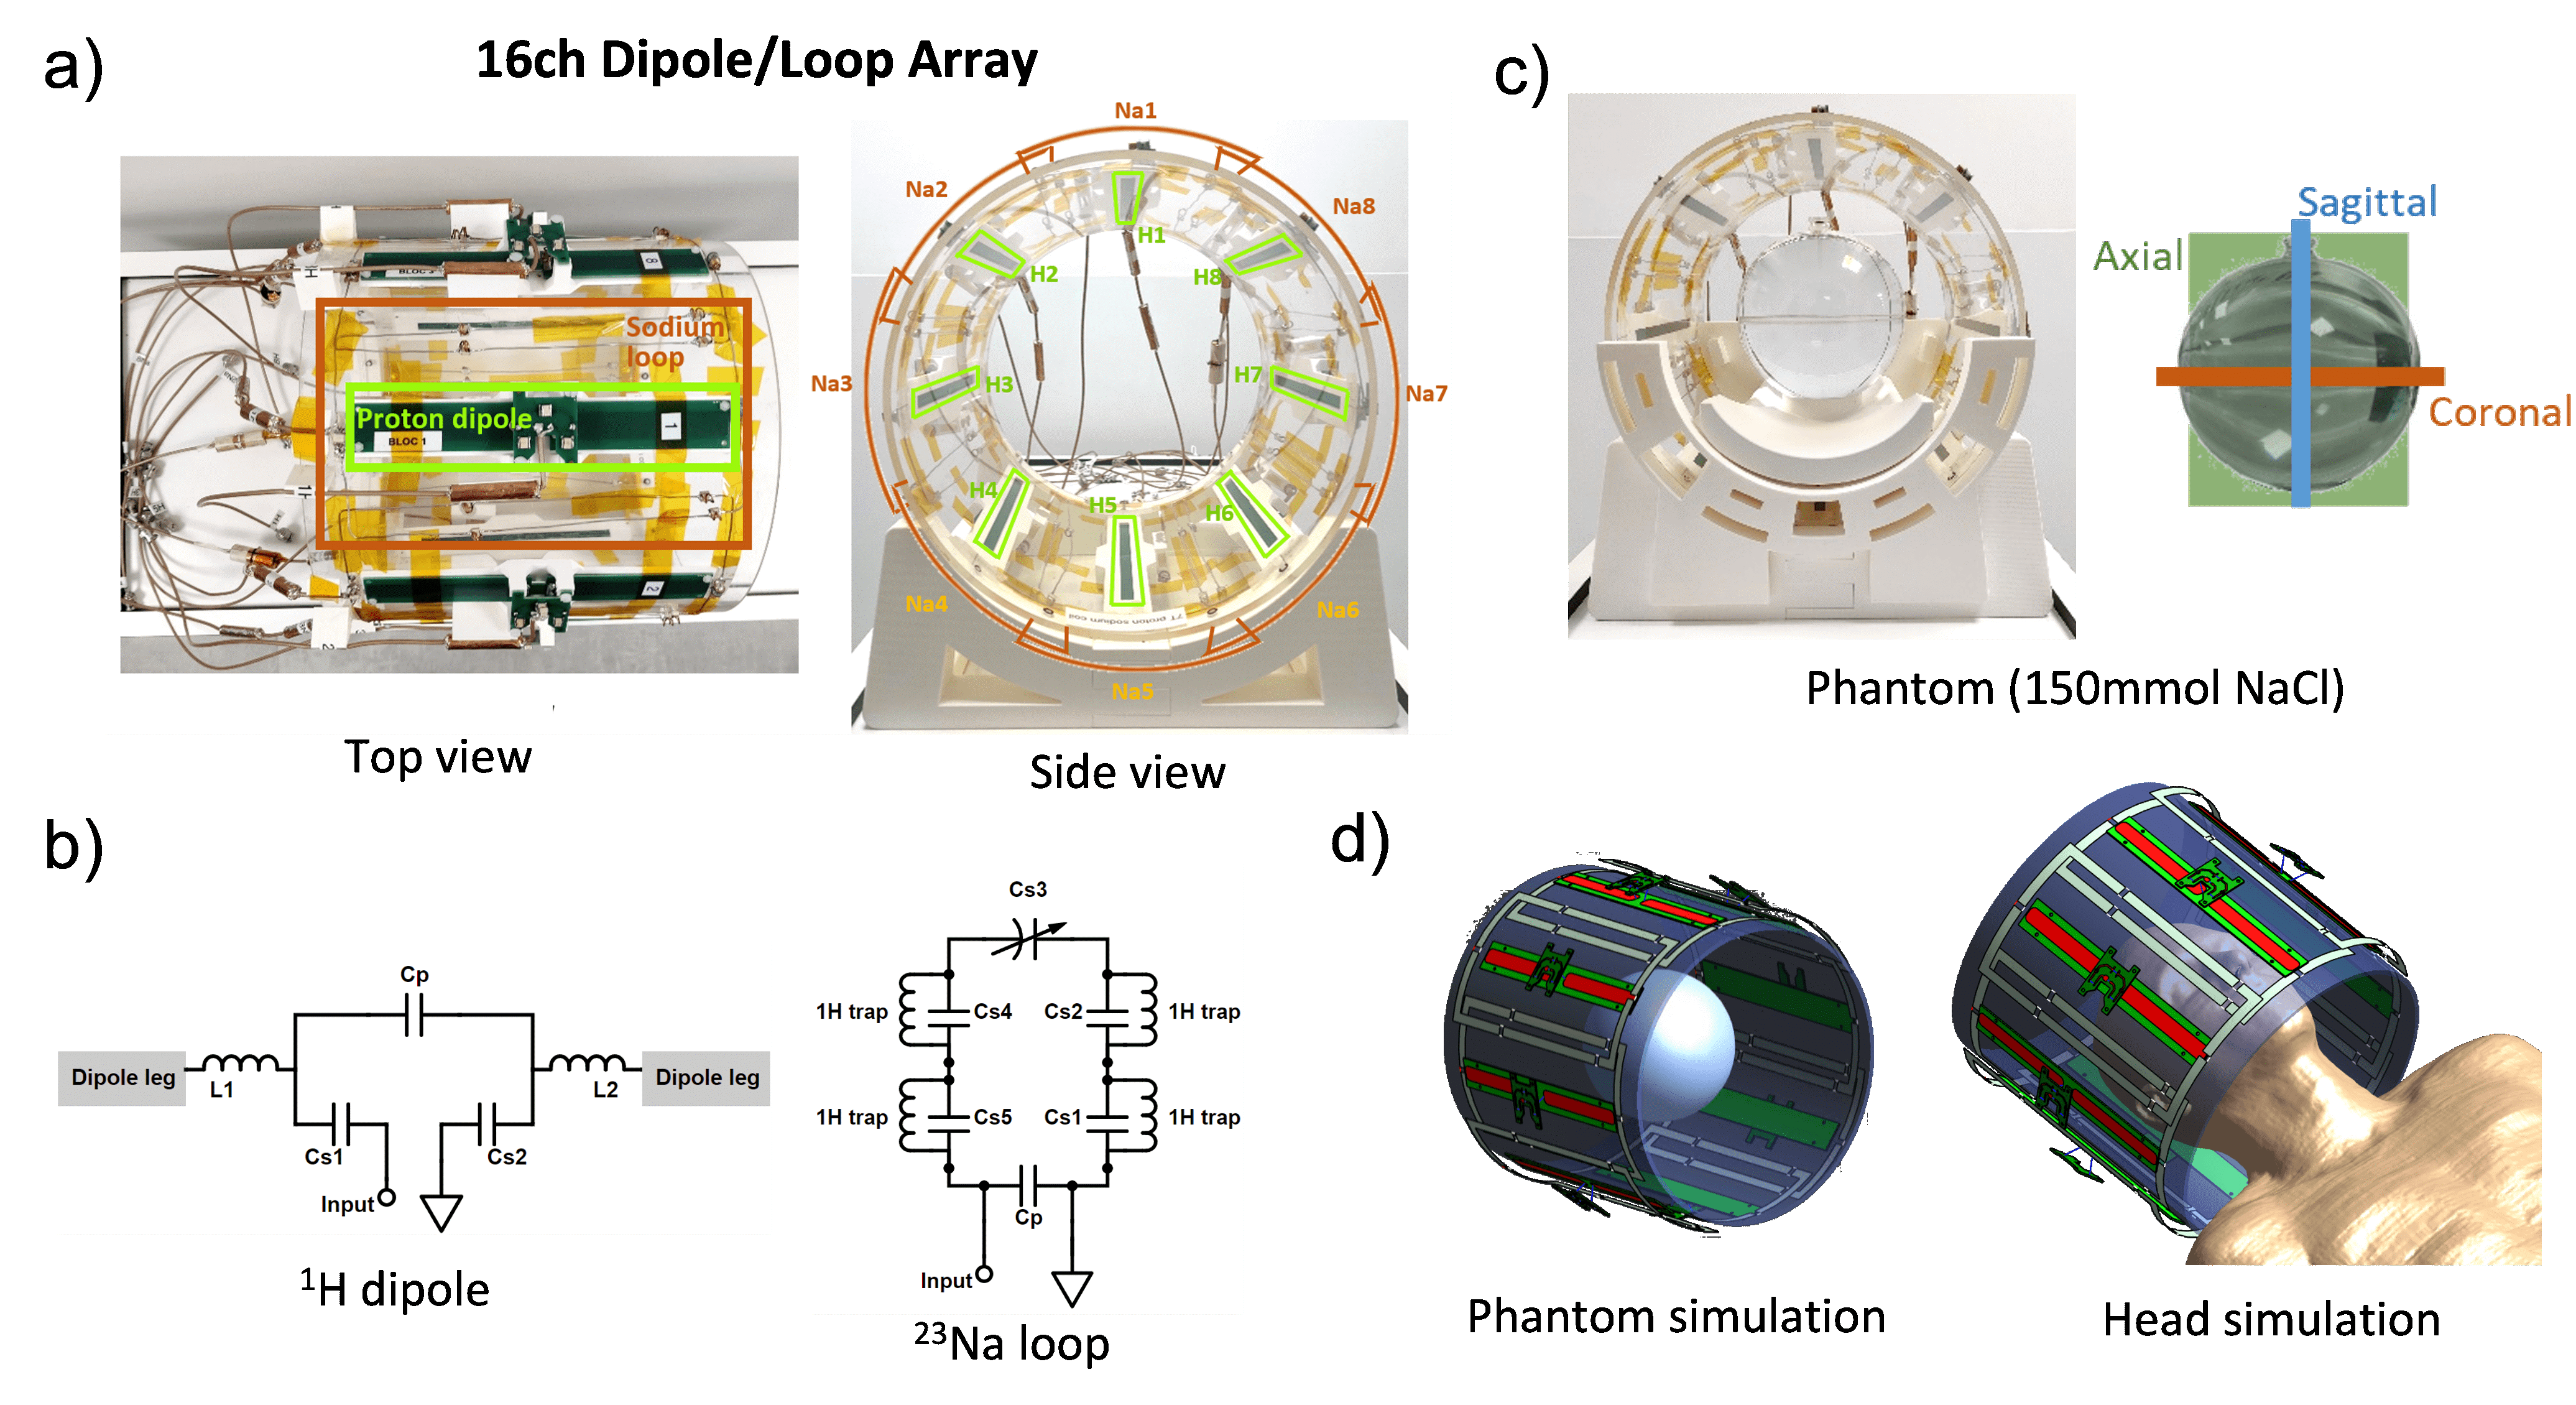
Experimental data collection The coil consists of eight 1H dipoles and eight 23Na loops as reported previously1.(Fig1a,c) Experiments were conducted with a spherical phantom(d=15cm, 150mM NaCl).(Fig.1b) S-matrices were recorded from vector network analyser(VNA)(E5063A ENA, Keysight) on the bench(Fig.2). MR data were acquired on parallel-transmit for proton and single-transmit for sodium on 7T MR scanner(MAGNETOM Terra,Siemens,Germany). The coil was connected to a power splitter and respective TR switches(MR coiltech,UK) for each acquisition. 1H radiofrequency field(B1+) maps were acquired with TFL sequence2(TR/TE=5000ms/1.55ms,FA=5deg,2.0×2.0x5.0mm3,bandwidth=450Hz/pixel,TA=9s). Sodium B1+ maps were calculated with the double-angle method3 acquired by 2D GRE sequences(TR/TE=150ms/1.92ms,FA=45/90deg,6.6×6.6x25.0mm3,32 averages,bandwidth=600Hz/pixel,TA=2min6s). For both nuclei, two modes were adopted: volume transmit mode where all eight channels are transmitting simultaneously or surface coil transmit mode where only one element of the array is transmitting at a time. In both cases signal was received through all eight channels.Simulation data collection FDTD simulation (Sim4life 7.2, ZMT, Switzerland) was performed in three setups: phantom-centred for simulation validation, and brain-centred with Duke/Ella human model4 for SAR evaluation.(Fig.1d) Phantom results are tuned and matched to similar level as bench measurements with Optenni (OptenniLab5.2, Finland).(Fig.2) Same circuitry was applied to both human model simulations.
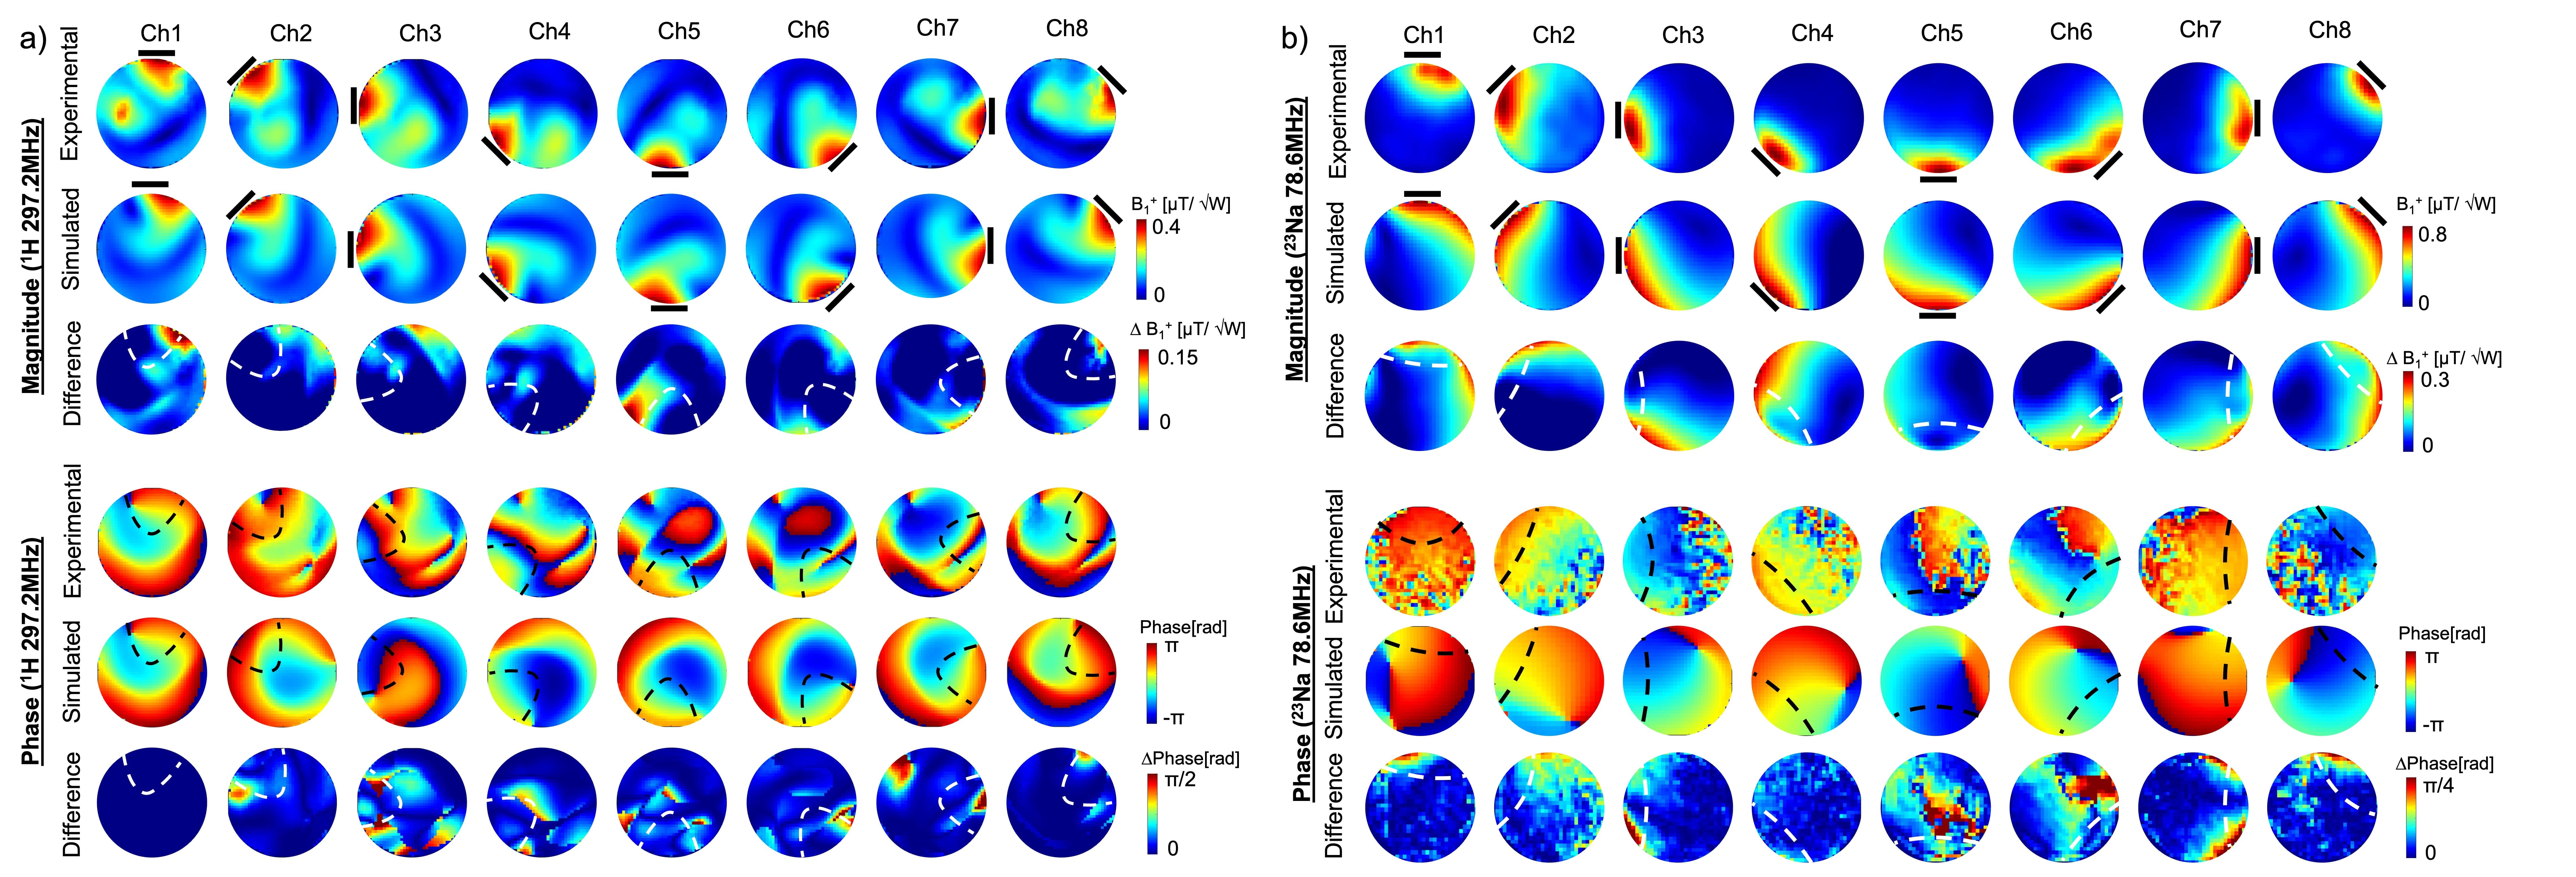
B1+ magnitude mapping Experimental B1+ field maps were reconstructed for individual channels from surface coil transmit mode for both nuclei while simulated B1+ maps are directly exported from Sim4Life. Difference maps are calculated for the magnitudes.
B1+ phase mapping The experimental individual receiver sensitivity is characterised from volume transmit mode as $$$R_i = \frac{S_i}{\sqrt{\sum(S_i \cdot S_i^*)}}$$$ where Si is signal from individual receiver i. For given transmit channel j, the sensitivity $$$T_j = \sum \frac{S_{j,I}}{R_i}$$$ where Sj,i represents the signal acquired when transmitting with channel j and receiving with channel i in surface coil transmit mode. The relative sensitivity for each transmit channel Trel,j is therefore calculated by taking one transmit channel T1(arbitrary choice) as the reference:$$$T_{rel,j}=\frac{T_j}{T_1}$$$. The relative phase is derived from Trel,j (by definition channel 1 has zero relative phase). Final experimental phase maps are computed by multiplying relative phases to channel 1 simulated data to enable a straightforward comparison.
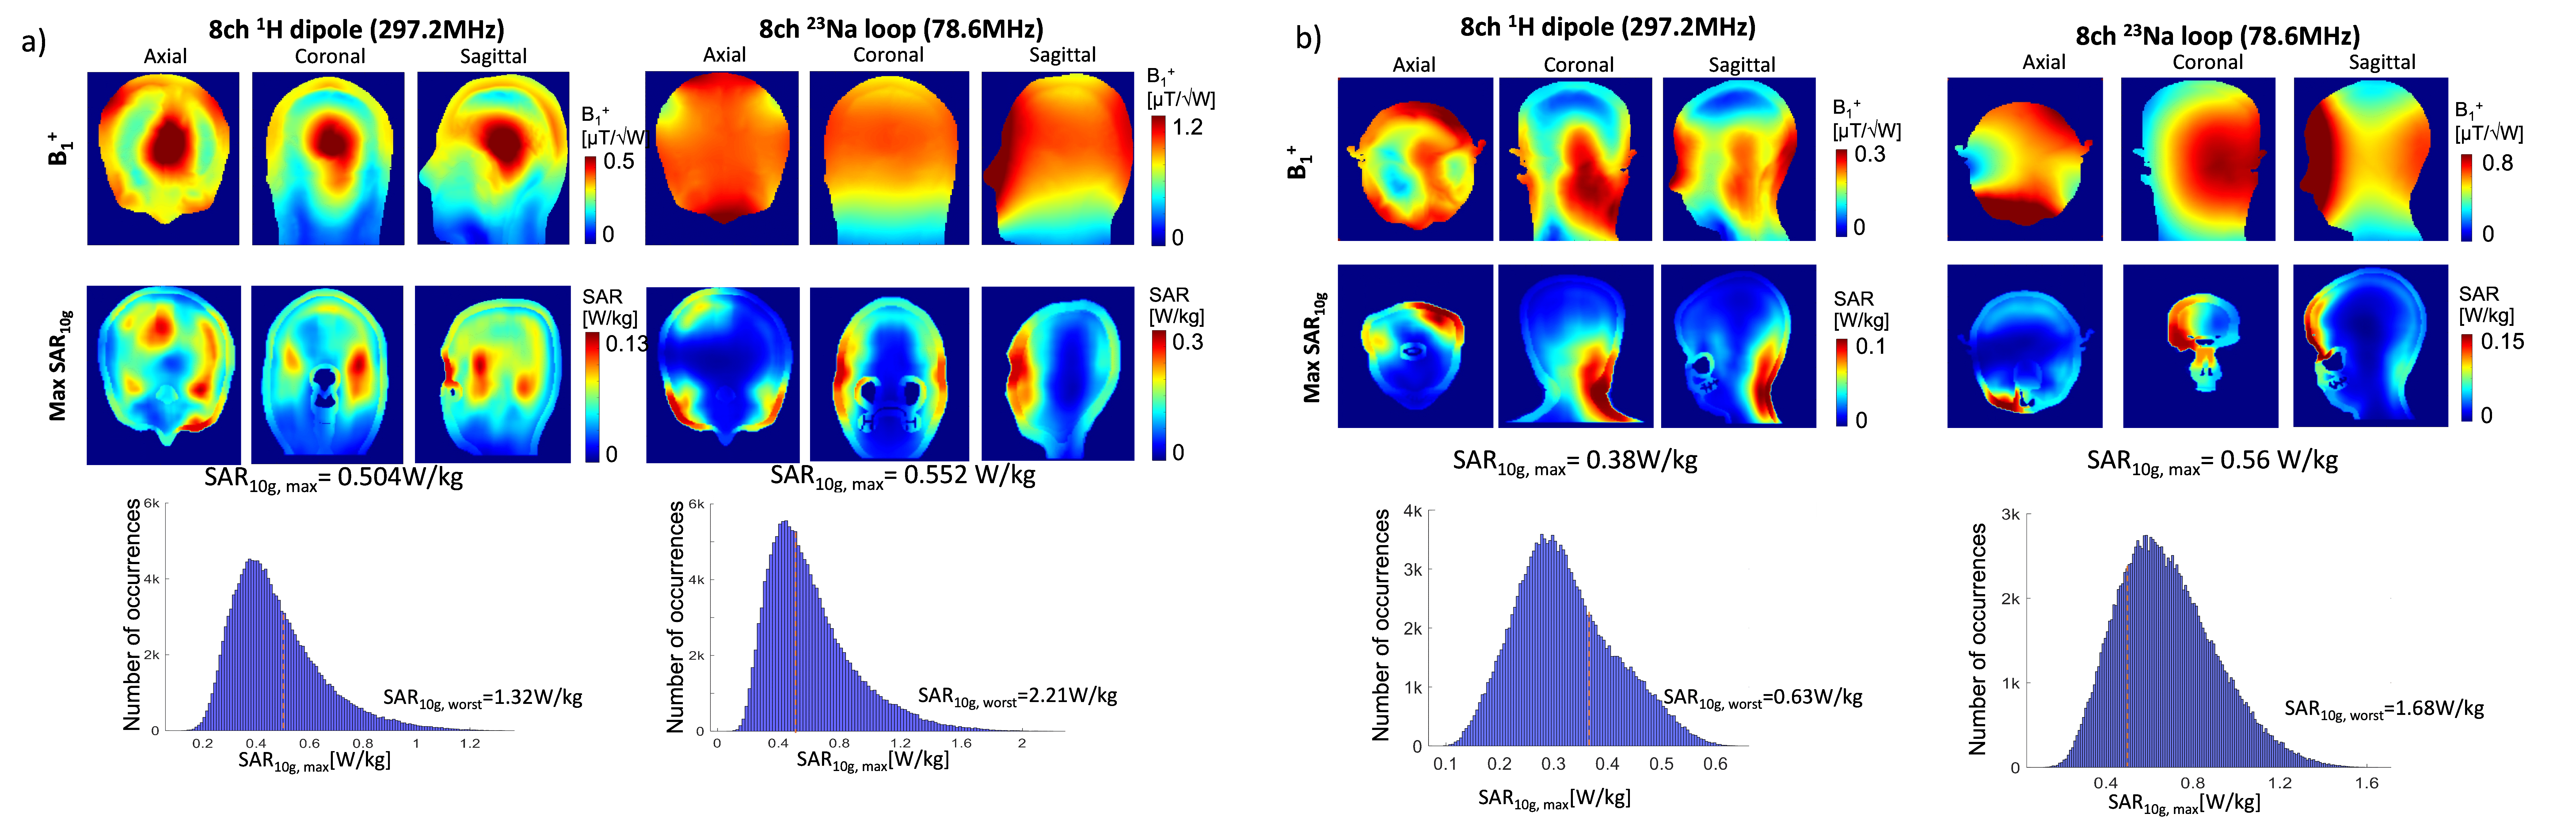
SAR calculations Q matrices5 were computed for 10g tissue mass-average and SAR10g was calculated for the adult head. Virtual observations points(VOPs) were derived from the SAR matrices calculation, and maximal SAR10g values were computed for 150k random RF shim sets. All results were normalised to 1W total input power.
Results
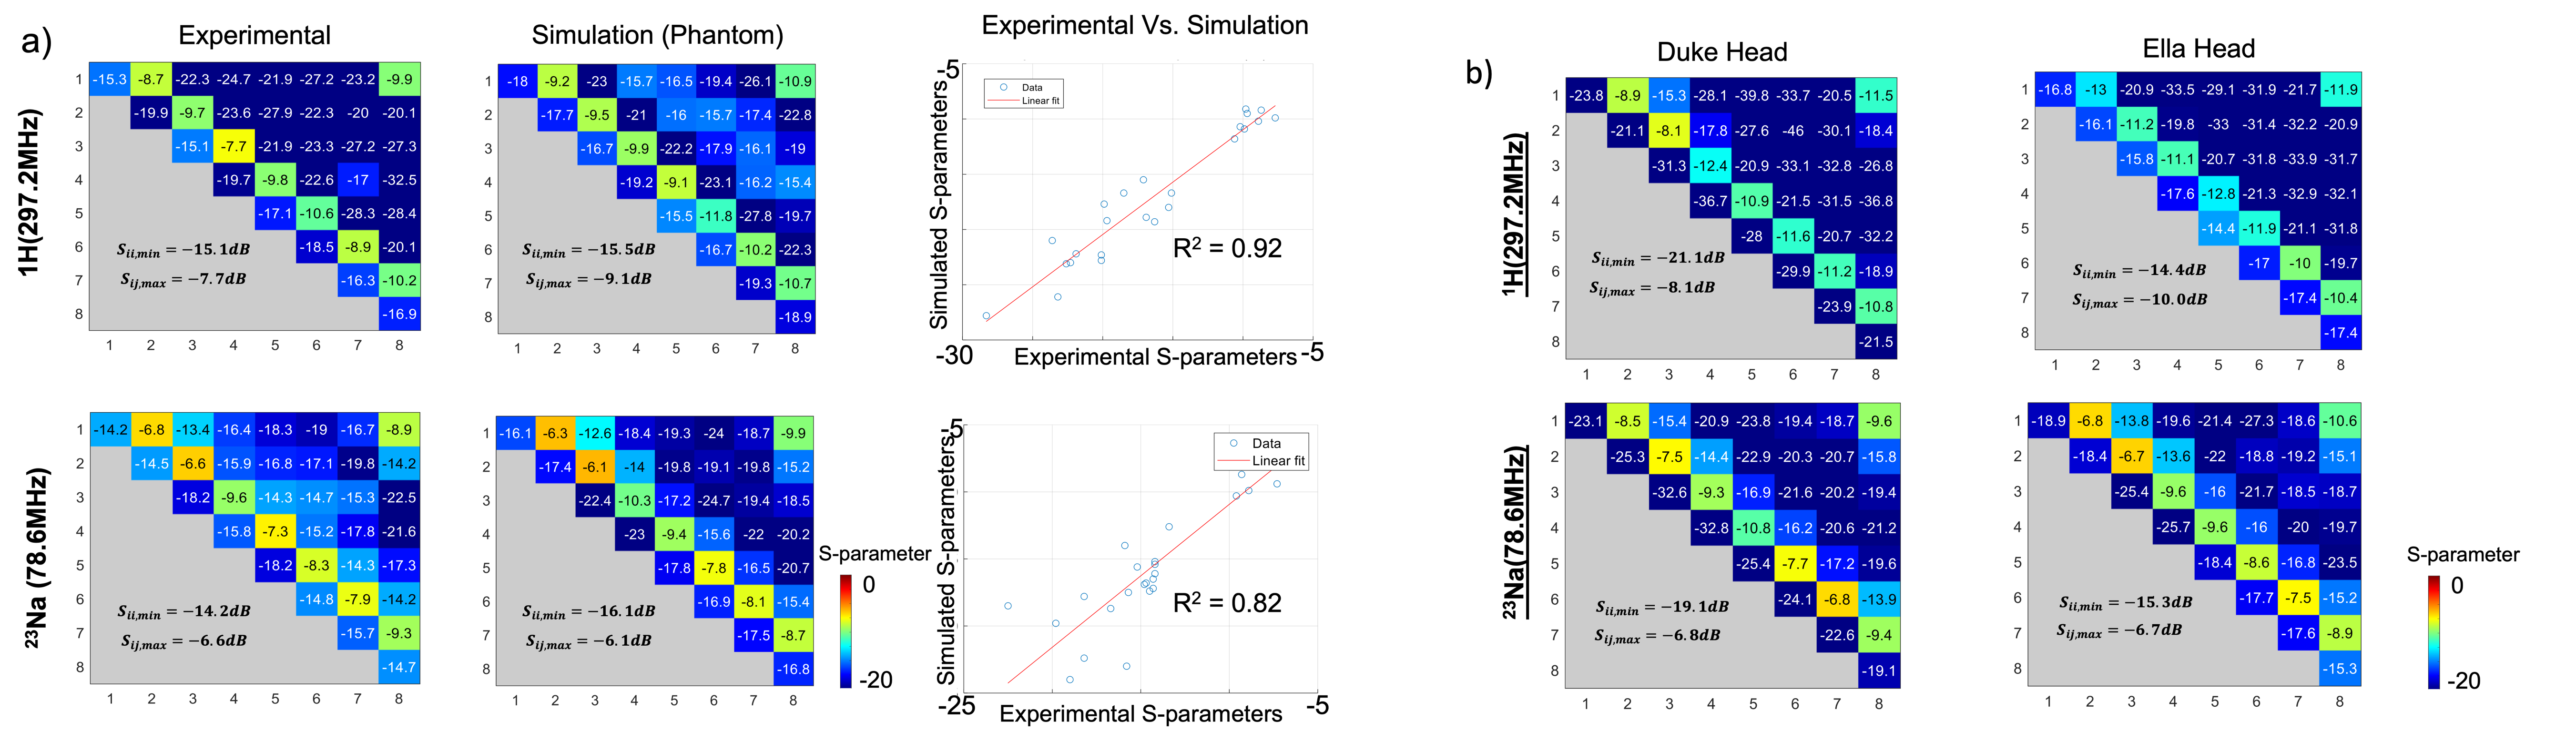
Linear regression of experimental and simulated S-matrices reported R2 of 0.92 and 0.82 for 1H and 23Na respectively.(Fig.2a) The in-silico coil remained well tuned and matched when switching between different human models.(Fig.2b) The maximum normalized root-mean square error(NRMSE) for individual simulated and measured B1+-field magnitude maps was 9.8% for 1H and 17.3% for 23Na. The averaged phase differences between individual phase maps were for 32.4 degrees for 1H and 24.7 degrees for 23Na within the area underneath the coil defined by signal intensities.(Fig.3) Human model simulations reported peak SAR10g of 0.5W/kg for 1H and 0.55W/kg for 23Na for Duke whereas it’s 20% lower for 1H and similar level for 23Na in Ella.(Fig.4a) The distribution over 150K RF shims indicated 95% of the computed SAR10g,max values are below 0.55W/kg for 1H and below 0.8W/kg for 23Na in the worst case.Discussion
The 16ch dipole/loop array demonstrated robustness against load-variation when the phantom model was switched to human head models. A good match between B1+ magnitude and phase maps from phantom measurements and corresponding simulations validates the model. Higher SAR10g was reported for Duke compared to Ella due to the bulkier model. However, the worst case SAR10g remains within relevant safety limits (i.e.head SAR limit as 3.2 W/Kg). SNR quantification and in-vivo data will be acquired for further assessment.Conclusion
In this work, we have validated phantom results to characterise a custom-built 16-channel dipole/loop array for 7T MRI. Electromagnetic simulation results aligned well with measurements and established safe RF power limits for in vivo studies. Future development would enable simultaneous ¹H/²³Na imaging to benefit patient diagnosis.Acknowledgements
This work was supported by King’s China Scholarship Council, by core funding from the Wellcome/EPSRC Centre for Medical Engineering [WT203148/Z/16/Z], Wellcome Trust Collaboration in Science grant [WT201526/Z/16/Z] and by the National Institute for Health Research (NIHR) Clinical Research Facility based at Guy’s and St Thomas’ NHS Foundation Trust and King’s College London. The views expressed are those of the author(s) and not necessarily those of the NHS, the NIHR or the Department of Health and Social Care.References
1. Wu M, Clément J, Vliem J. Proc. Intl. Soc. Mag. Reson. Med. 31. 2023. A 16-Channel Proton/Sodium Transmit/Receive Array Design for 7 Tesla Head Imaging.
2. Fautz HP, Vogel M, Gross P, Kerr A, Zhu Y. B1 mapping of coil arrays for parallel transmission.
3. Bottomley PA, Ouwerkerk R. The Dual-Angle Method for Fast, Sensitive T1 Measurement in Vivo with Low-Angle Adiabatic Pulses. J Magn Reson B. 1994 Jun 1;104(2):159–67.
4. Gosselin MC, Neufeld E, Moser H, Huber E, Farcito S, Gerber L, et al. Development of a new generation of high-resolution anatomical models for medical device evaluation: the Virtual Population 3.0. Phys Med Biol. 2014 Aug;59(18):5287.
5. Ipek Ö, Raaijmakers AJ, Lagendijk JJ, Luijten PR, van den Berg CAT. Intersubject local SAR variation for 7T prostate MR imaging with an eight-channel single-side adapted dipole antenna array. Magn Reson Med. 2014;71(4):1559–67.
Figures